



Introduction
Echinops setifer (Jeolgutdae in Korean) is a herbaceous perennial that belongs to the genus of Echinops setifer, family of compositae and order of asterales, originating from Korea and Manchuria in terms of plant geography. The Echinops setifer has been introduced from Korea to Japan during the Quaternary period (Murata, 1977). Echinops, the genus name of Echinops setifer, is a compound of the Greek words echinos (hedgehog) and pos (feet), and the species name setifer means ‘having thorny hair.’ The scientific name Echinops setifer originates from how the shape of the round hair-shaped inflorescence is like the feet of thorny hedgehog (Kawatani et al., 1967).
The flowers of Echinops setifer are receiving attention as ornamental plants, and its roots are used as medicinal herb named lou lu (radix rhapontici) effective for lowering fever, curing nursing breasts that are running dry, blue heat, alleviating heat, detoxification, healing wounds, treating pleurisy, curing breastfeeding problems, and facilitating blood flow (Heo, 2015). The Ministry of the Environment in Japan has designated Echinops setifer as an endangered species and is studying protective measures (Kaneko et al., 2009; Nakanishi, 2010; Sugimura, 2002), and garden cultivars for flowering are developed and distributed in Europe.
Echinops setifer has been widely known as ornamental plant and medicinal herb. There were no cases in which it was distributed as rice cake and edible resource (Bae et al., 2005; Cho et al., 2005; Cho et al., 2007; Im et al., 2011; Oh et al., 2010; Park and Chun, 2015). Even surveys on traditional rice cake did not show any report about how it was used as a source of rice cake (Kim et al., 2012; Kim et al., 2014; Won et al., 2008). However, Heo (2015) discovered that the plant used in bunchu rice cake, which was known to be the most delicious and stickiest rice cake in Naju in the past. It was also used as an excellent rice cake resource in Jeongeup and Jeonbuk (Cho et al., 2017a, b). Echinops setifer has traditionally been used as an edible resource plant in some regions and thus has developed the value of usage and the cultural aspect of the plant. However, there is almost no specific research on regional name and use method of Echinops setifer.
Therefore, this study was conducted to examine the regional name, use and availability of Echinops setifer with a survey on the elderly living in Jeonnam where the culture of using Echinops setifer as a rice cake resource is being passed down.
Research Method
Survey period, subject and region
The survey for this study was conducted from January 2015 to the end of December 2016. The subjects were the elderly women aged 60 or over (as of the end of 2016) living in 21 cities and counties of Jeonnam province, with total 282 respondents including 74 in their 60s (26.2%), 82 in their 70s (29.1%), 89 in their 80s (31.6%), and 37 in their 90s (13.1%) (Table 1). The survey was conducted by visiting 21 cities and counties in Jeonnam: Seongjeon-myeon in Gangjin, Donggang-myeon in Goheung, Gokseong-eup and Gyeom-myeon in Gokseong, Bonggang-myeon in Gwangyang, Gurye-eup and Yongbang-myeon in Gurye, Dasi-myeon, Munpyeong-myeon, Dado-myeon and Seji-myeon in Naju, Damyang-eup and Mujeong-myeon in Damyang, Illo-eup and Mongtan-myeon in Muan, Mundeok-myeon, Boknaemyeon and Beolgyo-eup in Boseong, Juam-myeon in Suncheon, Aphae-myeon in Sinan, Cheongsan 2-gu in Yeosu, Gunnam-myeon and Bulgap-myeon in Yeonggwang, Geumjeong-myeon in Yeongam, Noam-myeon and Bogil-myeon in Wando, Samseo-myeon in Jangseong, Gwansan-eup and Hoejin-myeon in Jangheung, Gogun-myeon and Gunnae-myeon in Jindo, Nasan-myeon in Hampyeong, Gyegok-myeon and Munnae-myeon in Haenam, and Dong-myeon and Dongbok-myeon in Hwasun.
Table 1
Number and percent of the respondents by province and age.
| Region | Number of respondents by age (%) | Total (%) | |||
|---|---|---|---|---|---|
|
|
|||||
| Sixties | Seventies | Eighties | Nineties | ||
|
|
|||||
| Gangjin | 3(23.1)z | 2(15.4) | 5(38.5) | 3(23.1) | 13(100) |
| Goheung | 5(31.3) | 4(25.0) | 5(31.3) | 2(12.5) | 16(100) |
| Gokseong | 4(36.4) | 4(36.4) | 2(18.2) | 1(9.1) | 11(100) |
| Gwangyang | 3(20.0) | 4(26.7) | 5(33.3) | 3(20.0) | 15(100) |
| Gurye | 4(30.8) | 5(38.5) | 3(23.1) | 1(7.7) | 13(100) |
| Naju | 3(14.3) | 6(28.6) | 8(38.1) | 4(19.0) | 21(100) |
| Damyang | 3(21.4) | 7(50.0) | 4(28.6) | 0(0.0) | 14(100) |
| Muan | 4(33.3) | 3(25.0) | 3(25.0) | 2(16.7) | 12(100) |
| Boseong | 4(30.8) | 5(38.5) | 4(30.8) | 0(0.0) | 13(100) |
| Suncheon | 3(21.4) | 4(28.6) | 6(42.9) | 1(7.1) | 14(100) |
| Sinan | 3(27.3) | 3(27.3) | 4(36.4) | 1(9.1) | 11(100) |
| Yeosu | 4(28.6) | 5(35.7) | 3(21.4) | 2(14.3) | 14(100) |
| Yeonggwang | 4(20.0) | 9(45.0) | 7(35.0) | 0(0.0) | 20(100) |
| Yeongam | 3(25.0) | 4(33.3) | 3(25.0) | 2(16.7) | 12(100) |
| Wando | 4(33.3) | 3(25.0) | 4(33.3) | 1(8.3) | 12(100) |
| Jangseong | 3(30.0) | 2(20.0) | 3(30.0) | 2(20.0) | 10(100) |
| Jangheung | 3(25.0) | 1(8.3) | 3(25.0) | 5(41.7) | 12(100) |
| Jindo | 3(23.1) | 3(23.1) | 4(30.8) | 3(23.1) | 13(100) |
| Hampyeong | 2(22.2) | 3(33.3) | 2(22.2) | 2(22.2) | 9(100) |
| Haenam | 6(50.0) | 2(16.7) | 4(33.3) | 0(0.0) | 12(100) |
| Hwasun | 3(20.0) | 3(20.0) | 7(46.7) | 2(13.3) | 15(100) |
|
|
|||||
| Total | 74(26.2) | 82(29.1) | 89(31.6) | 37(13.1) | 282(100.0) |
Survey method
The preliminary survey showed that Echinops setifer was called in different names according to the region and thus communication would be impossible by Echinops setifer name only. Thus, as shown in Fig. 1, photos of Echinops setifer were printed in color and shown to the subjects while they were asked about each item of the questionnaire. The responses were directly marked on the questionnaire prepared by the researchers.
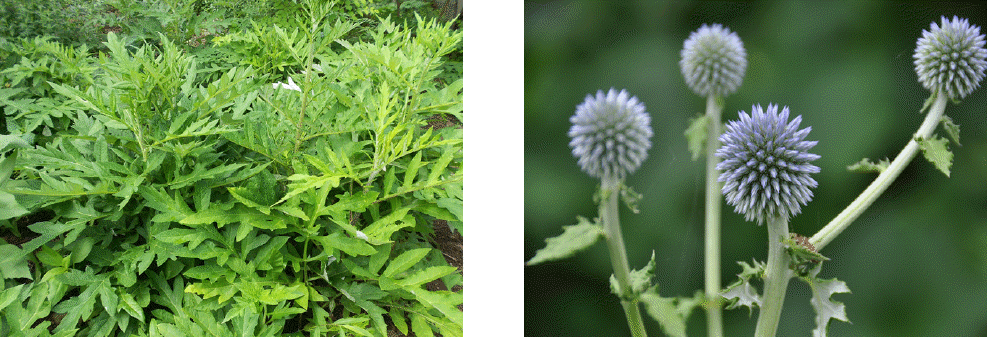
Survey items and content
Regional name and the number of name of Echinops setifer
Photos of Echinops setifer (Fig. 1) were presented to the respondents, and they were asked whether they know the plant’s existence and plant name, and the relevant names were recorded. In this process, two or less than two people of total respondents were classified as ‘others.’ The redundant responses were included 124 out of total 282 respondents, excluding 158 (56.0%) respondents who did not know the existence of Echinops setifer. The number of Echinops setifer name was first surveyed and the relevant number of respondents was calculated to convert it into a percentage.
Experience and the latest experience of eating rice cake of Echinops setifer
To determine the experience of eating rice cake of Echinops setifer, the age of respondents were classified into 60s, 70s, 80s and 90s, and the percentage of respondents regarding experience of eating (%) was calculated by ‘number of responses / number of respondents X 100.’ The most recent time they ate the rice cake was determined by asking the relevant question to 103 respondents of eating experience of Echinops setifer rice cake, and then classifying the responses into before 1960, 1960s, 1970s, 1980s, 1990s, 2000s, and after 2010 to calculate the percentage of each.
Experience and the latest experience of making rice cake of Echinops setifer
To determine the experience of making rice cake with Echinops setifer, the respondents were to freely talk about the types of rice cake they made with Echinops setifer and the percentage of respondents was calculated regarding experience of making (%) by ‘number of responses / number of respondents X 100.’ The most recent time they made the rice cake was determined by asking the relevant question to 58 respondents with eating experience of Echinops setifer rice cake, and then classifying the responses into before 1960, 1960s, 1970s, 1980s, 1990s, 2000s, and after 2010 to calculate the percentage of each.
Taste and stickiness of rice cake of Echinops setifer
Taste and stickiness of rice cake of Echinops setifer were rated on a 5-point scale by 103 respondents with eating experience of Echinops setifer rice cake. The researchers asked them about the taste and gave 5 points to very tasty, 4 points to tasty, 3 points to average, 2 points to not tasty, and 1 point to not tasty at all. For stickiness, 5 points were given to very sticky, 4 points to sticky, 3 points to average, 2 points to not sticky, and 1 point to not sticky at all. The results were added up to calculate the average.
Results and Discussions
Regional name and the number of name of Echinops setifer
As a result of surveying 282 women aged 60 or over living in 21 cities and counties of Jeonnam regarding the names of Echinops setifer, it was found that not a single one of them was aware of the standard name Jeolgutdae, but 124 (44.0%) respondents knew the regional name of Echinops setifer (Table 2). The ratio of bundae (25.2%)>bunchu (16.0%) was high including redundant responses, followed by those above 2.1% such as gasibundae (3.9%), buchu (2.8%), gasaebunchu (2.8%), beonchu (2.5%), and sseoraebunchu (2.1%), as well as other names such as kalbundae, topbundae, beonhochu, and sutbunchu.
Table 2
Regional name of Echinops setifer known to women aged 60 or over living in Jeonnam province.
| Region | Respondents in percent by regional name (n) | ||||||||
|---|---|---|---|---|---|---|---|---|---|
|
|
|||||||||
| Bundae | Bunchu | Beonchu | Buchu | Gasibundae | Gasaebunchu | Sseroraebunchu | Other | Unknown | |
|
|
|||||||||
| Gangjin | 0.0z(0)y | 19.2(5) | 26.9(7) | 0.0(0) | 0.0(0) | 11.5(3) | 19.2(5) | 11.5(3) | 11.5(3) |
| Goheung | 0.0(0) | 0.0(0) | 0.0(0) | 0.0(0) | 0.0(0) | 0.0(0) | 0.0(0) | 0.0(0) | 100.0(16) |
| Gokseong | 35.7(5) | 0.0(0) | 0.0(0) | 0.0(0) | 0.0(0) | 0.0(0) | 0.0(0) | 21.4(3) | 42.9(6) |
| Gwangyang | 0.0(0) | 0.0(0) | 0.0(0) | 0.0(0) | 0.0(0) | 0.0(0) | 0.0(0) | 0.0(0) | 100.0(15) |
| Gurye | 0.0(0) | 20.0(4) | 0.0(0) | 25.0(5) | 0.0(0) | 0.0(0) | 0.0(0) | 15.0(3) | 40.0(8) |
| Naju | 22.6(7) | 25.8(8) | 0.0(0) | 0.0(0) | 3.2(1) | 6.5(2) | 0.0(0) | 19.4(6) | 22.6(7) |
| Damyang | 58.8(10) | 0.0(0) | 0.0(0) | 0.0(0) | 0.0(0) | 0.0(0) | 0.0(0) | 17.6(3) | 23.5(4) |
| Muan | 0.0(0) | 41.7(5) | 0.0(0) | 0.0(0) | 0.0(0) | 0.0(0) | 0.0(0) | 0.0(0) | 58.3(7) |
| Boseong | 7.7(1) | 23.1(3) | 0.0(0) | 23.1(3) | 0.0(0) | 0.0(0) | 0.0(0) | 0.0(0) | 46.2(6) |
| Suncheon | 41.2(7) | 5.9(1) | 0.0(0) | 0.0(0) | 11.8(2) | 0.0(0) | 0.0(0) | 0.0(0) | 41.2(7) |
| Sinan | 0.0(0) | 0.0(0) | 0.0(0) | 0.0(0) | 0.0(0) | 0.0(0) | 0.0(0) | 0.0(0) | 100.0(11) |
| Yeosu | 0.0(0) | 0.0(0) | 0.0(0) | 0.0(0) | 0.0(0) | 0.0(0) | 0.0(0) | 0.0(0) | 100.0(14) |
| Yeonggwang | 75.0(15) | 0.0(0) | 0.0(0) | 0.0(0) | 0.0(0) | 0.0(0) | 0.0(0) | 0.0(0) | 25.0(5) |
| Yeongam | 41.2(7) | 41.2(7) | 0.0(0) | 0.0(0) | 0.0(0) | 0.0(0) | 0.0(0) | 0.0(0) | 17.6(3) |
| Wando | 0.0(0) | 0.0(0) | 0.0(0) | 0.0(0) | 0.0(0) | 0.0(0) | 0.0(0) | 0.0(0) | 100.0(12) |
| Jangseong | 33.3(5) | 13.3(2) | 0.0(0) | 0.0(0) | 26.7(4) | 0.0(0) | 0.0(0) | 6.7(1) | 20.0(3) |
| Jangheung | 0.0(0) | 31.3(5) | 0.0(0) | 0.0(0) | 0.0(0) | 12.5(2) | 0.0(0) | 25.0(4) | 31.3(5) |
| Jindo | 0.0(0) | 0.0(0) | 0.0(0) | 0.0(0) | 0.0(0) | 0.0(0) | 0.0(0) | 0.0(0) | 100.0(13) |
| Hampyeong | 8.3(1) | 41.7(5) | 0.0(0) | 0.0(0) | 0.0(0) | 0.0(0) | 0.0(0) | 25.0(3) | 25.0(3) |
| Haenam | 0.0(0) | 0.0(0) | 0.0(0) | 0.0(0) | 0.0(0) | 6.3(1) | 6.3(1) | 37.5(6) | 50.0(8) |
| Hwasun | 68.4(13) | 0.0(0) | 0.0(0) | 0.0(0) | 21.1(4) | 0.0(0) | 0.0(0) | 0.0(0) | 10.5(2) |
|
|
|||||||||
| Total | 25.2(71) | 16.0(45) | 2.5(7) | 2.8(8) | 3.9(11) | 2.8(8) | 2.1(6) | 8.9(25) | 56.0(158) |
By region, it was discovered that the names bundae and bunchu were used in 10 regions. Bundae was used only in Gokseong, Damyang, Yeonggwang, and Hwasun, while bunchu was used only in Gangjin, Gurye, Muan, and Jangheung. Both bundae and bunchu were used in Naju, Boseong, Suncheon, Yeongam, Jangseong, and Hampyeong. The most commonly used name by region was beonchu in Gangjin (26.9%), bundae in Gokseong (35.7%), buchu in Gurye (25.0%), beonhochu (50.0%), and gasaebunchu (6.5%) and sseoraebunchu (6.5%) in Haenam, showing regional differences. This result is similar to Gnaphalium affine that is called by different regional names by region instead of standard name while being used as an ingredient for rice cake in Jeonnam like Echinops setifer (Park et al., 2017). Furthermore, this was similar to the study by Cho et al. (2017b) surveying 119 women aged 60 or over in Jeongeup, Jeonbuk regarding the awareness of Echinops setifer names, that 95 (79.8%) respondents knew about Echinops setifer but none of them knew the standard name. Therefore, it seems necessary to know the standard name along with a general survey in terms of succession and development of traditional rice cake resource plant.
As a result of surveying 124 out of 282 women aged 60 or over living in 21 cities and counties of Jeonnam who also responded that they were aware of Echinops setifer, 26.3% respondents knew one name of Echinops setifer, 15.2% respondents knew 2 names of Echinops setifer, and 2.5% respondents knew 3 names of Echinops setifer (Table 3). This indicates that Echinops setifer name was called a few regional names in different regions. Compared to the study by Cho et al. (2017b), 79.8% of 95 respondents knew the plant name as gasaebundae, 12.6% as gasibundae and 0.8% as ssoegibundae, the regional names for Echinops setifer showed great regional gaps. Therefore, it is necessary to be well aware of the regional names to survey the usage culture of Echinops setifer among the elderly, and to provide a standard name in order to pass down and develop the traditional culture of using Echinops setifer.
Table 3
A number of names of E. Setifer known to women aged 60 or over living in Jeonnam province.
| Region | Respondents in percent by a number of names of E. Setifer (n) | ||||
|---|---|---|---|---|---|
|
|
|||||
| Zero | One | Two | Three | Total | |
|
|
|||||
| Gangjin | 23.1z(3)y | 23.1(3) | 38.5(5) | 15.3(2) | 100(13) |
| Goheung | 100.0(16) | 0.0(0) | 0.0(0) | 0.0(0) | 100(16) |
| Gokseong | 54.5(6) | 18.2(2) | 27.3(3) | 0.0(0) | 100(11) |
| Gwangyang | 100.0(15) | 0.0(0) | 0.0(0) | 0.0(0) | 100(15) |
| Gurye | 61.5(8) | 7.7(1) | 7.7(1) | 23.1(3) | 100(13) |
| Naju | 33.3(7) | 23.8(5) | 38.1(8) | 4.8(1) | 100(21) |
| Damyang | 28.6(4) | 50.0(7) | 21.4(3) | 0.0(0) | 100(14) |
| Muan | 58.3(7) | 41.7(5) | 0.0(0) | 0.0(0) | 100(12) |
| Boseong | 46.2(6) | 53.8(7) | 0.0(0) | 0.0(0) | 100(13) |
| Suncheon | 50.0(7) | 35.8(5) | 7.1(1) | 7.1(1) | 100(14) |
| Sinan | 100.0(11) | 0.0(0) | 0.0(0) | 0.0(0) | 100(11) |
| Yeosu | 100.0(14) | 0.0(0) | 0.0(0) | 0.0(0) | 100(14) |
| Yeonggwang | 25.0(5) | 75.0(15) | 0.0(0) | 0.0(0) | 100(20) |
| Yeongam | 25.0(3) | 33.3(4) | 41.7(5) | 0.0(0) | 100(12) |
| Wando | 100.0(12) | 0.0(0) | 0.0(0) | 0.0(0) | 100(12) |
| Jangseong | 30.0(3) | 30.0(3) | 40.0(4) | 0.0(0) | 100(10) |
| Jangheung | 41.7(5) | 33.3(4) | 25.0(3) | 0.0(0) | 100(12) |
| Jindo | 100.0(13) | 0.0(0) | 0.0(0) | 0.0(0) | 100(13) |
| Hampyeong | 33.3(3) | 33.3(3) | 33.3(3) | 0.0(0) | 100(9) |
| Haenam | 66.7(8) | 8.3(1) | 25.0(3) | 0.0(0) | 100(12) |
| Hwasun | 13.3(2) | 60.0(9) | 26.7(4) | 0.0(0) | 100(15) |
|
|
|||||
| Total | 56.0x(158) | 26.3(74) | 15.2(43) | 2.5(7) | 100(282) |
|
|
|||||
| Regional differencew | χ2 = 100.998 (**) | ||||
Experience and the latest experience of eating Echinops setifer rice cake
As a result of surveying 282 women aged 60 or over living in 21 cities and counties of Jeonnam to determine the experience of eating Echinops setifer by use, all of them with experience responded that they used it only in rice cake, and only 36.5% (103) of the respondents had eating experience of Echinops setifer rice cake (Table 4). There were regional differences in the ratio of responses that they ate rice cake. At least 58% respondents had eating experience of Echinops setifer rice cake such as Gangjin (76.9%), Naju (71.4%), Yeonggwang (65.0%), Jangseong (70.0%), Hampyeong (66.7%), Hwasun (60.0%), Yeongam (58.3%) and Jangheung (58.3%), but 0% in Goheung, Gwangyang, Sinan, Yeosu, Wando, and Jindo.
Table 4
Eating experience of Echinops setifer rice cake in women aged 60 or over living in Jeonnam province.
| Region | Respondents in percent by age (n) | ||||
|---|---|---|---|---|---|
|
|
|||||
| Sixties | Seventies | Eighties | Nineties | Total | |
|
|
|||||
| Gangjin | 0.0z(0)y | 100(2) | 100(5) | 100(3) | 76.9(10) |
| Goheung | 0.0(0) | 0.0(0) | 0.0(0) | 0.0(0) | 0.0(0) |
| Gokseong | 0.0(0) | 75.0(3) | 100.0(2) | 0.0(0) | 45.5(5) |
| Gwangyang | 0.0(0) | 0.0(0) | 0.0(0) | 0.0(0) | 0.0(0) |
| Gurye | 0.0(0) | 20.0(1) | 66.7(2) | 100.0(1) | 30.8(4) |
| Naju | 33.3(1) | 83.3(5) | 75.0(6) | 75.0(3) | 71.4(15) |
| Damyang | 0.0(0) | 42.9(3) | 50.0(2) | - | 35.7(5) |
| Muan | 0.0(0) | 0.0(0) | 100.0(3) | 100.0 | 41.7(5) |
| Boseong | 0.0(0) | 20.0(1) | 0.0(0) | - | 7.7(1) |
| Suncheon | 0.0(0) | 25.0(1) | 50.0(3) | 100.0(1) | 35.7(5) |
| Sinan | 0.0(0) | 0.0(0) | 0.0(0) | 0.0(0) | 0.0(0) |
| Yeosu | 0.0(0) | 0.0(0) | 0.0(0) | 0.0(0) | 0.0(0) |
| Yeonggwang | 0.0(0) | 66.7(6) | 100.0(7) | - | 65.0(13) |
| Yeongam | 0.0(0) | 50.0(2) | 100.0(3) | 100.0(2) | 58.3(7) |
| Wando | 0.0(0) | 0.0(0) | 0.0(0) | 0.0(0) | 0.0(0) |
| Jangseong | 0.0(0) | 100.0(2) | 100.0(3) | 100.0(2) | 70.0(7) |
| Jangheung | 0.0(0) | 0.0(0) | 66.7(2) | 100.0(5) | 58.3(7) |
| Jindo | 0.0(0) | 0.0(0) | 0.0(0) | 0.0(0) | 0.0(0) |
| Hampyeong | 0.0(0) | 66.7(2) | 100.0(2) | 100.0(2) | 66.7(6) |
| Haenam | 0.0(0) | 50.0(1) | 75.0(3) | - | 33.3(4) |
| Hwasun | 0.0(0) | 66.7(2) | 71.4(5) | 100.0(2) | 60.0(9) |
| Total | 1.4x(1) | 37.8(31) | 53.9(48) | 62.1(23) | 36.5(103) |
|
|
|||||
| Regional differncew | χ2 = 61.854 (**) | ||||
|
|
|||||
| Age differencew | χ2 = 94.199 (**) | ||||
Plant ingredients that have been used in traditional Korean rice cake are well introduced in Gyuhapchongseo and Chosunmusangsinsikyorijebub, both of which also do not mention Echinops setifer (Kim et al., 2012; Kim et al., 2014). Unlike the absence of the plant in a study on ingredients used in traditional rice cake (Won et al., 2008), this study revealed from a survey on the elderly that Echinops setifer is used as an ingredient of rice cake. Therefore, it is necessary to conduct an extensive research about the culture of using native plants among the elderly, implying that there is a possibility where other various native plants aside from Echinops setifer might not have been recorded and passed down even though they are used as rice cake resource plants.
As for experience of eating Echinops setifer rice cake by age, 1.4% in their 60s, 37.8%, in their 70s, 53.9% in their 80s and 62.1% in their 90s responded that they have experience, showing that the ratio was high among older age groups. By region, Naju was the only place where respondents in their 60s as well as 83.3% in their 70s said they have experience eating Echinops setifer rice cake, indicating that the culture remains relatively more than other regions. On the other hand, respondents with eating experience of Echinops setifer rice cake in Jangheung were all in their 80s or older.
Latest experience of eating Echinops setifer was shown in Table 5. The result was shown that the ratio was highest in the order of 1960s (45.6%) > before 1960 (21.4%) > 1970s (17.5%) > 1980s (6.8%) > 1990s (3.9%) > 2000s (1.9%) > 2010s (2.9%) (Table 5). 2.9% responded that they ate Echinops setifer rice cake in the 2010s, also since the 1980s the ratio was lower than 6.8%, showing a remarkably low ratio of experience. By region, only Naju and Yeonggwang showed responses after the 2010s. Cho et al. (2017a) surveyed the last time Echinops setifer rice cake was eaten among 119 women aged 60 or over in Jeongup, Jeonbuk and discovered that 2.2% ate it last after 1991 and 0% after 2011, showing a similar result with this study. Therefore, it turned out that while there is somewhat a regional difference in the culture of eating Echinops setifer rice cake, most of the culture is declining, which raises the need to study a systematic development and use of Echinops setifer rice cake in terms of use of resource plants and diversification of eating culture.
Table 5
Latest experience of eating rice cake among 107 women aged 60 or over living in Jeonnam province.
| Region | Respondents in percent by year (n) | |||||||
|---|---|---|---|---|---|---|---|---|
|
|
||||||||
| Before 1960 | 1960s | 1970s | 1980s | 1990s | 2000s | After 2010 | Total | |
|
|
||||||||
| Gangjin | 10.0z(1)y | 90.0(9) | 0.0(0) | 0.0(0) | 0.0(0) | 0.0(0) | 0.0(0) | 100.0(10) |
| Goheung | 0.0(0) | 0.0(0) | 0.0(0) | 0.0(0) | 0.0(0) | 0.0(0) | 0.0(0) | 0.0(0) |
| Gokseong | 0.0(0) | 60.0(3) | 40.0(2) | 0.0(0) | 0.0(0) | 0.0(0) | 0.0(0) | 100.0(5) |
| Gwangyang | 0.0(0) | 0.0(0) | 0.0(0) | 0.0(0) | 0.0(0) | 0.0(0) | 0.0(0) | 0.0(0) |
| Gurye | 100.0(4) | 0.0(0) | 0.0(0) | 0.0(0) | 0.0(0) | 0.0(0) | 0.0(0) | 100.0(4) |
| Naju | 13.3(2) | 20.0(3) | 20.0(3) | 20.0(3) | 6.7(1) | 6.7(1) | 13.3(2) | 100.0(15) |
| Damyang | 60.0(3) | 20.0(1) | 0.0(0) | 0.0(0) | 0.0(0) | 20.0(1) | 0.0(0) | 100.0(5) |
| Muan | 60.0(3) | 40.0(2) | 0.0(0) | 0.0(0) | 0.0(0) | 0.0(0) | 0.0(0) | 100.0(5) |
| Boseong | 100.0(1) | 0.0(0) | 0.0(0) | 0.0(0) | 0.0(0) | 0.0(0) | 0.0(0) | 100.0(1) |
| Suncheon | 60.0(3) | 40.0(2) | 0.0(0) | 0.0(0) | 0.0(0) | 0.0(0) | 0.0(0) | 100.0(5) |
| Sinan | 0.0(0) | 0.0(0) | 0.0(0) | 0.0(0) | 0.0(0) | 0.0(0) | 0.0(0) | 0.0(0) |
| Yeosu | 0.0(0) | 0.0(0) | 0.0(0) | 0.0(0) | 0.0(0) | 0.0(0) | 0.0(0) | 0.0(0) |
| Yeonggwang | 7.7(1) | 53.8(7) | 15.4(2) | 7.7(1) | 7.7(1) | 0.0(0) | 7.7(1) | 100.0(13) |
| Yeongam | 14.3(1) | 42.8(3) | 28.6(2) | 14.3(1) | 0.0(0) | 0.0(0) | 0.0(0) | 100.0(7) |
| Wando | 0.0(0) | 0.0(0) | 0.0(0) | 0.0(0) | 0.0(0) | 0.0(0) | 0.0(0) | 0.0(0) |
| Jangseong | 14.3(1) | 57.1(4) | 28.6(2) | 0.0(0) | 0.0(0) | 0.0(0) | 0.0(0) | 100.0(7) |
| Jangheung | 14.3(1) | 85.7(6) | 0.0(0) | 0.0(0) | 0.0(0) | 0.0(0) | 0.0(0) | 100.0(7) |
| Jindo | 0.0(0) | 0.0(0) | 0.0(0) | 0.0(0) | 0.0(0) | 0.0(0) | 0.0(0) | 0.0(0) |
| Hampyeong | 0.0(0) | 50.0(3) | 16.7(1) | 0.0(0) | 13.3(2) | 0.0(0) | 0.0(0) | 100.0(6) |
| Haenam | 0.0(0) | 0.0(0) | 75.0(3) | 25.0(1) | 0.0(0) | 0.0(0) | 0.0(0) | 100.0(4) |
| Hwasun | 11.1(1) | 44.5(4) | 33.3(3) | 11.1(1) | 0.0(0) | 0.0(0) | 0.0(0) | 100.0(9) |
|
|
||||||||
| Total | 21.4x(22) | 45.6(47) | 17.5(18) | 6.8(7) | 3.9(4) | 1.9(2) | 2.9(3) | 100.0(103) |
|
|
||||||||
| Regional differencey | χ2 = 15.335 (*) | |||||||
Experience and the latest experience of making Echinops setifer rice cake
As a result of surveying 282 women aged 60 or over living in 21 cities and counties of Jeonnam regarding the experience of making Echinops setifer rice cake, it was found that only 58 (20.6%) respondents had experience making Echinops setifer rice cake (Table 6). By region, only respondents living in 12 regions (57.1%) including Jangheung, Gokseong, and Naju responded that they have experience, and only Hampyeong (55.6%), Hwasun (53.3%), Naju (52.4%), Yeongam (50.0%), and Jangseong (50.0%) among them showed at least 50%, while other regions showed 46.2%. In particular, the ratio of respondents with making experience of the rice cake was 0% in Goheung, Gwangyang, Gurye, Boseong, Sinan, Yeosu, Wando, and Jindo. By age, 0% of respondents in their 60s had experience making Echinops setifer rice cake, followed by 18.3% in their 70s, 27.0% in their 80s and 51.4% in their 90s, indicating that the ratio was lower among younger age groups. This low ratio of people was shown 0% of respondents in their 60s that the skills and culture of making Echinops setifer rice cake would be lost without measures like supplying the rice cake making skills, thereby raising the need to come up with relevant measures.
Table 6
Latest making experience of Echinops setifer rice cake in women aged 60 or over living in Jeonnam province.
| Region | Respondents in percent by age (n) | ||||
|---|---|---|---|---|---|
|
|
|||||
| Sixties | Seventies | Eighties | Nineties | Percent of manufacturing experience (person) | |
|
|
|||||
| Gangjin | 0.0z(0)y | 0.0(0) | 60.0(3) | 100.0(3) | 46.2(6) |
| Goheung | 0.0(0) | 0.0(0) | 0.0(0) | 0.0(0) | 0.0(0) |
| Gokseong | 0.0(0) | 50.0(2) | 0.0(0) | 0.0(0) | 18.2(2) |
| Gwangyang | 0.0(0) | 0.0(0) | 0.0(0) | 0.0(0) | 0.0(0) |
| Gurye | 0.0(0) | 0.0(0) | 0.0(0) | 0.0(0) | 0.0(0) |
| Naju | 0.0(0) | 50.0(3) | 75.0(6) | 50.0(2) | 52.4(11) |
| Damyang | 0.0(0) | 14.3(1) | 0.0(0) | - | 7.1(1) |
| Muan | 0.0(0) | 0.0(0) | 0.0(0) | 100.0(2) | 16.7(2) |
| Boseong | 0.0(0) | 0.0(0) | 0.0(0) | - | 0.0(0) |
| Suncheon | 0.0(0) | 0.0(0) | 0.0(0) | 100.0(1) | 7.1(1) |
| Sinan | 0.0(0) | 0.0(0) | 0.0(0) | 0.0(0) | 0.0(0) |
| Yeosu | 0.0(0) | 0.0(0) | 0.0(0) | 0.0(0) | 0.0(0) |
| Yeonggwang | 0.0(0) | 22.2(2) | 28.6(2) | - | 20.0(4) |
| Yeongam | 0.0(0) | 25.0(1) | 100.0(3) | 100.0(2) | 50.0(6) |
| Wando | 0.0(0) | 0.0(0) | 0.0(0) | 0.0(0) | 0.0(0) |
| Jangseong | 0.0(0) | 100.0(2) | 33.3(1) | 100.0(2) | 50.0(5) |
| Jangheung | 0.0(0) | 0.0(0) | 0.0(0) | 60.0(3) | 25.0(3) |
| Jindo | 0.0(0) | 0.0(0) | 0.0(0) | 0.0(0) | 0.0(0) |
| Hampyeong | 0.0(0) | 33.3(1) | 100.0(2) | 100.0(2) | 55.6(5) |
| Haenam | 0.0(0) | 50.0(1) | 75.0(3) | - | 33.3(4) |
| Hwasun | 0.0(0) | 66.7(2) | 57.1(4) | 100.0(2) | 53.3(8) |
|
|
|||||
| Total | 0.0x(0) | 18.3(15) | 27.0(24) | 51.4(19) | 20.6(58) |
|
|
|||||
| Regional differencezw | χ2 = 75.893 (**) | ||||
|
|
|||||
| Age differencew | χ2 = 45.047 (**) | ||||
Latest experience of making Echinops setifer rice cake was shown that the percentage was highest in the order of 1960s (37.9%) > 1970s (22.5%) > 1980s (15.5%) > before 1960 (8.6%) > 1990s (6.9%) > after 2000 (5.2%) > 2000s (3.4%) (Table 7). Among 58 respondents of making experience of Echinops setifer rice cake, but only 4 of them (6.9%) made it after the 1990s. There were responses that they ate Echinops setifer rice cake in the 2010s as well, but the percentage was lower than 6.8% since the 1980s. By region, only 3 or less regions had respondents with experience in making rice cake. This result is similar to the study by Cho et al. (2017a), which discovered that among respondents with experience eating Echinops setifer rice cake among women in their 60s or over in Jeongup, Jeonbuk, 3.1% responded that they made the rice cake in 1991-2010 and 0% since 2011. Therefore, it is necessary to specifically study the culture of using Echinops setifer and to pass it down in terms of use of Echinops setifer and diversification of eating culture.
Table 7
Latest experience of making E. setifer rice cakes in 58 women aged 60 or over living in Jeonnam province.
| Region | Respondents in percent by year (n) | |||||||
|---|---|---|---|---|---|---|---|---|
|
|
||||||||
| Before 1960 | 1960s | 1970s | 1980s | 1990s | 2000s | After 2010 | Total | |
|
|
||||||||
| Gangjin | 0.0z(0)y | 100.0(6) | 0.0(0) | 0.0(0) | 0.0(0) | 0.0(0) | 0.0(0) | 100.0(6) |
| Goheung | 0.0(0) | 0.0(0) | 0.0(0) | 0.0(0) | 0.0(0) | 0.0(0) | 0.0(0) | 0.0(0) |
| Gokseong | 0.0(0) | 50.0(1) | 50.0(1) | 0.0(0) | 0.0(0) | 0.0(0) | 0.0(0) | 100.0(2) |
| Gwangyang | 0.0(0) | 0.0(0) | 0.0(0) | 0.0(0) | 0.0(0) | 0.0(0) | 0.0(0) | 0.0(0) |
| Gurye | 0.0(0) | 0.0(0) | 0.0(0) | 0.0(0) | 0.0(0) | 0.0(0) | 0.0(0) | 0.0(0) |
| Naju | 0.0(0) | 9.1(1) | 27.3(3) | 27.3(3) | 9.1(1) | 9.1(1) | 18.1(2) | 100.0(11) |
| Damyang | 0.0(0) | 0.0(0) | 0.0(0) | 0.0(0) | 0.0(0) | 100.0(1) | 0.0(0) | 100.0(1) |
| Muan | 50.0(1) | 50.0(1) | 0.0(0) | 0.0(0) | 0.0(0) | 0.0(0) | 0.0(0) | 100.0(2) |
| Boseong | 0.0(0) | 0.0(0) | 0.0(0) | 0.0(0) | 0.0(0) | 0.0(0) | 0.0(0) | 0.0(0) |
| Suncheon | 100.0(1) | 0.0(0) | 0.0(0) | 0.0(0) | 0.0(0) | 0.0(0) | 0.0(0) | 100.0(1) |
| Sinan | 0.0(0) | 0.0(0) | 0.0(0) | 0.0(0) | 0.0(0) | 0.0(0) | 0.0(0) | 0.0(0) |
| Yeosu | 0.0(0) | 0.0(0) | 0.0(0) | 0.0(0) | 0.0(0) | 0.0(0) | 0.0(0) | 0.0(0) |
| Yeonggwang | 0.0(0) | 25.0(1) | 0.0(0) | 25.0(1) | 25.0(1) | 0.0(0) | 25.0(1) | 100.0(4) |
| Yeongam | 16.7(1) | 33.3(2) | 33.3(2) | 16.7(1) | 0.0(0) | 0.0(0) | 0.0(0) | 100(6) |
| Wando | 0.0(0) | 0.0(0) | 0.0(0) | 0.0(0) | 0.0(0) | 0.0(0) | 0.0(0) | 0.0(0) |
| Jangseong | 0.0(0) | 40.0(2) | 20.0(1) | 40.0(2) | 0.0(0) | 0.0(0) | 0.0(0) | 100.0(5) |
| Jangheung | 1(33.3) | 66.7(2) | 0.0(0) | 0.0(0) | 0.0(0) | 0.0(0) | 0.0(0) | 100.0(3) |
| Jindo | 0.0(0) | 0.0(0) | 0.0(0) | 0.0(0) | 0.0(0) | 0.0(0) | 0.0(0) | 0.0(0) |
| Hampyeong | 0.0(0) | 40.0(2) | 20.0(1) | 0.0(0) | 40.0(2) | 0.0(0) | 0.0(0) | 100.0(5) |
| Haenam | 0.0(0) | 0.0(0) | 75.0(3) | 25.0(1) | 0.0(0) | 0.0(0) | 0.0(0) | 100.0(4) |
| Hwasun | 12.5(1) | 50.0(4) | 25.0(2) | 12.5(1) | 0.0(0) | 0.0(0) | 0.0(0) | 100.0(8) |
|
|
||||||||
| Total | 8.6x(5) | 37.9(22) | 22.5(13) | 15.5(9) | 6.9(4) | 3.4(2) | 5.2(3) | 100.0(58) |
|
|
||||||||
| Regional dfferencew | χ2 = 95.643 (*) | |||||||
Evaluation of the taste and stickiness of Echinops setifer rice cake
Table 7 shows the result of rating the taste and stickiness of Echinops setifer rice cake on a 5-point scale among 103 respondents with experience eating Echinops setifer rice cake out of 282 women aged 60 or over living in 21 cities and counties of Jeonnam. The region was shown the lowest rating for the taste of Echinops setifer rice cake (Gangjin) presented the score of 4.56, which is at least the level of tasty (4.0). In particular, respondents in 10 regions including Gurye and Damyang responded that it is very tasty (5.0), generally reviewing Echinops setifer rice cake as a tasty rice cake. As for stickiness of Echinops setifer rice cake, respondents gave the rating of 4.63 that is at least the level of tasty, and the respondents in 10 regions reviewed it as very tasty (5.0).8
Table 8
Evaluation of the taste and stickiness of Echinops setifer rice cake.
| Region | Evaluation value of taste and stickiness | |
|---|---|---|
|
|
||
| Tastez | Stickinessy | |
|
|
||
| Gangjin | 4.56 | 4.63 |
| Gokseong | 4.80 | 4.80 |
| Gurye | 5.00 | 5.00 |
| Naju | 4.80 | 4.80 |
| Damyang | 5.00 | 5.00 |
| Muan | 5.00 | 5.00 |
| Boseong | 5.00 | 5.00 |
| Suncheon | 5.00 | 5.00 |
| Yeonggwang | 4.77 | 4.69 |
| Yeongam | 5.00 | 5.00 |
| Jangseong | 5.00 | 5.00 |
| Jangheung | 5.00 | 5.00 |
| Hampyeong | 5.00 | 5.00 |
| Haenam | 5.00 | 5.00 |
| Hwasun | 4.89 | 4.89 |
|
|
||
| Regional differencex | χ2 = 9.868 (NS) | χ2 = 15.335 (NS) |
As such, considering the study by Cho et al. (2017a) where the taste and stickiness were rated highly regardless of region and the taste and stickiness of Echinops setifer rice cake were rated relatively more highly than rice cake made with other plant ingredients, it can be found that the decline of the culture of making and eating Echinops setifer rice cake was not due to the taste and stickiness of the rice cake. Heo (2015) also stated that the decline of culture of making Echinops setifer rice cake is mainly caused by the fact that it has become difficult to collect Echinops setifer in wild state. Therefore, there must be follow-up research on the propagation, cultivation and ingredient analysis of Echinops setifer in terms of succession of traditional culture and diversity of eating culture.
Conclusion
To obtain basic data for the succession and development of the culture of using the native plant Echinops setifer, this study conducted a survey on the regional name and eating culture of 282 women aged 60 and above living in 21 cities and counties of Jeonnam. There was no respondent aware of the standard name of Echinops setifer, and 54.0% (124) knew regional names. The highest ratio of response for regional names was in the following order, including redundant responses: bundae (25.2%) > bunchu (16.0%) > buchu (2.8%) and gasaebunchu (2.8%). 36.5% (103) of respondents have experienced eating rice cake of Echinops setifer, and less than 6.8% respondents were eaten Echinops setifer rice cake after 1980s. 20.6% (58) have experienced making Echinops setifer rice cake, and less than 6.9% respondents were made Echinops setifer rice cake after 1990s. The respondents with eating experience of Echinops setifer rice cake determined the taste and stickiness of the rice cake on a 5-point scale, and they rated it as the level of tasty at the least (4.56) and sticky at the least (4.63). Considering these results, it seems highly necessary to spread the standard name of Echinops setifer and promote the culture of use.


 PDF Links
 PubReader
 Full text via DOI
 Download Citation