


Introduction
Urbanization, which is rapidly spreading worldwide, is accompanied by population growth and concentration, industrialization, and construction, causing serious environmental problems (Uttara et al., 2012; Rai, 2017; World Health Organization, 2017; Russo and Cirella, 2018; Solomou et al., 2019). The high-rise and densification of urban areas, as well as the expansion to the outskirts of forests and rural areas, causes a reduction in green space, loss of biodiversity, air pollution, river eutrophication, smog, noise, and vibration, which hinders the coexistence of humans and other living things in the environment (Buchavyi et al., 2023; Zhang et al., 2021; Acharya and Acharya, 2023). Even in South Korea, the population began to flow into the Seoul metropolitan region following its period of rapid economic growth in the 1970s (Choi, 1984). When the first new cities in the Seoul metropolitan region, including Bundang and Ilsan, were developed to disperse this population, it appears that the damage to farmland and forests began in earnest (Vongpraseuth and Choi, 2014). While development-oriented urban plans to accommodate and disperse the growing population resulted in the early establishment of urban infrastructure, the living environment in cities deteriorated, causing damage to nature, destruction of ecological balance, and a lack of leisure space (Yeom and Park, 2011). This caused microclimate phenomena such as urban heat islands, leading to quantitative and qualitative declines in the environment, including the proliferation of invasive species due to abnormal climate, simplification of vegetation structure, and reduction of species diversity, as well as forest fragmentation and loss of ecological buffer zones attributable to the indiscriminate development (Oh et al., 2005; Oke, 1997; Cho, 1997). Since restricting urbanization is not a realistic means of preventing this environmental degradation, there is a need to minimize the impact on the environment (Uttara et al., 2012). In addition, securing sufficient parks and green spaces appears to be essential to maintain and provide sustainability and ecosystem services.
As people’s education, living standards and their awareness of the importance of parks and green spaces improved, the demand for urban green space began to increase (Kong et al., 2014). This has also been reflected in people’s residential choices, and the terms “soopsekwon” and “ghongsekwon” which mean spheres of influence of forests and parks, respectively, were coined and used as a marketing strategy (Myoung et al., 2020). When the prolonged COVID-19 pandemic, which began in 2019, led to the closure of public facilities including libraries and indoor playgrounds, the number of visitors to green spaces such as forests and parks increased, and these were used as places for relaxation and recreational activities (Kim et al., 2022; Chang et al., 2021). Urban green spaces are known to have environmental and ecological functions that include maintaining biodiversity, reducing noise and air pollution, and mitigating extreme climate events, as well as other effects such as providing opportunities for exposure to nature, and improving quality of life and health (World Health Organization, 2017). In addition, it was reported that there is a need to create green spaces in downtown areas because it is important for residents’ physical activities and mental health (Buchavyi et al., 2023). According to Russo and Cirella (2018), and the World Health Organization (2012), humans need daily contact with nature; furthermore, they concluded that urban green space (UGS) is very important for them even at a societal level as urban residents are happier and healthier when the minimum UGS value required per capita is exceeded.
Meanwhile, urban forests are not only important ecological resources that perform functions that include promoting people’s leisure activities and improving urban landscapes, but are also improving environmental soundness by controlling the environment through impacts such as preservation of the natural ecosystem, carbon absorption, and cooling effects (Jang et al., 2002; Kwon et al., 2004; Lee et al., 2018). In the Creation and Management of Urban Forest Act enacted in 2020, urban forests are defined as forests and trees created and managed in cities to promote public health and recreation, emotional development, and experiential activities. Despite this definition, researchers differ somewhat on the concept of an urban forest (Grey, 1996; Miller, 1997; Strom, 2000; Kwon et al., 2004). Even in the law, issues have been raised that the definition is only regulated comprehensively, making the spatial scope unclear (Kwak and Park, 2022; Kwak et al., 2021). Vegetation contained in urban forests not only has the function of preserving the ecosystem and urban environment from an ecological perspective, but is also a key element in maintaining the well-being of residents and the sustainability of cities (Chiesura, 2004). In particular, it plays a major role in alleviating urban heat islands and microclimates and improving the environment (Yang et al., 2022; Buchavyi et al., 2023; Russo and Cirella, 2018), while also being closely related to quality of life through promoting leisure activities and forming aesthetic landscapes (Kim et al., 2022; Chang et al., 2021; World Health Organization, 2012). However, it was reported that as such vegetation has a different structure from that in natural forests (No, 2015; Dwyer et al., 1992), accurate surveys and management are necessary to strengthen the overall ecosystem services, including improving the environment and quality of life.
In a study on the vegetation structure of urban forests, it was reported that forests near the Seoul metropolitan region were supposed to be dominated by native tree species including Carpinus laxiflora, Quercus acutissima, and Quercus serrata, but severe urbanization and use by residents have resulted in such vegetation being rare (Park et al., 2009; Lee et al., 1997). Although mountains located in downtown Seoul, including Namsan, Gwanaksan, Daemosan, and Suraksan, have natural vegetation such as Quercus mongolica, Pinus densiflora and Quercus acutissima, they appear to have been damaged by the colonization of invasive species including Robinia pseudoacacia and Pinus rigida (Lee et al., 2006a; Jang et al., 2013; Kong et al., 2014). In addition, even in the mountains Cheongnyangsan, Bulgoksan, and Bulamsan, as planted tree species including Pinus rigida, Robinia pseudoacacia, and Larix kaempferi are more dominant than natural vegetation, it was suggested that vegetation management is required (Oh et al., 1988; Lee et al., 2021; Lee and Shim, 2017). As a result, since tree species introduced for the purpose of mountain restoration and fuel forests dominate rather than native species in urban forests close to urban areas (Kim et al., 2012; Lim, 1994; Kim, 1993) the opinion has been expressed that vegetation management by minimal intervention is required for ecological succession.
Mt. Chilbosan, our study site with many wetlands in the past, is of high ecological value, as protected species including Metanarthecium luteo-viride, Habenaria radiata, and Drosera rotundifolia are distributed mainly in abandoned rice fields and mountain wetlands in the valley (Suwon Environmental Movement Center, 1998). It was reported that flora on the mountain, located in the southwestern part of Gyeonggi-do, close to Seoul, has been seriously damaged by continuous interference including new town development, overpopulation, artificial afforestation after forest fires, and visits by hikers (Ko and Shin, 2009; Lee, 2019; Suwon Environmental Movement Center, 1998). However, natural vegetation in some areas of the mountain had been damaged by the planting of Pinus rigida and Robinia pseudoacacia and the invasion of Magnolia obovata, a naturalized species.
Currently, there seem to be no protected species left due to a decline in groundwater levels that resulted from surrounding developments, illegal harvesting, and use in areas other than wildlife protection areas in Suwon and Ansan, and various ecological surveys of the study site, Mt. Chilbosan, have been conducted (Suwon Environmental Movement Center, 1998; Korea National Housing Corporation (KNHC), 2006; Lee et al., 2015; National Institute of Ecology, 2018; Lee, 2019; Lee et al., 2022). Notably, KNHC (2006) prepared an actual vegetation map and conducted a plant community survey of the site. Based on this, it was found that Pinus rigida plantations occupy most of the site, many of which were undergoing ecological succession to Quercus spp.. This study, conducted more than 15 years after such surveys, aimed to determine whether changes in the surrounding environment affected vegetation succession in order to provide basic data for the sound use and management of Mt. Chilbosan, a key green space for the establishment of green networks.
Research Methods
Overview of the study site
Mt. Chilbosan is a low hill with an altitude of 238.5 m above sea level which is located on the border of three cities including Suwon, Hwaseong, and Ansan in Gyeonggi-do. The average temperatures in January, the coldest month, are −2.1°C, −3.2°C, and −2.1°C for Suwon, Ansan, and Hwaseong, respectively, putting them in the temperate climate based on Köppen climate classification. There are 761 species under 413 genera and 127 families, and 65 naturalized species scattered throughout the Chilbosan area (Lee et al., 2022). In addition, it has been identified that about 40 species of wetland plants, including four species of rare plants such as Drosera rotundifolia, Utricularia japonica, Utricularia racemosa, and Utricularia bifida, are growing naturally in abandoned rice paddies and small wetlands in the valley.
There are 13 major hiking trails managed inside Mt. Chilbosan, and the main ridge, which starts from Chilbo Yaksuteo, a mineral spring, and connects to Cheoncheon Interchange, is 6,558.7 m long. Topographically, the south is high, with steep slopes and rocky areas centered on the summit, and the east, west, and north have low ASL; the overall slope is relatively gentle with a slope of less than 30 to 40° (KNHC, 2006). Looking at the land use status of the surrounding area, in some parts of the west slope, the Korea Forest Service’s experimental plantations are located in the center and north, and military facilities in the south. On the eastern slope, there are Seoul National University Forests, and large-scale buildings including public institutions such as Gyeonggi-do Institute of Health and Environment, Gyeonggi-do Animal Hygiene Testing Laboratory, and Gyeonggi-do Construction Headquarters. In addition, as large-scale residential complexes are being built around forest edges and farmland, the risk of lower groundwater levels and forest damage seems to increase. Notably, the Seoul National University Forests cover an area of 104 ha, which is a large area that includes most of the eastern slope and summit, as well as the longest main ridge (Lee, 2007).
Mt. Chilbosan, which was desolate land in the 1930s, has achieved a restored forest physiognomy through afforestation for erosion control; the main tree species in the forest, including the experimental forest, is Pinus rigida, the first species introduced to Korea (KNHC, 2006). Looking at the area ratio of tree species by tree type based on the forest type map at 1:5,000 scale in 2022 provided by the Korea Forest Service, conifers occupy the largest area at 63.4%, followed by broadleaf trees (16.2%), mixed forests (13.8%), the remaining arable land, nonstocked forest land, and water resource (6.5%). While among the conifers, Pinus densiflora and Pinus rigida occupy a relatively larger area at 31.5% and 29.2%, respectively, among broad-leaved trees, other broad-leaved trees and other Quercus spp. species account for a larger proportion of 9.4% and 4.3%, respectively (Lee et al., 2022).
Methods
As it is not practical to survey the entire forest to determine its vegetation status, it is common practice to determine the overall characteristics using representative communities identified by conducting a sample survey (Park et al., 1993). By using representative vegetation, whether vegetation stratification was formed, inclinometer and GPS recording device (GPSMAP 64s, Garmin) based on the forest type map, we sought to determine the characteristics of plant community structure by randomly setting 80 quadrats in areas with topographical changes (Fig. 1). Each survey plot was based on a square of 10m × 10m (100 m2). Considering the tree species and height, and topographical structure, one to four survey plots were set together, and then species name for each topographical structure and stratum, diameter at breast height (DBH), and crown diameter (CD) were surveyed. Each stratification was classified into three strata: canopy with a DBH of 2 m or more or a tree height of 2 m or more and receiving direct sunlight; understory, which is the middle stratum; and shrub layer with a height of less than 2 m. The DBH was measured for the canopy and understory, and the CD was measured for the shrub layer. For the shrub layer, one overlapped quadrat with an area of 5 m × 5 m was installed on the left and right sides of the edge of the survey plot; the species that appeared and the CD were recorded, and the number of individuals that appeared was quadrupled and used for analysis.
To compare the relative dominance of tree species by stratum that appeared in quadrats, the relative dominance was analyzed by crown stratum, which was expressed as an importance percentage (IP; Curtis and McIntosh (1951); Brower and Zar, 1977). The IP was estimated as (relative density + relative coverage)/2 for each species. In addition, considering the relative size of each individual, the mean IP (MIP) was calculated by assigning weights to each crown stratum: {(canopy IP × 3) + (understory IP × 2) + (shrub layer IP × 1)}/6 (Yim et al., 1980; Park, 1985; Oh and Choi, 1993). To classify plant communities, a two-way indicator species analysis (TWINSPAN) and a detrended correspondence analysis (DCA) for classification and ordination were performed, respectively, based on the vegetation survey results (Hill 1979a; 1979b). Based on the results of community classification, Shannon’s formula was applied to estimate and comprehensively examine the measures of diversity in species composition in each community: species diversity (H’), maximum diversity (H’ max), evenness (J’) and dominance (D’) (Pielou, 1975). In addition, to identify the similarity between communities, the similarity index was calculated using Whittaker’s formula (1956), and the distribution by DBH class was analyzed to compare changes in dominance for each tree species. The number of species and populations for each community was calculated based on a unit area of 100 m2, and when two or more survey plots were set together, the average values for each survey plot were derived and compared with other communities.
To determine the physicochemical properties of the soil, a total of 35 samples were collected, one sample for each quadrat; a quadrat had been established in one survey plot or groups of 2 to 4 survey plots. After removing the organic surface layer with accumulated fallen leaves, samples were collected from the topsoil layer (layer A), air-dried, and filtered using a 2 mm sieve. Then, the samples were analyzed for soil pH, organic matter content, cation exchange capacity, available phosphate, and electrical conductivity (National Academy of Agricultural Science, 2000). At 54 survey plots, available phosphate was found to be below 0.5ppm, the minimum value for instrumental analysis, and thus the analysis thereof was excluded from this study.
As TWINSPAN indirectly analyzes environmental gradients based only on the species composition of plant communities, it may not be easy to derive environmental gradients from communities with many accidental species (Sasaki et al., 2015; Park et al., 2018). To complement this, a canonical correspondence analysis (CCA) was conducted to identify the relationship between vegetation and ten environmental factors, including topography, soil’s physicochemical characteristics, and growth environment, for 80 survey plots (Ter Braak, 1986). By examining the structure and species composition of the vegetation in the study site based on the results of classification, ordination, distribution by DBH class, and soil physicochemical analysis (Choung et al., 2006), we sought to comprehensively determine the degree of succession progress and species that may appear in the future.
Results and Discussion
Ecological characteristics of vegetation
Community classification and general overview
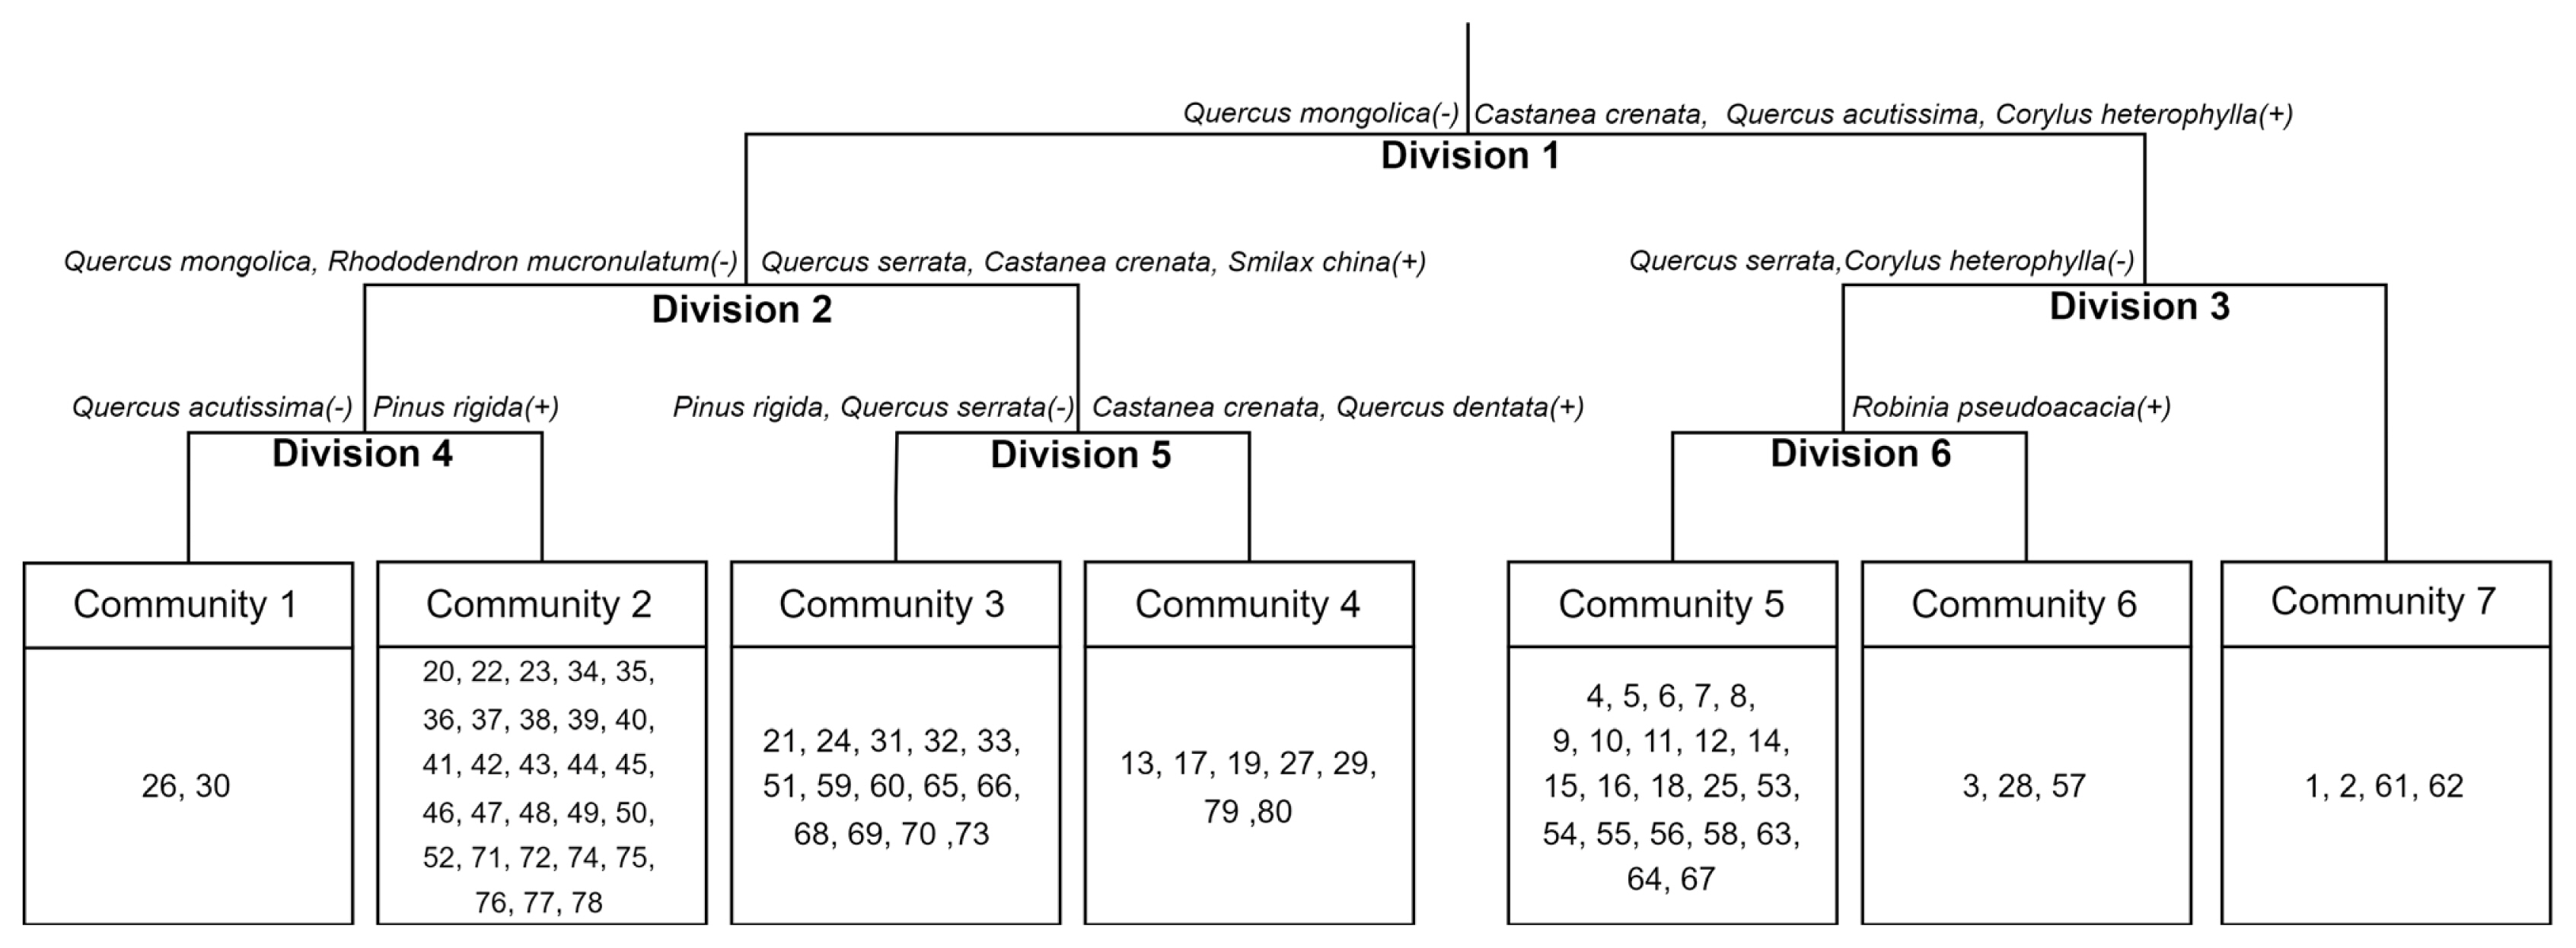
By classifying plant communities using TWINSPAN, Division 1 was broadly divided into a group in which Quercus mongolica (−) did not appear as an indicator species, and a group in which Castanea crenata, Quercus acutissima, and Corylus heterophylla (+) appeared. The group in which Quercus mongolica did not appear (Division 2) was divided into a group in which Quercus mongolica and Rhododendron mucronulatum did not appear, and a group in which Quercus serrata, Castanea crenata, and Smilax china appeared. The former (Division 4) is finally determined as Community 1 where Quercus acutissima did not appear and Community 2 where Pinus rigida was an indicator species; the latter (Division 5) was finally determined as Community 3 where Pinus rigida and Quercus serrata did not appear and Community 4 where Castanea crenata and Quercus dentata were indicator species. The group in which Castanea crenata, Quercus acutissima, and Corylus heterophylla were indicator species was divided into a group in which Quercus serrata and Corylus heterophylla did not appear (Division 6) and Community 7. Division 6 was divided into Community 6 where Robinia pseudoacacia was an indicator species, and Community 5 where Robinia pseudoacacia was not an indicator species. As such, the survey plots were classified into a total of seven communities (Fig. 2).
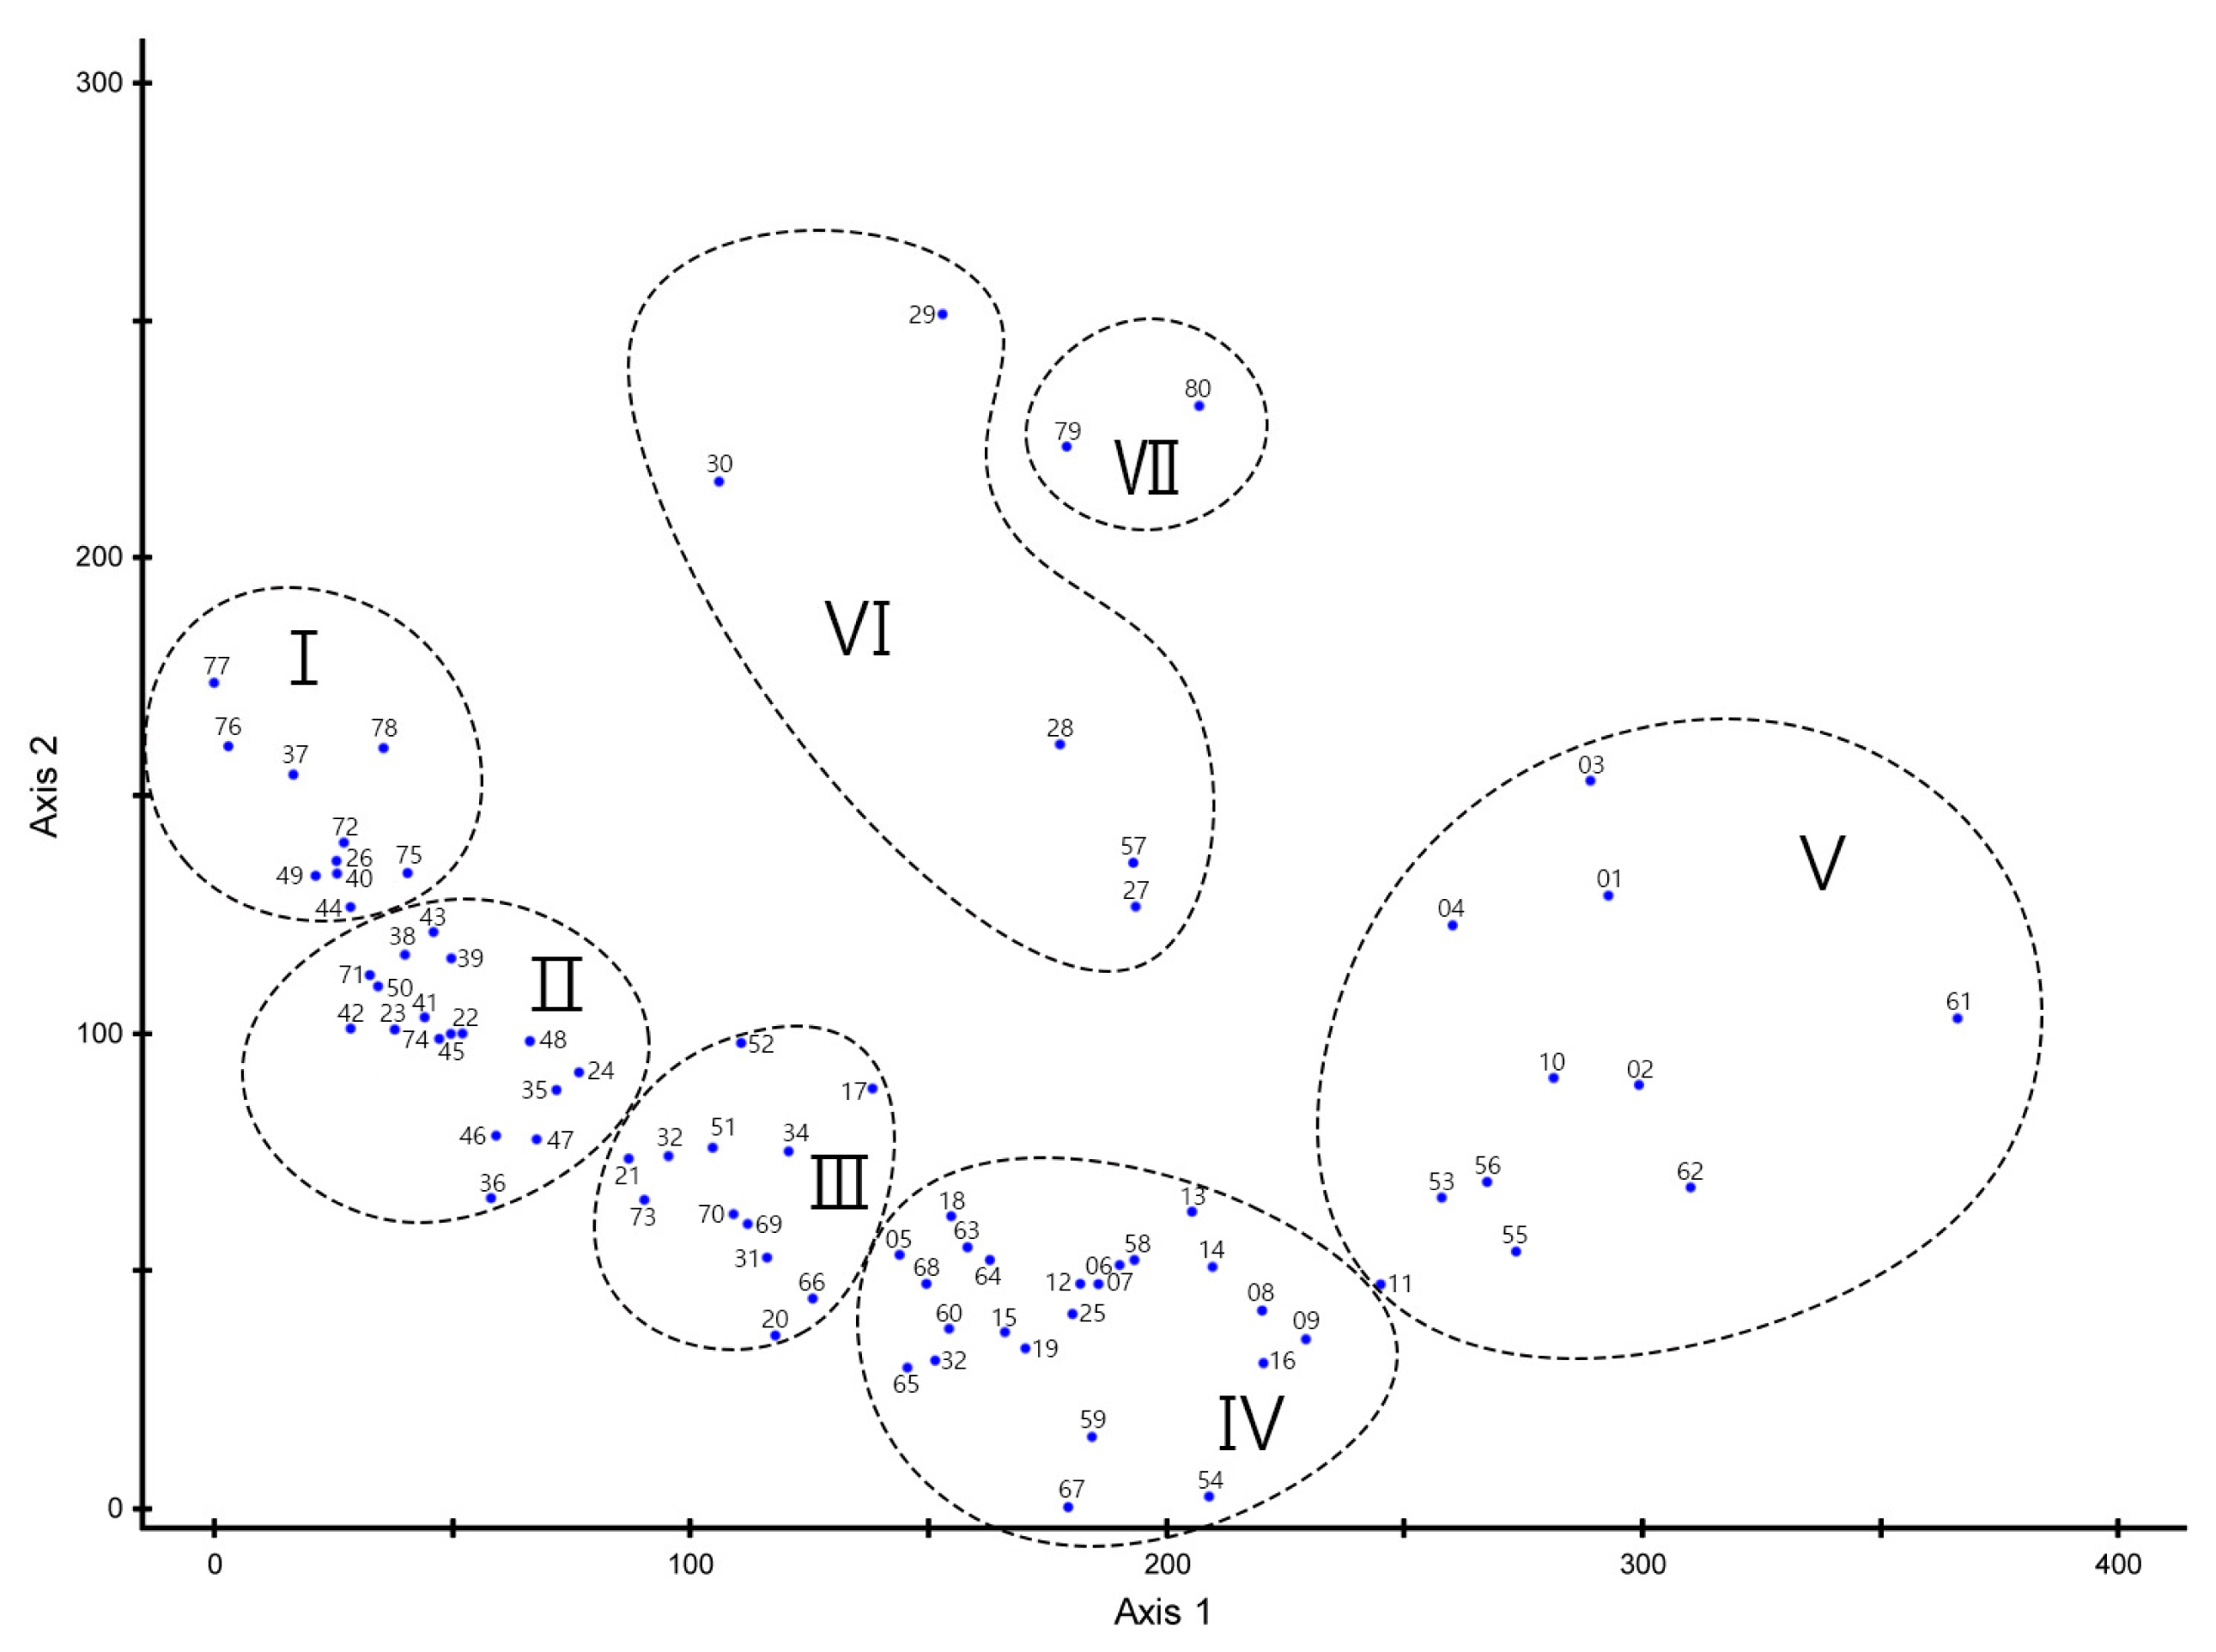
The eigenvalue of each axis derived from DCA was 0.5172 for axis 1, 0.3700 for axis 2, and 0.2938 for axis 3. As the concentration was high on axes 1 and 2 with the explanatory power of 88.78%, the communities were classified based on those axes (Fig. 3). They were divided into a total of seven communities: from the left, Quercus mongolica (I), Quercus mongolica-Pinus rigida (II), Pinus rigida-Pinus densiflora (III), Pinus rigida-Quercus spp. (IV), Castanea crenata-Quercus acutissima (V), Robinia pseudoacacia (VI), and Pinus koraiensis (VII). Among various environmental factors in the distribution of communities, it is estimated that axis 1 was affected by aspect (direction) and axis 2 by altitude above sea level (ASL). Although the results of community classification using TWINSPAN was clear, they have the disadvantage of the properties of each community not being clearly displayed due to overlapping indicator species between communities. Therefore, in this study, the vegetation of survey plots was classified into 7 communities based on the DCA analysis results.
Table 1 shows the ASL, aspect, slope, and specifications of dominant species by stratum for the seven communities. The survey plots had an elevation of 64-226 m above sea level and a slope of 2–60°, and the aspect was set to all directions. Looking at each community, Communities Quercus mongolica and Quercus mongolica-Pinus rigida, which were dominated by Quercus mongolica, were mainly distributed in the northwest or northeast direction, with an altitude of about 140 m or more above sea level, and a slope of about 25° or more. Among the Pinus rigida dominant communities, the community competing with Pinus densiflora was located on a steep slope with an altitude of approximately 129.4 m and a slope of approximately 27°. On the other hand, the community competing with the Quercus spp. was located in relative lowlands, with an altitude of approximately 98 m and a slope of 14°. Castanea crenata and Pinus koraiensis in small areas were located on gentle slopes at the border with urbanized areas or lowlands, below 100 m above sea level, and Robinia pseudoacacia were located on flat areas along ridges.
The tree height of the canopy was 15m or higher in all communities excluding Community Pinus koraiensis, and the coverage was mostly around 70%. The tree height of the understory was 4–5 m for Communities Quercus mongolica, Quercus mongolica-Pinus rigida, and Pinus rigida-Pinus densiflora, while it was 6 m or higher for the remaining communities. The coverage was 30% or more for the communities excluding the Quercus mongolica dominant communities, with a good stratification structure.
Importance percentage and species status
Table 2 shows the importance percentage (IP) and mean IP (MIP) of major woody plants in the seven communities classified based on DCA analysis. In the canopy of Community Quercus mongolica, Quercus mongolica (IP: 72.9%) was dominant, whereas in the understory and shrub layers, Sorbus alnifolia (IP: 45.8%) and Quercus mongolica (IP: 24.2%), and Rhododendron mucronulatum (IP: 34.6%) and Quercus mongolica (IP: 27.5%) competed, respectively. In the canopy of Community Quercus mongolica-Pinus rigida, Pinus rigida (IP: 66.4%) and Quercus mongolica (IP: 22.1%) co-appeared, but in the understory and shrub layers, Quercus mongolica, a tall tree, was dominant with IP of 65.7% and 40.4%, respectively.
For Communities Pinus rigida-Pinus densiflora and Pinus rigida-Quercus spp., Pinus rigida was dominant in the canopy with IP of 82.8% and 82.1%, respectively, but Quercus mongolica, Quercus serrata, Quercus acutissima, and Castanea crenata were dominant in the understory. In the canopy of Community Pinus rigida, Pinus rigida dominated and the status quo was expected to be maintained, but in the understory, deciduous Quercus spp., including Quercus mongolica, Quercus serrata, and Quercus acutissima, were becoming dominant, and were highly likely to compete with the former in the future.
In the canopy of Community Castanea crenata-Quercus acutissima, Castanea crenata (IP: 43.5%) and Quercus acutissima (IP: 25.1%) were competing, whereas in the understory and shrub layers, Castanea crenata was dominant. This community, which was formed on a low-lying, gentle slope, had low coverage of understory vegetation due to trampling by people to collect chestnuts. In the canopy and understory of Community Robinia pseudoacacia, Robinia pseudoacacia dominated with IP of 69.6% and 40.3%, respectively, but was competing with tall trees, Quercus spp. including Quercus acutissima, Quercus mongolica, and Quercus serrata. In the shrub layer, Corylus heterophylla (IP: 28.4%), Robinia pseudoacacia (IP: 22.3%), and Rhododendron mucronulatum (IP: 12.6%) co-appeared.
In Community Pinus koraiensis, Pinus koraiensis (IP: 77.0%), which was planted in the canopy, dominated, but as it was not managed, Quercus mongolica, Castanea crenata, and Styrax japonicus were dominant in the understory. However, Magnolia obovata, a naturalized species that appeared in other communities, was not observed.
Diameter at breast height (DBH)
Looking at the distribution status of the main species appearing in each community by DBH class (Table 3), in Community Quercus mongolica, 10 Quercus mongolica trees or more were observed for each DBH class of 12–27 cm, respectively, and 248 trees were observed in the shrub layer; whereas 1–7 Pinus rigida trees for each DBH class of 7–22 cm appeared, but were not observed in the lower layers. In Community Quercus mongolica-Pinus rigida, for each DBH class of 7–27 cm, 10–37 individuals of Pinus rigida, 11–18 individuals of Quercus mongolica, and 3–10 individuals of Pinus densiflora appeared and competed. However, for DBH class of 7 cm or less and the shrub layer, only Quercus mongolica was observed. In Community Pinus rigida-Pinus densiflora, Pinus rigida was dominant, with 6–36 individuals appearing for DBH classes of 7 cm or more, while only 1–5 individuals of Pinus densiflora were observed. Quercus mongolica was not flourishing with 1–6 individuals appearing for DBH classes of 7 cm or more, but 375 individuals appeared for DBH classes of 7 cm or less along with the shrub layer, becoming more dominant in the lower layers. In Community Pinus rigida-Quercus spp., for DBH classes of 7 cm or more, 1 to 49 Pinus rigida trees were observed; while for DBH classes of 7 cm or less and shrub layers, the populations of Castanea crenata, Quercus acutissima, Quercus mongolica, and Quercus serrata were increasing, where competition with deciduous Quercus spp. was expected in the future.
In Community Castanea crenata-Quercus acutissima, Castanea crenata was dominant over other species, with 1–58 individuals appearing for all DBH classes of 0–57 cm and 285 individuals appearing in the shrub layer. For two competitive species, 21 Quercus acutissima trees appeared only for DBH classes of 12–32 cm; 2 individuals of Prunus jamasakura were observed for DBH classes of 32 cm or more, and 12 individuals for DBH classes of 0–22 cm, suggesting that Castanea crenata will remain dominant. Even in Community Robinia pseudoacacia, Robinia pseudoacacia was dominant with 1–18 individuals appearing for all DBH classes of 0–37 cm, but Quercus mongolica and Quercus serrata were observed to be 10 individuals or less for each DBH class of 0–27 cm, indicating that the status quo will be maintained for a long period of time. In Community Pinus koraiensis, Pinus koraiensis was dominant with 14 individuals appearing for DBH classes of 12–27cm, but the population of Quercus mongolica was increasing for DBH classes of 12cm or less and the shrub layer.
Species status, diversity, and similarity
Table 4 shows the number of species and population appearing in each stratum per unit area (100m2) of the seven communities. The number of species appearing in each survey plot ranged from 3 to 21, and the average number of species appearing in each community ranged from 7.2 to 11.6. In the two communities dominated by Pinus rigida, the most species were observed, with over 10 species appearing. The mean population ranged from 6.7 to 11.8 individuals for the canopy, 7.7 to 14.5 for the understory, and 38 to 107.2 for the shrub layer, with Community Robinia pseudoacacia being the largest at 129.6 individuals.
Species diversity was high at around 0.8 for Communities Pinus rigida-Pinus densiflora, Pinus rigida-Quercus spp., and Pinus koraiensis, while it was low at around 0.6 for Community Robinia pseudoacacia, and the two communities dominated by Quercus mongolica. Species evenness also showed the same results as species diversity, with Community Pinus koraiensis being the highest at 0.826. The dominance of Community Robinia pseudoacacia was the highest at 0.329, which seemed to be a result of the rare appearance of tree species other than Robinia pseudoacacia.
In terms of the similarity between communities (Table 5), it was high at approx. 70% between Communities Quercus mongolica and Quercus mongolica-Pinus rigida, between Communities Quercus mongolica-Pinus rigida and Pinus rigida-Pinus densiflora, and between Communities Pinus rigida-Pinus densiflora and Pinus rigida-Quercus spp.. While the similarity between Communities Quercus mongolica-Pinus rigida and Pinus rigida-Quercus spp. was high at around 50%, the similarity between the communities dominated by Quercus mongolica and Community Castanea crenata-Quercus acutissima or Community Robinia pseudoacacia was approx. 20%, making them heterogeneous communities.
Soil properties
By analyzing the physicochemical properties of soil by community (Table 6), it was found that the mean soil acidity (pH) ranged from 4.17 to 4.57, with no significant difference by community. The mean soil pH of Community Castanea crenata-Quercus acutissima was the highest at 4.57, and that of Community Robinia pseudoacacia was the lowest at 4.17. The mean electrical conductivity (EC) ranged from 0.07 to 0.15 dS/m, and in contrast to soil pH, the mean EC of Community Robinia pseudoacacia was the highest at 0.15 dS/m, while Community Pinus koraiensis was the lowest at 0.07dS/m. The mean organic matter content (OM) by community ranged from 3.34 to 7.69%; the mean OM of Communities Robinia pseudoacacia and Pinus koraiensis were higher than that of other communities at 7.61% and 7.69%, respectively. As for exchangeable cations content, Community Robinia pseudoacacia with the lowest pH had the highest mean of 2.94 cmol/kg, while Community Quercus mongolica had the lowest mean of 0.33 cmol/kg.
Relationship between environmental factors and vegetation
By classifying forest vegetation in 80 survey plots into 7 communities and analyzing CCA ordination and 11 environmental factors including topographical characteristics (e.g., ASL and slope) and soil physicochemical properties, axes 1 and 2 with an eigenvalue of 67% were selected and schematized (left diagram in Fig. 4). However, since the exchangeable cation values of two study plots corresponding to Robinia pseudoacacia communities were high and seemed to have a significant effect on the results, the right diagram was schematized by re-analyzing the survey plots excluding the two (right diagram in Fig. 4).
ASL and slope among topographical factors, and pH and K+ among soil physicochemical properties were found to be environmental factors that affect vegetation distribution. ASL and K+ on Axis 1, and slope and pH on Axis 2 showed a high correlation. The two communities dominated by Quercus mongolica, and Community Pinus rigida-Pinus densiflora were analyzed to be mainly distributed in steep slopes at high ASL. Communities Pinus rigida-Quercus spp. and Castanea crenata-Quercus acutissima were distributed in places with high pH and, while Communities Robinia pseudoacacia and Pinus koraiensis were growing in places where the values of all factors were generally low.
Community characteristics and succession trends
Urban forests not only play a major role in improving the urban environment through alleviating microclimates, preserving natural ecosystems, and absorbing carbon (Yang et al., 2022; Buchavyi et al., 2023; Russo and Cirella, 2018), but are also closely related to quality of life, having effects such as promoting leisure activities and creating and maintaining good landscapes (Lee et al., 1993; Kim et al., 2022; Chang et al., 2021; World Health Organization, 2012; Jang et al., 2002; Kwon et al., 2004; Chiesura, 2004; Lee et al., 2018). From an ecological perspective, they have biodiversity and environmental conservation functions, but have different species composition and vegetation structure from natural forests (No, 2015; Dwyer et al., 1992).
In terms of vegetation, natural forests are generally dominated by Carpinus laxiflora or deciduous Quercus spp., but forest vegetation in or near cities has a distorted structure, including development in peripheral areas, dominance of exotic species, and unformed lower layers due to excessive use (Park et al., 2009; Lee et al., 1997; Yi and Choi, 2000). For Seoul, it was reported that although natural vegetation was dominant, the inside of forests is colonized by exotic species including Pinus rigida, Robinia pseudoacacia, and Castanea crenata, and has the characteristic of being dominated by tree species that are highly adaptable to the urban environment (Lee et al., 2005; Lee et al., 2006a, 2006b; Jang et al., 2013; Kong et al., 2014; Han et al., 2014; Ro et al., 2015). As the mountains Cheongnyangsan, Bulgoksan, and Bulamsan located in the Seoul Metropolitan region were dominated by Pinus rigida, Robinia pseudoacacia, and Larix kaempferi rather than natural vegetation, it was suggested that they need to be managed to restore biodiversity (Oh et al., 1988; Lee et al., 2021; Lee and Shim, 2017).
Though urban forests are essential to the lives of urban residents, the closer they are to urban areas, the more they are typically dominated by tree species introduced for the purpose of mountain restoration and fuel forest rather than native species, due to external disturbance (Kim et al., 2012; Korea Forest Service, 2011; Lim, 1994; Kim, 1993). Ultimately, it seems that vegetation management through minimal intervention based on accurate surveys is required to improve the overall functions of ecosystem services of urban forests, including improving the environment and quality of life.
Mt. Chilbosan, located on the border of Suwon, Hwaseong, and Ansan, was ecologically sound enough for protected species including Metanarthecium luteo-viride, Habenaria radiata, and Drosera rotundifolia to grow, mainly in abandoned rice paddies and mountain wetlands in the valley. However, a decline in the groundwater level due to surrounding development, illegal harvesting, and use currently prevents such species from growing in areas other than wildlife protection areas. The natural vegetation of the study site has been damaged by external factors including various development plans for forest edges and farmland and a high number of visitors, as well as the planting of exotic species such as Pinus rigida and Robinia pseudoacacia, and invasion of the naturalized species Magnolia obovata (Suwon Environmental Movement Center, 1998; KNHC, 2006; Ko and Shin, 2009). Mt. Chilbosan and the surrounding forests are key green spaces not only for people’s leisure activities but also for the establishment of green networks. Therefore, we conducted this study as it appeared that understanding the status of vegetation should be a priority for the sound use and management of the mountain.
To determine the characteristics of the plant community structure on Mt. Chilbosan, 80 survey plots were set considering dominant species, topography, and vegetation structure, and then the species and specifications for each vegetation stratum were surveyed. Vegetation in the plots was classified into 7 communities: Quercus mongolica, Quercus mongolica-Pinus rigida, Pinus rigida-Pinus densiflora, Pinus rigida-Quercus spp., Castanea crenata-Quercus acutissima, Robinia pseudoacacia, and Pinus koraiensis. Environmental factors affecting the emergence of communities were found to be topography such as ASL and slope. This is consistent with the earlier finding that the factor that has the greatest effect on vegetation distribution is ASL (Yun et al., 2022).
In general, it has been reported that forests near cities are dominated by non-native species, including Robinia pseudoacacia, Pinus rigida, and Larix kaempferi, which were planted along with native species, and the study site also had similar vegetation and community characteristics (Lee et al., 1997; Lee et al., 2006a; Kong et al., 2014; Lee and Shim, 2017; Lee et al., 2021). Looking at the characteristics of plant community structure by community, for Communities Quercus mongolica and Quercus mongolica-Pinus rigida, Quercus mongolica dominated, or was competing with Pinus rigida in the canopy, but in the lower layers, Quercus mongolica was thriving. Since Quercus mongolica is a cool-temperate deciduous broadleaf tree that is distributed horizontally up to Onseong-gun, Hamgyeongbuk-do and vertically up to 1,800 m above sea level (Chung and Lee, 1965; Jang and Yim, 1985), the study site with an altitude of 239 m was confirmed to be a suitable habitat. Meanwhile, on Mt. Chilbosan, Pinus rigida was planted for the first time in South Korea in the 1930s to improve the devastated state (KNHC, 2006). The DBH class and growth status of the species at the study site were good. For Communities Pinus rigida-Pinus densiflora and Pinus rigida-Quercus spp., Pinus densiflora, or Quercus mongolica, Quercus acutissima, and Quercus serrata seemed to appear and compete in the canopy, but Pinus rigida was dominant and the status quo was expected to be maintained. However, for Pinus rigida dominant communities, the population of Pinus rigida was high in the middle or high DBH class, while the pattern of rapid decline in the population in the lower classes was repeated. In the long term, it was expected that Pinus rigida would be eliminated through competition. It was reported that the succession of temperate forests generally progresses from planted species or evergreen conifers to Quercus spp. (Lee et al., 2021); and that in the Seoul metropolitan region, the Quercus spp. community will be maintained in its current state even if its seedlings and saplings do not appear in the lower layers (Han et al., 2022; Yun et al., 2022). For Communities Quercus mongolica and Pinus rigida in the study site, since Quercus mongolica appeared in high density in the lower layers, and the succession of evergreen conifer and planted stands tends to progress to deciduous forest, it was expected to be maintained or succeeded to communities dominated by Quercus mongolica (Kim et al., 2016). Kim and Oh (1993) suggested that changes in vegetation can be predicted through distribution analysis by DBH class; for populations appearing by DBH class, Pinus rigida generally had a high frequency of appearance for DBH classes of 7–22 cm, while Quercus mongolica appeared at high density even for the DBH class of 2cm or less and the shrub layers. As for urban forests, tree species that are highly adaptable to urban environments, including Sorbus alnifolia and Styrax japonicus, tend to appear (Lee et al., 2006b; Kwak, 2011; Han et al., 2014), but as other tree species appeared on Mt. Chilbosan, it seems that the forest was less damaged.
Exotic species including Magnolia obovata and Robinia pseudoacacia were reported to be distributed mainly in open areas which were not covered by the canopy (Han et al., 2014), but in this study site, they appeared in all communities except Community Pinus koraiensis, growing not only on the periphery but also inside (Table 2). Robinia pseudoacacia is highly likely to be naturally eliminated in the early stages of succession, while Magnolia obovata is highly likely to germinate after dispersal. If the latter occupies the canopy in the future, species diversity is likely to decrease (Kwon, 2014), so long-term monitoring of its spread seems to be necessary.
Communities dominated by representative planted species, Castanea crenata, Robinia pseudoacacia, and Pinus koraiensis, were distributed around forest edges, or hiking trails frequently used, and had been damaged by various disturbances. Community Castanea crenata-Quercus acutissima, in the canopy of which Castanea crenata was flourishing, seems as though it will maintain its current status in the future, although it had been damaged by repeated use for chestnut harvesting in the lower layers. For Community Robinia pseudoacacia, it was expected that if deciduous Quercus spp. flourish in the lower layers, the succession would proceed to these species (Song et al., 2023). However, as Quercus mongolica, Quercus acutissima, and the like in this study site did not flourish, no change was expected. If external disturbances are removed, or use is reduced, it seems that the succession to the native Quercus spp. will proceed (Lee et al., 2009). For Community Pinus koraiensis, as the vegetation in the lower layers is managed, the status quo is maintained, but to increase biodiversity, it is necessary to introduce or partially remove native species (Bae et al., 2011).
Among the planted stands distributed in urban forests, it was suggested that communities dominated by Pinus rigida or Robinia pseudoacacia are likely to change when native species appear in the lower layers, but the succession will not proceed smoothly (Lee et al., 2021). However, in the lower layers of this study site, as Quercus mongolica is becoming dominant, succession to a Quercus mongolica community can be expected (Jang et al., 2013). Meanwhile, Pinus rigida, a plantation species native to North America, occupied approx. 26% of the 1.713 million ha of planted stands (Kim et al., 2012; Korea Forest Service, 2011), while Robinia pseudoacacia began to be planted for the purpose of restoring mountain areas and creating fuel forests, and was planted in an area of approx. 0.32 million ha by 1978 (Lim, 1994; Kim, 1993). Since, in summary, urban forests are composed of natural forests where Quercus mongolica, Pinus densiflora, and the like grow, and planted stands where Pinus rigida and Robinia pseudoacacia dominate (Oh et al., 1988), it appears that vegetation management involving minimal intervention should be implemented for ecological succession to improve ecosystem services. Consequentially, since urban forests are in a damaged state, there is a need to make efforts to fundamentally improve the environment (Han et al., 2022) and manage the forests using native species adapted to the urban environment by reflecting the characteristics and changes in vegetation structure.
Species diversity was low in communities where succession had progressed to Quercus mongolica, whereas it was high at around 0.8 in Communities Pinus rigida-Pinus densiflora, Pinus rigida-Quercus spp., and Pinus koraiensis. This was in line with the finding of Kwak et al. (2013) that species diversity increases during the succession stage. However, compared to Bukhansan National Park, and the mountains Cheongnyangsan, Namsan, Gwanaksan, Ansan, and Bongsan in the Seoul metropolitan region, where species diversity was 1.0 or higher (Lee et al., 2021; Jang et al., 2013; Han et al., 2022; Kang and Bang, 2001), those communities had lower diversity overall. There are findings that the low species diversity is attributable to a decrease in the number of species in the shrub and herb layers over time, leading to a simplification of the plant community structure (Kim et al., 2021), but there seems to be a difference since Mt. Chilbosan is located in the Seoul metropolitan region and has not reached its climax. Another study presented the finding that species diversity decreases where understory vegetation is damaged and the dominance of a single species increases (Han et al., 2022). This seems to be related to to the situation that Quercus mongolica, Robinia pseudoacacia, and Pinus rigida thrived in the canopy and lower layers. To improve species diversity, Lee et al. (2021) suggested the following: prevention of soil acidification, supplementation of native species, prevention of excessive expansion of species adapted to urbanization, protection of understory vegetation, and species with hygropreference, and management that leads to a multi-layered vegetation structure.
For similarity between communities, it was high at around 70% between Communities Quercus mongolica and Quercus mongolica-Pinus rigida, between Communities Quercus mongolica-Pinus rigida and Pinus rigida-Pinus densiflora, and between Communities Pinus rigida-Pinus densiflora and Pinus rigida-Quercus spp. It was presented that since communities with a high degree of similarity generally have similar environments favorable for survival, their species composition and vegetation structure become similar (Cox, 1976). It seemed that the high similarity between Quercus mongolica-dominant communities and Pinus rigida-dominant communities, which are in competition in the succession sequence on Mt. Chilbosan, is because the succession is progressing from Pinus rigida, a planted species, to Quercus mongolica (Kwak, 2011; Park, 2016). In addition, although there were some differences in topographical structure, communities dominated by Quercus spp. and Pinus densiflora were found to have high environmental similarities: high soil acidity, and the appearance of Magnolia obovata, Sorbus alnifolia, and Styrax japonicus, which are indicator species for changes in the urban environment. Whereas the similarity between communities dominated by Robinia pseudoacacia, Castanea crenata, and Pinus koraiensis, and between communities dominated by Quercus mongolica and other communities, was analyzed to be heterogeneous at approx. 20%. This seemed to be attributable to the status that succession had already progressed and developed into a specialized community, and that the lower layers had been damaged by artificial disturbance. Notably, if the similarity was 20% or less, such communities were not likely to co-exist, which seems to be due to exclusivity that resulted from mutual competition between species, and differences in location such as ridges or valleys.
As for soil environments by community, the soil acidity (pH), which affects the content of organic matter and exchangeable cations, ranged from 4.17 to 4.57, and was analyzed to be similar or slightly lower compared to 4.16–5.13 on Mt. Surisan, Gyeonggi-do (Lee et al., 1997), 4.40 on Mt. Namsan, Seoul (Han et al., 1997), and 4.59 on Mt. Cheongnyangsan, Incheon (Lee et al., 2021). However, the pH range is not much different from pH 4.3, the average acidity of forest soil in South Korea according to Lee and Koo (2020), which seems to be low overall since most Korean soils, derived from granite and granitic gneiss, have a low cation exchange capacity (CEC), making it highly likely that nutrients will be leached (Cho et al., 1998; Jeong et al., 2003).
As for organic matter content (OM), long-term monitoring was necessary, based on the findings on urban forests suggesting that tree species highly resistant to environmental pollution, including Sorbus alnifolia and Styrax japonicus, may frequently appear where the soil becomes acidic and the OM is low (Lee et al., 1998; Woo et al., 2000; Kwak, 2011). The soil properties of forests in the Seoul metropolitan region were similar to those of forests which had a clear tendency to acidify and reduce CEC (Jang et al., 2013). However, it seemed that the large differences in soil properties between communities were caused by locational conditions including slope, aspect, and ASL, rather than the dominant communities.
Regarding the vegetation structure of urban green spaces, it was predicted that deciduous Quercus spp. would decline and pollution-resistant species including Styrax japonicus, Acer pseudosieboldianum, and Sorbus alnifolia would increase due to low OM, acidification, and environmental pollution (Lee et al., 2000; Lee et al., 1998; Woo et al., 2000; Kwak, 2011; Jang et al., 2013; Lee et al., 2006a; Han et al., 2022). Mt. Chilbosan, the study site, was not only close to the downtown of Suwon City, but also had a poor soil environment with active forest use. It seemed that it would be difficult for a forest with these environmental conditions and vegetation structure to achieve succession to Carpinus laxiflora forests, known as the climax species, in temperate climates. It further appeared that areas currently dominated by exotic species including Pinus rigida, Robinia pseudoacacia, and Castanea crenata would undergo succession to Quercus mongolica, which was dominant in the lower layers. However, since it seems to be difficult for succession to proceed due to external disturbance and soil acidification, and species with high adaptability to acidic soil are expected to appear, it is necessary to monitor the forest on a long-term basis. Moreover, the results of this study are expected to be used as basic data for follow-up research and management of urban forests.
Conclusion
The expansion of cities into the outskirts has resulted in decreased green spaces, microclimate change, and loss of biodiversity. In the long term, this led to the proliferation of exotic species, simplified vegetation structure, and reduction of species diversity, beginning to deteriorate urban environments. In this process, as citizens’ awareness of the importance of parks and green spaces was enhanced, and outdoor leisure activities increased due to the prolonged COVID-19 pandemic, the need for urban green spaces was raised. Among them, urban forests, including Mt. Chilbosan, not only satisfy citizens’ needs for green spaces, but also play a major role in addressing various environmental problems. However, the mountain is prone to disturbance, which is attributable to low ASL, a decline in groundwater level resulted from surrounding development, illegal harvesting, and an increased number of visitors, and has a species composition and vegetation structure that are different from natural forests. It was the first area where Pinus rigida was planted in the 1930s to improve its degraded condition, and as of 2006, its overall forest physiognomy had a larger area of coniferous forests (80%) than broadleaf forests (20%). However, its forest type map in 2022 shows a decreasing trend in coniferous forests, with coniferous trees at 63.4%, broadleaf trees at 16.2%, and mixed forests at 13.8%. Ultimately, the forest on Mt. Chilbosan is in the process of succession to a natural forest dominated by deciduous Quercus spp. including Quercus mongolica and Quercus acutissima from planted stands dominated by Pinus rigida and Robinia pseudoacacia. However, as it is located near the downtown and exposed to the risk of damage as a result, it is in need of vegetation management. Notably, based on our survey of the plant communities, as a natural succession from planted stands to natural forest is in process, there is a need to minimize artificial disturbance right now caused by use. To increase the naturalness and diversity of urban forests in the future, it is necessary to induce succession to forests of native species adapted to the urban environment by reflecting the characteristics and changes in vegetation structure. It seems that this restoration of naturalness should be achieved through vegetation management by minimal intervention to strengthen the functions of ecosystem services of urban forests located near cities and at low ASL.
As for Magnolia obovata, not only is it distributed at high density in disturbed areas such as the periphery, but it is also observed to appear sporadically within the forest, so a detailed survey appears to be necessary. Since it is spreading on Mt. Chilbosan, management should be conducted to prioritize the removal of large trees, and saplings distributed around them, based on the results of a survey conducted in the winter when the leaves have fallen.