


Introduction
Air pollution is one of the most critical threats to human health, resulting in respiratory system and heart disease, and lung cancer. Many studies have shown that traffic emissions are one of key sources that can lead to the increased concentration of air pollution in urban areas; as such, controlling the air quality in urban areas is becoming a considerable challenge (Choudhary and Gokhale, 2019; Ghermandi et al., 2019).
The optimal solution for improving urban air quality is to use plants as bio-filters to reduce the concentration of particulate matter (PM) because plants play an irreplaceable role in mitigating PM concentration in the air (Heidt and Neef, 2007). Plants accumulate PM directly on the surface and wax layer of the leaf, and thus the features of the leafŌĆÖs surface, such as the roughness of the leaf surface, the leaf area index, and stomata, have a great influence on the potential accumulation of PM on plants (Jeong et al., 2021; Kwak et al., 2020; Kwon et al., 2020; 2021; Li et al., 2019; Popek et al., 2017). The amount of PM accumulation is significantly different between various plant species and different sites because the amount of PM accumulation on plant species is influenced by leaf structure, environmental conditions, and the degree of PM concentration in the air (Li et al., 2019; Przybysz et al., 2014a, 2014b; Wang et al., 2019). Modification to the biochemical and physiological characteristics of the plant results in changes to the leafŌĆÖs traits, such as chlorophyll content, carotenoid content, leaf extract pH (pH), relative leaf water content (RWC), and specific leaf areas (SLA) under the impact of air pollution (Bui et al., 2021; Singh et al., 1991; Tripathi and Gautam, 2007). However, changes in leaf traits are different between various plant species. Leaf traits can increase or decrease in different pollution sites, based on the response of the plant species to the air pollution and environmental conditions (Bharti et al., 2018; Chen et al., 2015). The responses of plants to air pollution differ among plant species. A few plants show high-level responses, but others are sensitive to pollution in the atmosphere. Therefore, understanding plant tolerance to pollution is necessary when selecting plants to effectively improve air pollution (Bui et al., 2021; Kaur and Nagpal, 2017). The air pollution tolerance index (APTI) was created to assess the tolerance or sensitivity level of plants to air pollution (Singh et al., 1991). The value of the APTI is determined based on the values of four biochemical parameters of the plant: leaf extract pH, RWC, chlorophyll content, and ascorbic acid (Cho et al., 2020). Plant species with a high APTI show tolerance to air pollution, but low APTI plant species are sensitive to air pollution (Ogunkunle et al., 2015). Depending on the tolerance level of each plant, it will be used for different goals. Sensitive plants were used as bio-indicators; conversely, they were planted to mitigate the amount of PM as a sink for air pollution (Rai, 2016). Plants with high APTI values showed tolerance to air pollution, while plants with low APTI values showed sensitivity to air pollution. The aim of this study was to determine the tolerance of different plant species to air pollution in order to select plants with a high tolerance that can be planted in environments with high air pollution. This study evaluated the APTI of 12 common plant species that grew in two sites with different air pollution levels in Cheongju, South Korea.
Research Methods
Study site and leaf sampling
To determine the APTI of the 12 plant species in an urban setting, we collected leaf samples from two sites with different air pollution concentrations in Cheongju, South Korea. The samples were collected from the side of a high-traffic road in the city center and in an urban forest (Fig. 1). The urban forest was part of the Chungcheongbuk-do Forest Environment Research Institute (36┬░37ŌĆ▓33.9ŌĆ│N 127┬░ 40ŌĆ▓01.9ŌĆ│E). This site is a 25 ha area with high vegetation cover. It is located away from the city center. The roadside was a crossroad to the Cheongju Express Bus Terminal (36┬░37ŌĆ▓42.6ŌĆ│N 127┬░25ŌĆ▓41.7ŌĆ│E). It is located in the city center and has a lot of traffic.
In this study, we selected a total of 12 plants from 6 species of broadleaf and 6 species of needleleaf plants (Table 1). At the roadside, plants within 2 m of the roadŌĆÖs edge were collected. We collected leaves at 0.6ŌĆō2 m, depending on the plantsŌĆÖ structure. The same method was used to collect the samples from the urban forest. Leaves were sampled from plants free from disease and pests for analysis. The leaves of each plant species were sampled on the same day, in September 2020. For each plant, plant leaves with an area of 300ŌĆō400 cm2 were collected 5 times, put in a paper bag, and immediately moved to the laboratory and used for analysis.
Biochemical characteristics of leaves
Leaf extract pH (pH)
The pH analysis was performed with minor modifications (Sigh et al., 1991). Overall, 1 g of a fresh leaf sample was placed in 10 mL of distilled water and homogenized at 2,700 rpm using a centrifuge (Cef-6, Daihan Scientific, Korea), and then measured with a pH meter (HI8424, HANA, USA).
Relative leaf water content (RWC)
The RWC analysis was carried out based on previous protocols (Li et al., 2009). In sum, 1 g of fresh weight (FW) leaves was soaked in distilled water for 24 h in the dark at a temperature of 4┬║C, then the turgid weight (TW) value was determined. The leaf was then dried in an oven for 24 h at 80┬║C to determine the dry weight (DW).
where FW is the fresh weight, TW is the fully turgid weight, and DW is the dry weight.
Total chlorophyll (TChl)
To measure the chlorophyll content, the leaf samples (0.5 g) were frozen in liquid nitrogen and ground using a mortar; then 10 mL of 100% acetone was added, and the samples were centrifuged at 2,700 rpm for 10 min to measure the chlorophyll content. Then, the absorbance of the chlorophyll extracts was determined at 616.6 nm and 644.8 nm using an UV-Visible spectrophotometer (UV-1800, Shimazu, Japan), and the chlorophyll content was calculated using the method described by Lichtenthaler and Wellburn (1983).
(2)
where A 644.8 and A 616.6 refer to the absorbance values of the corresponding wavelengths.
Ascorbic acid
Ascorbic acid was measured according to the methods of Dinesh et al. (2015) and calculated using the following equation.
where 500 is the ╬╝g of standard ascorbic acid taken for titration, V1 is the value of dye consumed by 500 ╬╝g of standard ascorbic acid, V2 is the value of dye consumed by 5 mL of the test sample, 25 corresponds to the total volume of the extract, 100 is the ascorbic acid content/100 g of the sample, 5 is the weight of the sample taken for extraction, and 5 is the value of the test sample taken for titration.
Air pollution tolerance index (APTI)
The APTI was measured using the method described by Singh et al. (1991) with the following equation:
where A is the ascorbic acid (mg┬Ęg ŌłÆ1 FW), T is the total chlorophyll (mg┬Ęg ŌłÆ1 FW), P is the leaf extract pH, and R is the relative leaf water content (%).
Statistical analysis
All data were analyzed using SAS version 9.4 (SAS Institute, USA) using DuncanŌĆÖs multiple range test (DMRT). P-values < .05 were considered significant. The relationship between the four biochemical parameters and the APTI was identified using PearsonŌĆÖs correlation analysis.
Results and Discussion
Biochemical characteristics of leaves
Relative water content (RWC)
In this study, the RWC value varied between the 12 plant species and two sites (Fig. 2). The RWC of 12 plants in the urban forest ranged from 67.25%ŌĆō92.21%. Moreover, the RWC of the plants on the roadside ranged from 69.05%ŌĆō97.31%. The RWC of A. palmatum was highest at the two sites. On the contrary, Z. serrata showed the lowest RWC in the urban forest and roadside, respectively.
Additionally, the RWC value of plants on the roadside was higher than that of plants from the urban forest, except for G. biloba and M. glyptostroboides. The RWC reflected the water status of the plant, which plays a role in maintaining the physiological balance of the plant. Further, the RWC is related to the protoplasmic permeability of cells, which influences the loss of water and dissolves nutrients in plants, leading to leaf senescence (Sharma et al., 2017). The decreased RWC of plants at the site with high levels of pollution was due to the impact of pollution on the transpiration rate in the leaves (Pandit and Sharma, 2020). The increased RWC at the high-pollution sites was due to the plantsŌĆÖ natural response to stress to prevent water loss. Plants with high RWC showed tolerance to stress from the environment (Ogunkunle et al., 2015; Uka et al., 2019).
Leaf extract pH (pH)
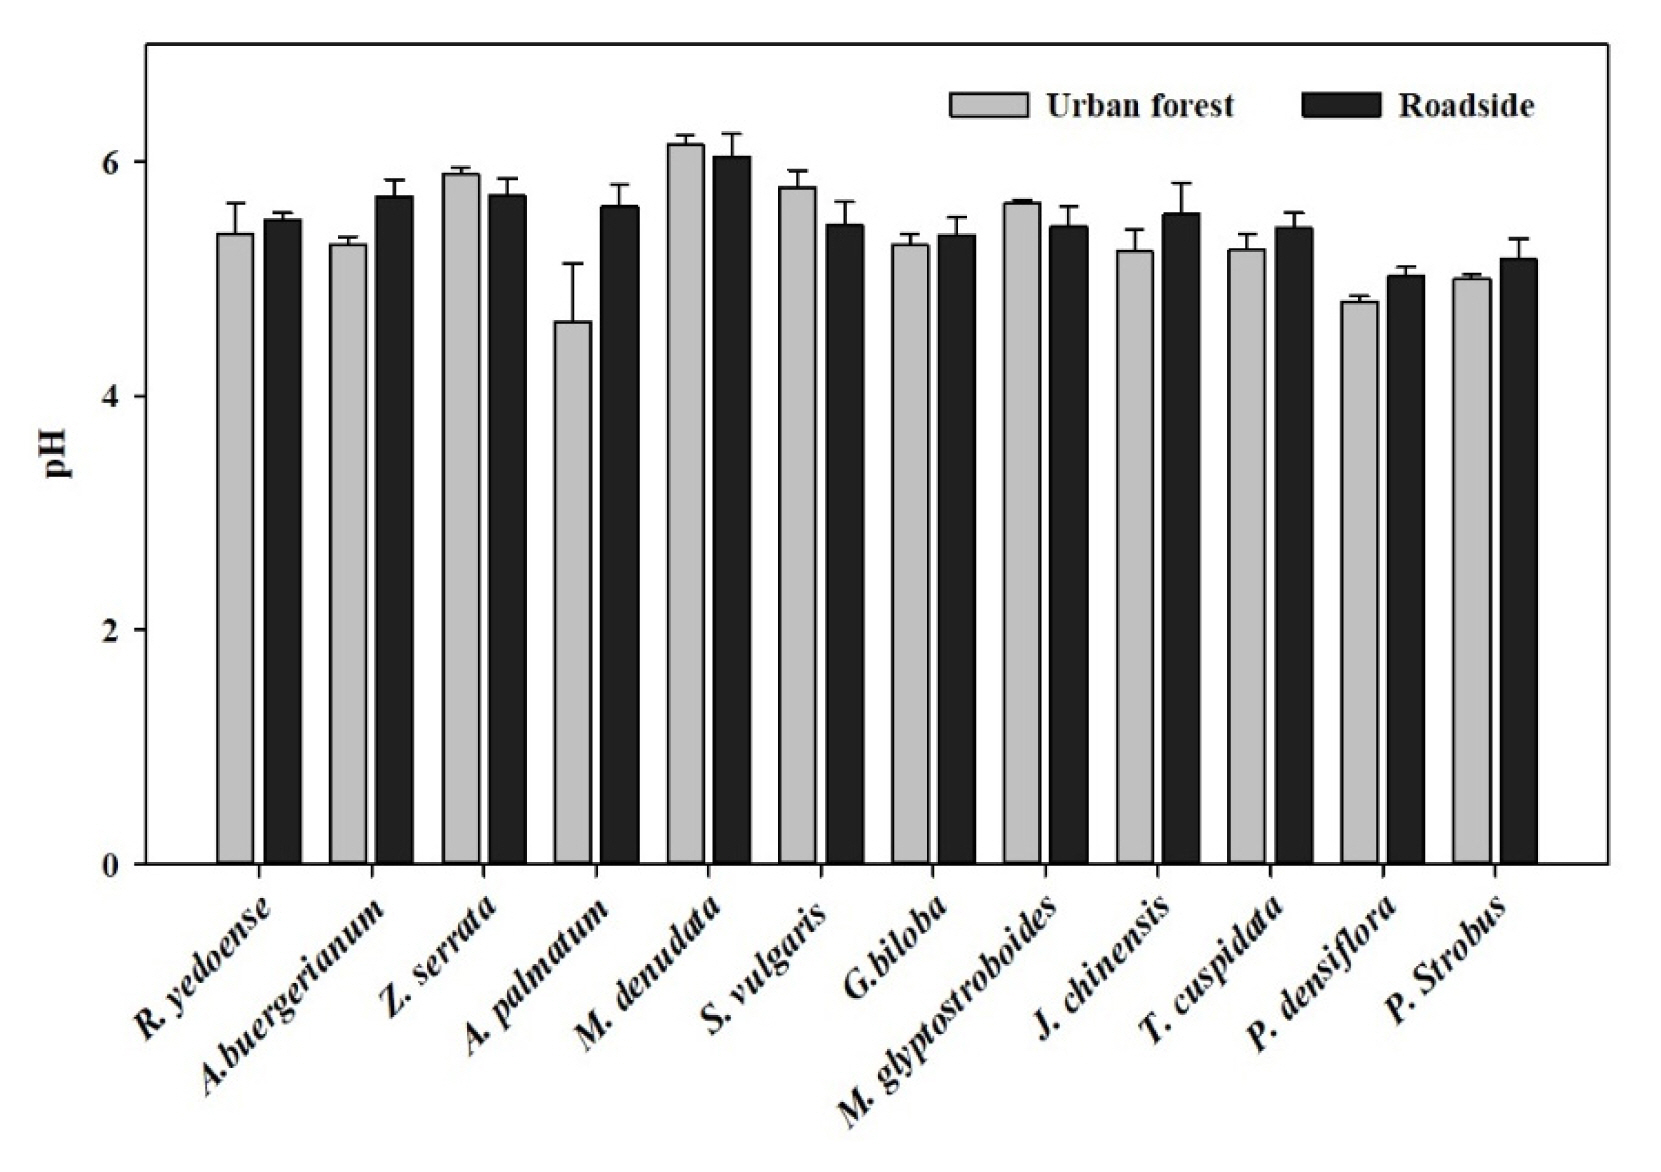
In this study, the pH of 12 plant species was significantly different between various plant species and across the two sites. Moreover, the pH of plant species obtained from the roadside tended to be higher than that of plants from the urban forest, except for M. denudata, S. vulgaris, and M. glyptostroboides. Among the 12 plant species, M. denudata showed the highest pH at both sites; conversely, the plant species that showed the lowest pH in the urban forest and roadside were A. palmatum and P. densiflora, respectively (Fig. 3).
The pH of plants served as a sensitive indicator of air pollution. A high pH can lead to the increased conversion of hexose sugar to ascorbic acid. As such, a high pH can improve the tolerance of plants to air pollution in areas with high pollution (Chen et al., 2015; Pandit and Sharma, 2020). However, the presence of SO2 and NOx in the atmosphere can cause a decrease in pH. Under SO2 from the environment, the H + could react with SO2 through the stomata of the plant, resulting in H2SO4 and a decreased pH (Kaur and Nagpal, 2017).
Total chlorophyll (TChl)
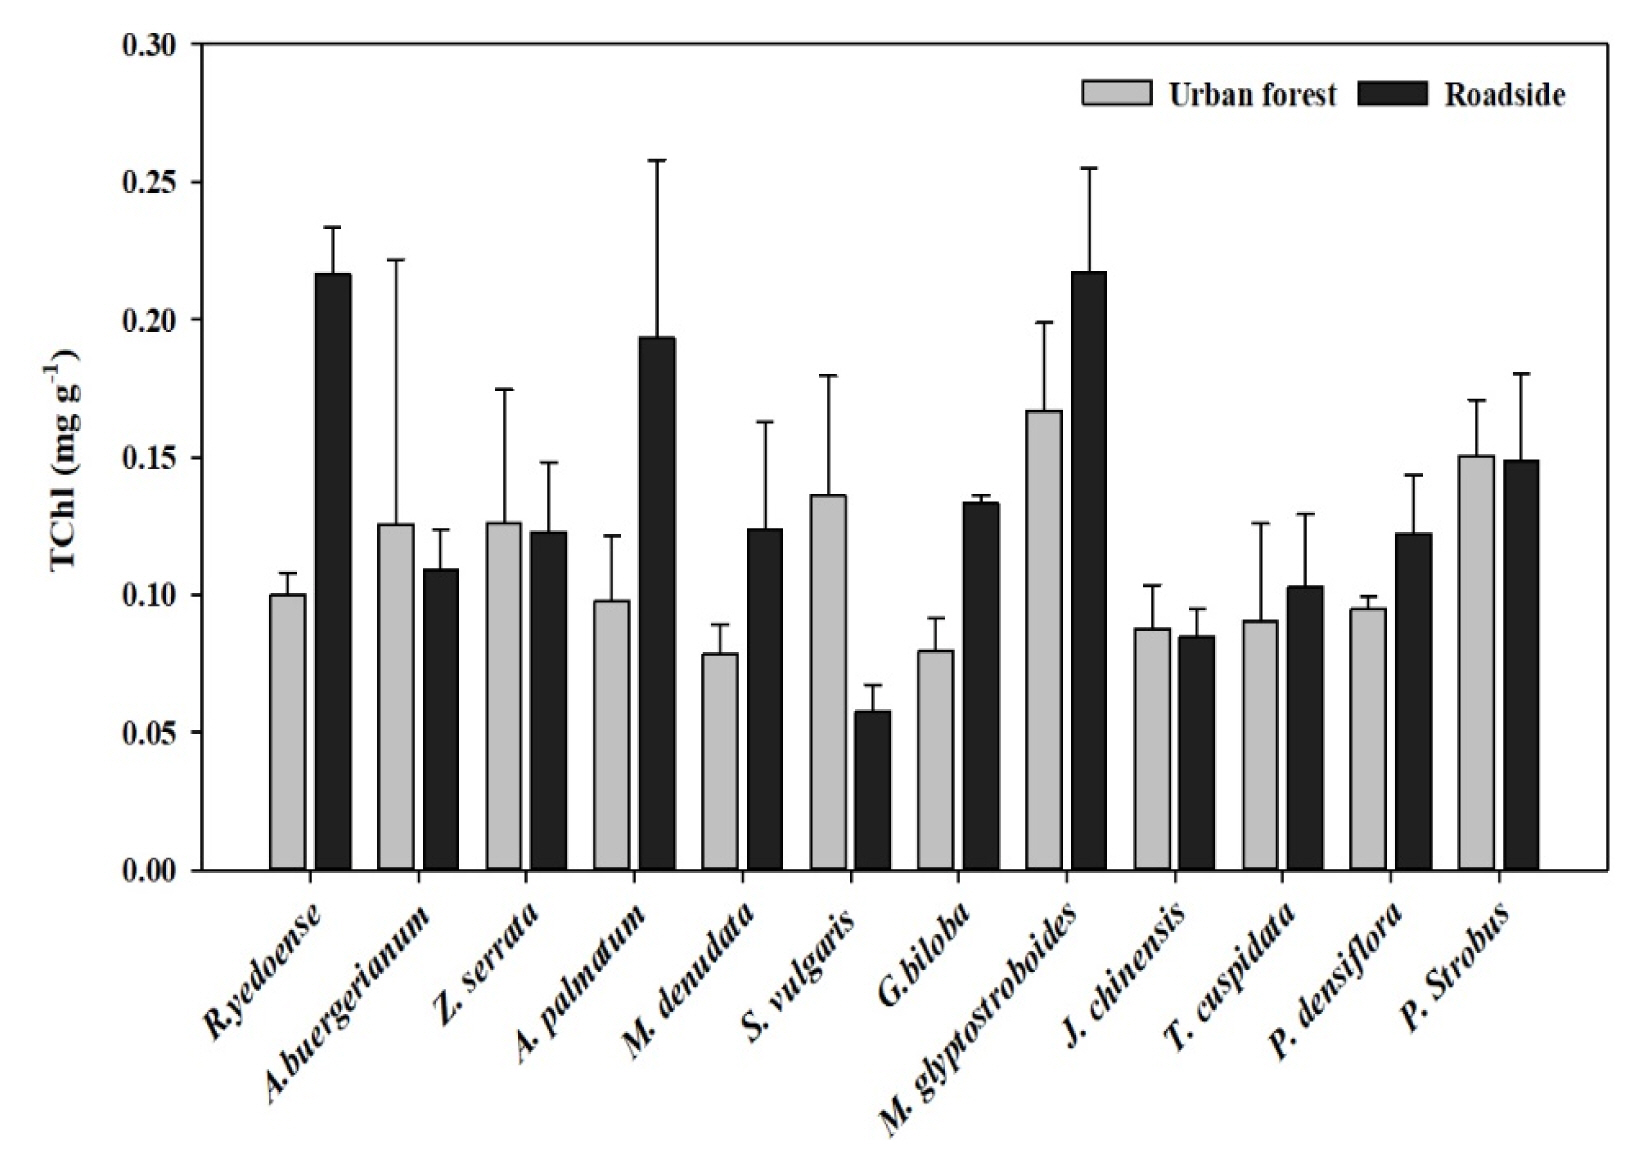
This study found that the TChl was significantly different between the 12 plant species and across the two sites (Fig. 4). The TChl of plants from the urban forests ranged from 0.078ŌĆō0.167 mg┬ĘgŌłÆ1, while the TChl ranged from 0.058ŌĆō0.217 mg┬ĘgŌłÆ1 when obtained from the roadside. The plant species that showed the lowest TChl values in the urban forest and roadside were M. denudata and S. vulgaris, respectively. M. glyptostroboides showed the highest TChl content at the two sites. Four out of the 12 plant species (A. buergerianum, Z. serrata, S. vulgaris, J. chinensis, and P. strobus) had lower TChl values when obtained from the roadside than when sampled from the urban forest.
Chlorophyll content is an indicator of the photosynthetic activity that directly influences the growth and development of the plant. The chlorophyll of plants indicated that the plants were sensitive to stress in the environment, especially air pollution. Many studies showed that chlorophyll can decrease under high PM. Since PM on the leafŌĆÖs surface can lead to decreased light absorbability for the plant, then the PM could, through the stomata, impact on the chloroplast and pigment content of plants (Chen et al., 2015; Pandit and Sharma, 2020). Also, vehicular exhausts such as SO2 or NO2 that impact leaves can lead to the decreased TChl in plants from high-pollution sites (Das et al., 2018). The increased chlorophyll observed in plants from high-pollution sites might be due to the adaptation of plants to air pollution (Ter et al., 2020).
Ascorbic acid
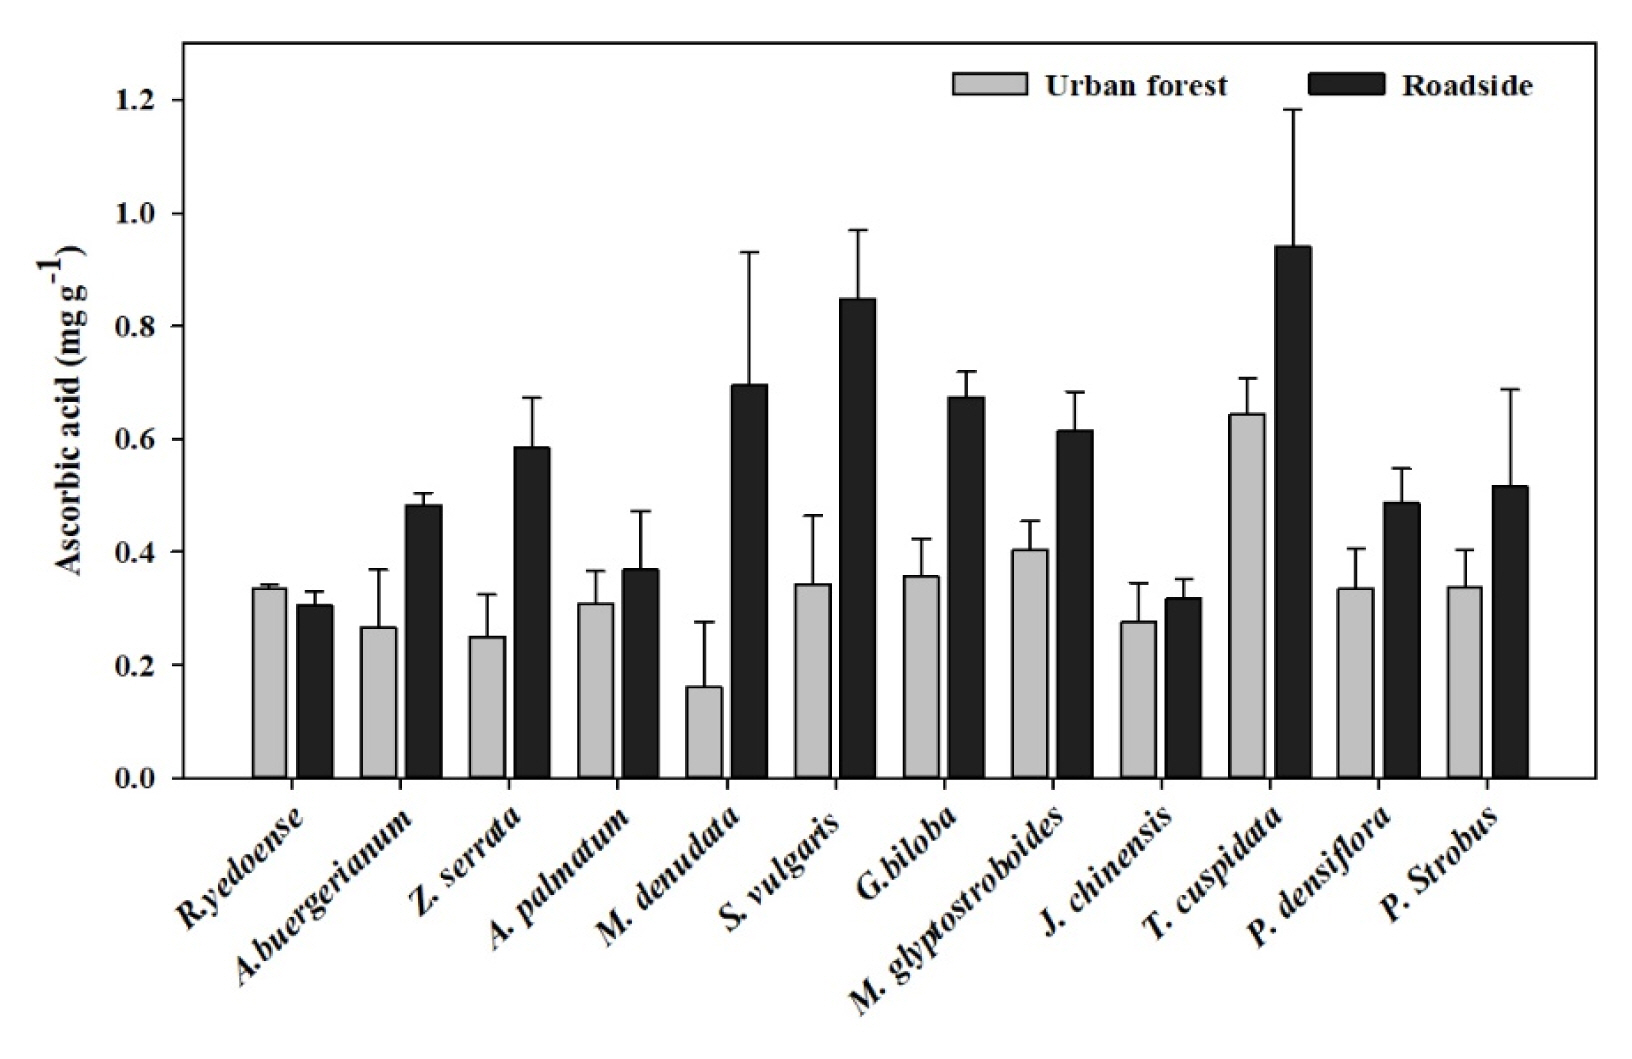
In this study, we found that the ascorbic acid of all plants was higher on the roadside when compared with the urban forest, except for R. yedoense (Fig. 5). The ascorbic acid ranged from 0.16ŌĆō0.64 mg┬ĘgŌłÆ1 in the urban forest and from 0.31ŌĆō0.94 mg┬ĘgŌłÆ1 on the roadside. The highest ascorbic acid content was observed in T. cuspidate from both the urban forest and roadside. The lowest ascorbic acid level was recorded in M. denudate in the urban forest and in R. yedoense on the roadside. Ascorbic acid is also known as vitamin C, which is often found in the growth parts of plants. It is a natural antioxidant that relates to a plantŌĆÖs resistance to air pollution (Rai et al., 2013). Ascorbic acid plays a role in cell wall synthesis, defense, and cell division. Tolerant plant species have a high amount of ascorbic acid, but sensitive plant species have low levels of ascorbic acid (Rai, 2016). Under high-stress environments, high ascorbic acid levels can defend the plant against damage by oxidative stress (Pandit and Sharma, 2020). The plant obtained from the roadside had higher ascorbic acid levels than did the plant from the urban forest; as such, the plant from the roadside showed greater tolerance to air pollution than the others, which had lower ascorbic acid levels (Begum and Harikrishna, 2010; Ter et al., 2020).
Air pollution tolerance index (APTI)
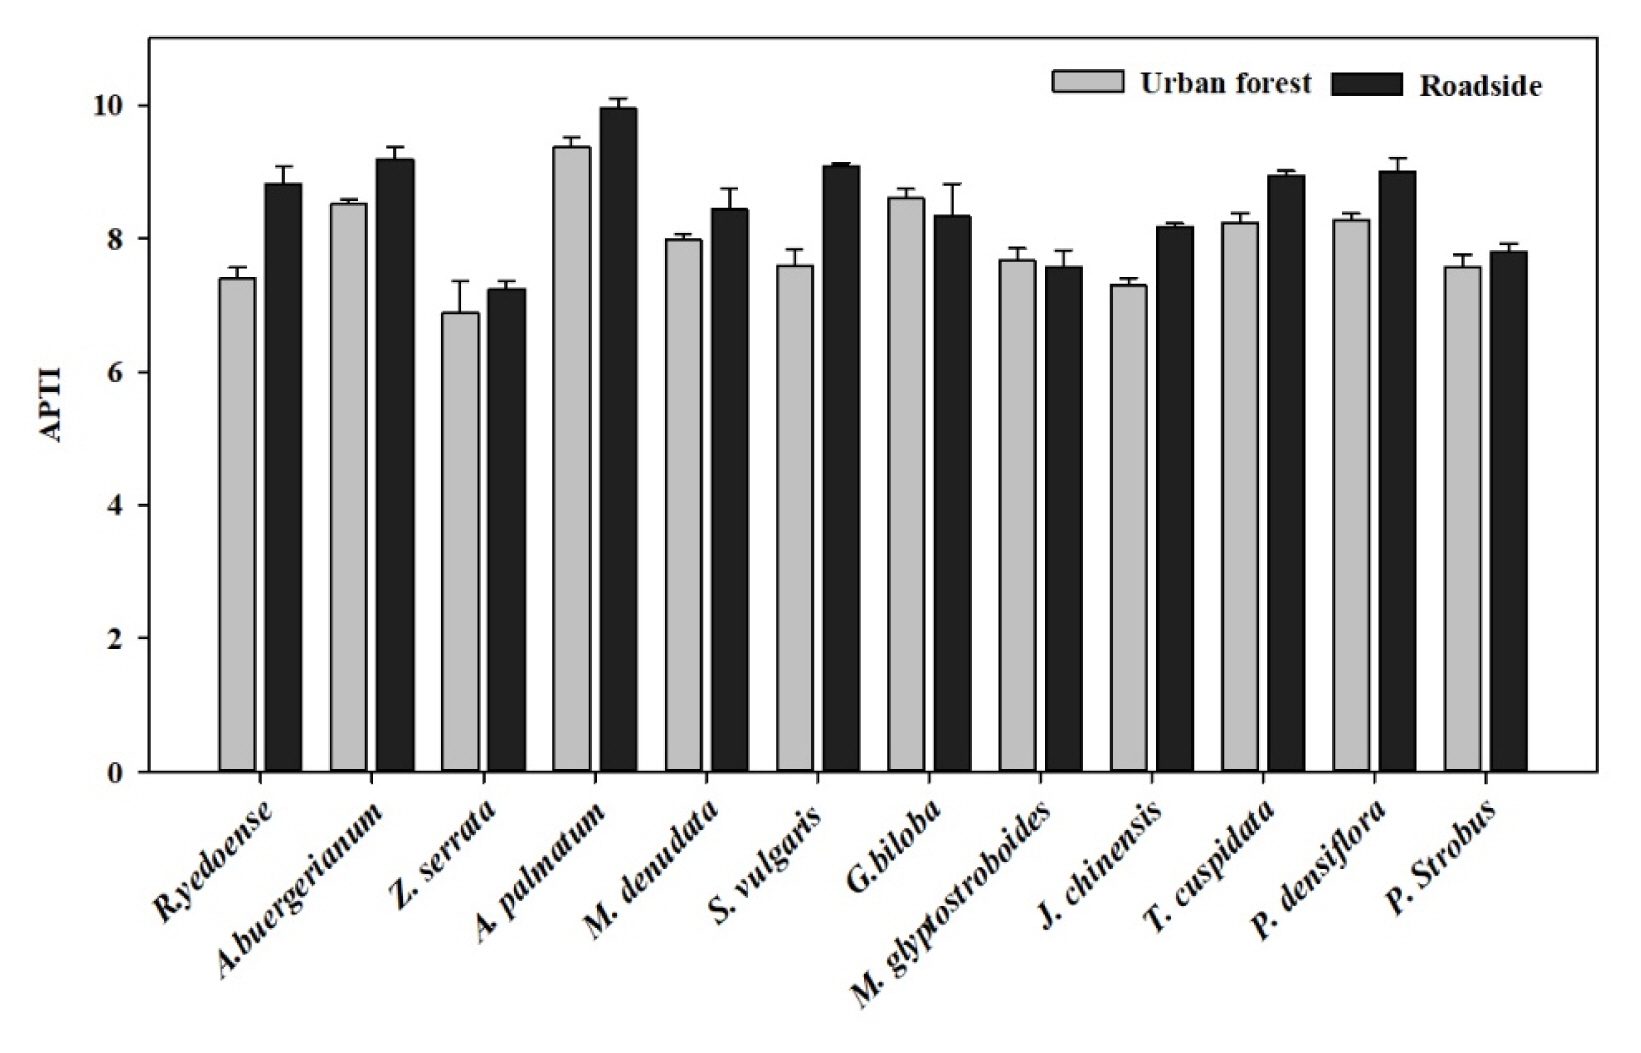
In this study, we found that 12 plants species showed different APTI between various plant species and two sites (Fig. 6). In the urban forest, the APTI value ranged from 6.87ŌĆō9.37, and the plant species that showed the highest APTI was A. palmatum, followed by G. biboba and A. buergerianum. On the roadside, the APTI of the plant ranged from 7.57ŌĆō9.94. Similar to the urban forest, A. palmatum showed the highest APTI followed by A. buergerianum, S. vulgaris, and P. densiflora. On the other hand, the plant species that showed the lowest APTI from the two sites was Z. serrata.
The APTI was used as a criterion to determine plant tolerance to air pollution; this value is based on four biological characteristics of plants (RWC, pH, TChl, and ascorbic acid) (Singh et al., 1991). The APTI was used to estimate the tolerance level of different plant species against air pollution (Barwise and Kumar, 2020; Shannigrahi et al., 2003; Tripathi and Gautam, 2007). Plant species with a high APTI showed tolerance to air pollution, but plants with a low APTI showed sensitivity to air pollution (Bharti et al., 2018; Das et al., 2018; Sahu et al., 2020).
The APTI had a positive correlation with the RWC at two sites and was negatively correlated with pH level in the urban forest (Table 2). The APTI of plants on the road-side tended to be higher than that in the urban forest (Ter et al., 2020). All 12 plant species showed a higher APTI on the roadside than in the urban forest, except for G. biloba and M. glyptostroboides. Under the same pollution conditions, the plants showed different levels of tolerance to air pollution. In environments characterized by high levels of air pollution, plants with a high APTI (A. palmatum, A. buergerianum, S. vulgaris, and P. densiflora) could be used as a bio-filter for PM. Conversely, low APTI plants such as Z. serrata, and M. glyptostroboides could be used as an indicator of air pollution.
Conclusion
This study found that the four biochemical parameters of 12 plants showed different values between sites and plant species. The RWC and ascorbic acid of the plants from the urban forest tended to be higher than those on the roadside. The highest RWC and ascorbic acid levels were found in A. palmatum and T. cuspidata. The increase in these biochemical parameters under high levels of air pollution helped to increase the resistance of plants to air pollution. We did not find any clear trends in terms of pH and TChl levels between the roadside plants and the urban forest plants. Some plant species showed a higher RWC and TChl when obtained from the roadside than from the urban forest, but some others had lower levels than the urban forest plants. The APTI values were also different between sites and plant species. Furthermore, the APTI values tended to be higher on the roadside than in the urban forest. Among the 12 plant species, A. palmatum, A. buergerianum, S. vulgaris, and P. densiflora showed high APTI values. These plants can be planted in areas with high concentrations of air pollution because they can adapt to these environments. The APTI value was significantly correlated with the biochemical parameters of plants. Specifically, we also found a positive correlation between the APTI and RWC at two sites and a negative correlation of APTI with pH in the urban forest. Hence, APTI can be used to assess the tolerance level of plants to air pollution. In this study, we determined the APTI value through thean analysis of the biochemical parameters of plants. However, we need to conduct a comprehensive review of the tolerance of plants, as the APTI value can be influenced by other environmental conditions, such as temperature, humidity, and others. Moreover, additional studies are needed to examineing the influence of the soil and climate conditions where plants are grown on other air pollution indicators, such as SO2, O3, and NOx.