


Introduction
In March 2020, the World Health Organization (WHO) declared a pandemic caused by the novel coronavirus, SARS-CoV-2 (hereinafter referred to as COVID-19) (WHO, 2021). The behavior of participating in outdoor activities has changed since the COVID-19 pandemic (National Institute of Forest Science, 2020). Considering ŌĆ£safetyŌĆØ as a top priority, the tendency that people preferred ŌĆ£small outdoor activities in nature-friendly spaces near the home where it is easy to keep their distance from other peopleŌĆØ was remarkable (Korea Tourism Organization, 2020). In addition, the analysis of comfort and relaxation for people in the COVID-19 situation found that the number of times that they mentioned ŌĆ£strollingŌĆØ ŌĆ£in the neighborhoodŌĆØ or ŌĆ£near homeŌĆØ increased significantly; compared to the pre-COVID-19 period, the number of mentions related to small travel such as ŌĆ£mountain hikesŌĆØ and ŌĆ£campingŌĆØ has increased (Ministry of Culture, Sports and Tourism, 2020).
Among these outdoor activities in 2020, a change in the hiking behavior of people in their 20s and 30s is remarkable. According to the 2018 Forest Leisure Activity Survey (National Institute of Forest Science, 2019), people in their 20s had a very low frequency of participation in forest leisure activities as part of their lifestyle, such as only 1ŌĆō2 times of mountain hikes per year (25.9%), and no mountain hikes at all (appr. 20%). They did not show much interest in such activities, citing the reason that they ŌĆ£prefer other tourist attractions.ŌĆØ However, referring to hiking experience rate by age in a ŌĆ£Factual Survey of Hiking in 2020ŌĆØ conducted by the Ministry of Culture, Sports and Tourism (MCST) and the Korea Tourism Organization (KTO), it decreased by 8.1% for those in their 40s and older compared to 2019, but increased by 3.0% for those in their 30s and below (Korea Tourism Organization, 2021b). In addition, BLACK YAK hiking community, ŌĆ£BACŌĆØ, announced that the proportion of those in their 20s to 30s among all members increased from 35.8% at the end of 2019 to 55% at the end of June 2020, accounting for the majority of new members (Cha, 2020). The workout app ŌĆ£TranggleŌĆØ also reported that the age group increased by more than 350% compared to 2019 (Kim, 2020). According to statistics on the number of members of the hiking-specific app Beagle, the increase range in 2020 was larger than that in 2019 (Beagle, 2020). One of the changes after the COVID-19 outbreak is that the number of hikers in their 20s and 30s has significantly increased, which had not been noticeable before because they used hiking trails less frequently than the middle-aged, the main hiking age group.
The size of forest welfare facilities is determined based on the existing patterns of individual demand or the scale of usersŌĆÖ activities (National Institute of Forest Science, 2019). To adequately reflect the increased needs of those in their 20s and 30s in the distribution of forest resources such as forest welfare facilities and programs, it is required to analyze the changes in mountain hiking patterns in the relevant age group.
As the number of hikers who enjoy hiking while walking along forest trails increases, research on the characteristics of hikers has been steadily conducted. Yoo et al. (2020) comparatively analyzed the relationship between visitor characteristics, service satisfaction, overall satisfaction, and loyalty in forest recreation areas and arboretums. Jang et al. (2019) analyzed user characteristics of forest recreation areas by comparing the data on a hiking-specific app and the results of a field survey. There are studies on the usage behavior of each forest space, such as forest recreation area (Heo et al., 2018; Ko et al., 2017) and suburban forest (Kim, 2015). In addition, there are previous studies using big data on mountain/forest hikes, such as Lee et al. (2020) who collected and analyzed blog and cafe articles from Naver and Daum to find out the characteristics perceived by social media users about Inje Birch Forest as a forest tourist destination; Park and Yeon (2020) identified issues related to ŌĆ£forest healingŌĆØ ŌĆö utilizing forests for enhancing health and quality of life ŌĆö by dividing news posted on Naver from 2005 to 2019 into three periods; Shin et al. (2020) analyzed social, economic, and cultural changes in arboretums and botanical gardens using social big data from 2010 to 2019; and Sim and Jang (2019) used mobile subscriber location information of visitors to Mt. Gye-ryong National Park and analyzed the usage characteristics of visitors by gender, age, and place of residence, as well as the hiking route in the park. These previous studies are summarized to have examined the usage characteristics of all age groups, focusing on forest spaces. A study related to big data on mountain hiking users analyzed peopleŌĆÖs perceptions through text mining using web crawling and the like. In recent years, a study to analyze usage behavior using mobile subscriber location information has also appeared. However, existing survey-based research has a limitation of being limited to some regions due to the geographic characteristics and some periods due to time constraints. Big data analysis broadens the regional and temporal ranges to allow us to comprehensively grasp and analyze usersŌĆÖ circumstances, and to provide insight into consumersŌĆÖ undetermined needs in advance (Choo, 2020). Therefore, this study conducted an exploratory data analysis (EDA) on the data collected through a workout app (Tranggle) to analyze the behavior of forest users. EDA enables us to acquire analytical insights and find feature values by checking the basic structure of data and basic statistical data (Kim, 2018), and to obtain useful ideas through visualization analysis in the future analysis stage (Cho, 2019).
In 2020, the change in mountain hiking users markedly increased in a short period of time. In this regard, this study was conducted to analyze the usage behavior of forest space through EDA by selecting the data of a hiking app (Tranggle) regarding users in their 20s and 30s visiting 13 mountains with the highest frequency of visits in the Seoul metropolitan area, as basic data. Based on the analysis on mountain hiking patterns of users in their 20s and 30s in the Seoul metropolitan area, we presented the management direction for future hiking.
Research Methods
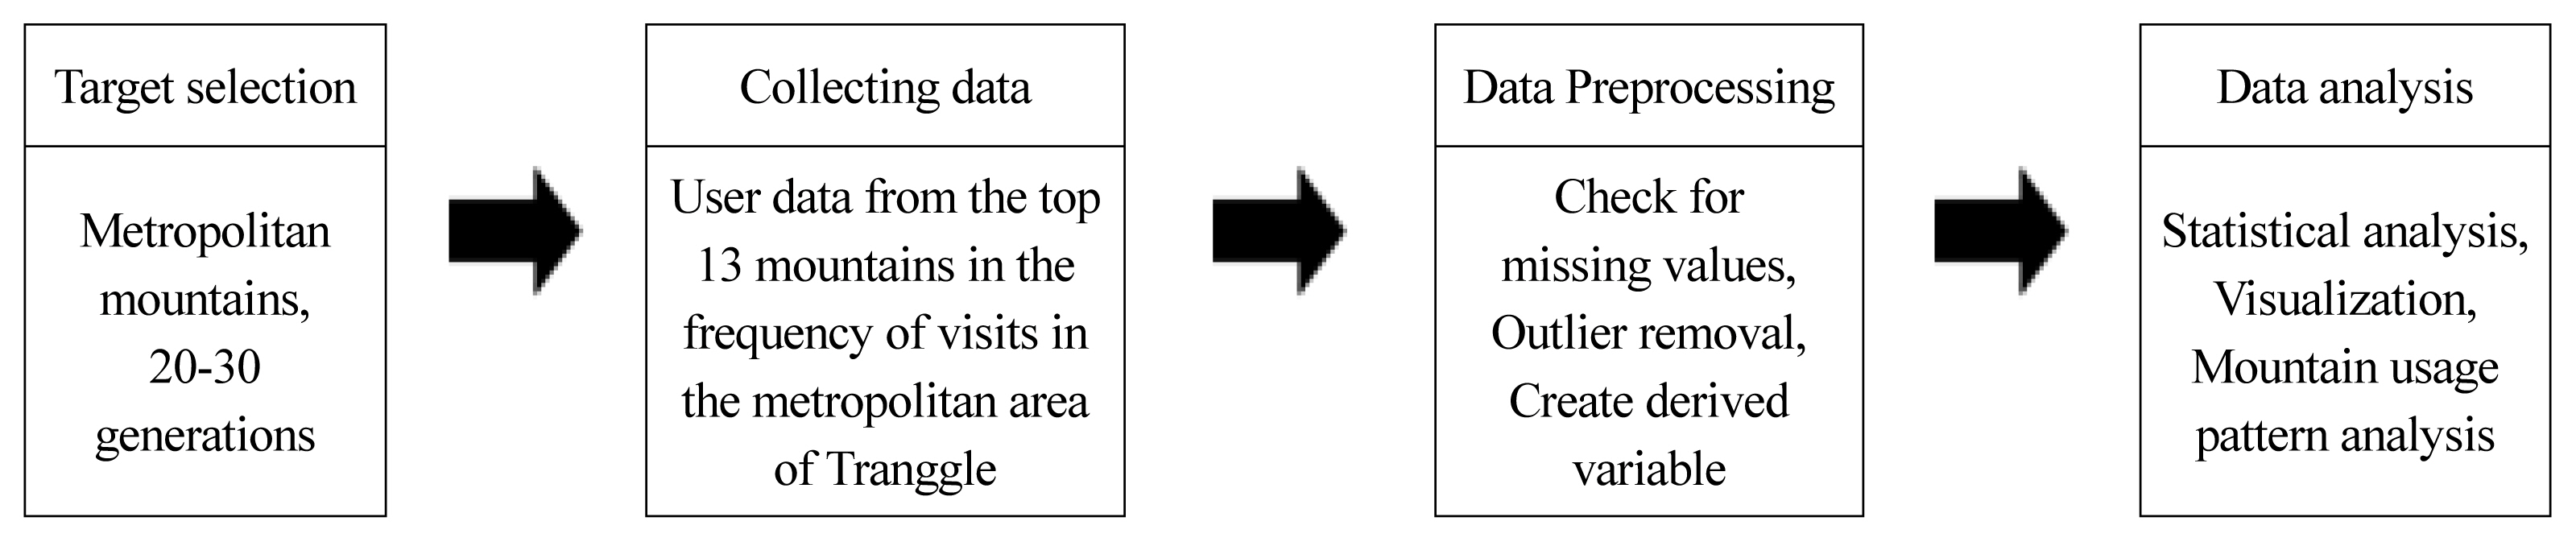
Existing usage behavior analysis has been conducted on a small scale due to time constraints focusing on some regions due to the geographic characteristics of forest space, but this study performed an exploratory data analysis (EDA) using user data to expand regional and temporal ranges. The procedure of this study is shown in Fig. 1. First, the range of location and age was selected based on previous studies, forest use statistics and generational characteristics. Second, after consulting with a company that had user data of a workout app (Tranggle), we selected the range as the top 13 mountains in the frequency of visits, and were provided with data on users in their 20s and 30s by mountain through approval procedures for data use. Third, data preprocessing (processing data suitable for analysis (Kim, 2017)) was performed to appropriately process data such as extracting part of the data, dividing it by type, or combining multiple data (Kim, 2017). Fourth, statistical analysis and visualization were performed using the processed data frame, and the mountain usage pattern was analyzed by retrieving them. The Jupyter Notebook in Anaconda Python 3.8 version was used as the analysis tool.
Target selection
In this study, we tried to analyze user data of a mountain hiking app, but it was necessary to limit the analysis targets because the data collected through the app had a wide range, a large amount, and fast accumulating speed. In a social atmosphere in which exercise is common (Lee, 2018), the Generation MZ is newly expanding and linking the existing range of exercise for complex reasons such as the tendency to feel a sense of accomplishment through exercise and the growth of the related device and platform market (Kim et al., 2020). Generation MZ or MZers is a term that encompasses Generation M and Z: the generation born in the early 1980s to mid-1990s are classified as millennials (Generation M), and the one born in the mid-1990s to mid-2000s as Generation Z (Univtomorrow20slab, 2020). To examine the forest usage patterns of MZers who actively participated in exercise, such as the recent increase in the proportion of use of exercise platforms, the age range was set for those in their 20s and 30s, the age group corresponding to being the MZ generation. In addition, referring to the findings of Park and Kim (2001) that mountain forest type had a high usage rate of middle-aged people and suburban forest type had a high proportion of young people in their twenties, the range of the place was set to 13 mountains with high frequency of visits in Seoul metropolitan area.
Collecting data
Beagle, the developer of the workout app ŌĆ£Tranggle,ŌĆØ has collected big data specialized for outdoor activities and exercise, and has provided various services based on artificial intelligence (Beagle, 2021). Since 2011, Beagle has built a tracking big data center that includes a vast amount of information such as 23 million outdoor exercise courses and tracking course data, provided by 1.23 million Tranggle GPS members, and more than 20 additional items of information, which have been used in the field of big data business (Chosun Biz, 2019). The data used in this study were provided on those in their 20s and 30s who visited the top 13 most frequently visited mountains in the Seoul metropolitan area, including Mt. A-cha, Gwan-ak, Gwang-gyo, In-wang, Bul-am, Su-rak, Do-bong, Sa-pae, Dae-mo, Sam-sung, Cheong-gye, Buk-han, and Namhan-sansung, through approval procedures after consulting with the relevant company. The period of data was from January 2019 to early December 2020, and the total number of data was 337,504, consisting of 142,806 in 2019 and 194,698 in 2020. Statistics on members in 2018ŌĆō2020 and analysis data of hiking activities of those in their 20s and 30s based on big data of Tranggle GPS, provided by Beagle, were also referenced. For the forest area by ŌĆ£GuŌĆØ, an administrative district in Seoul, statistics on the forest area of Seoul (by forest type) provided by the Seoul Open Data Plaza were used.
Data Preprocessing
The data provided had a total of 22 variables, such as classification, experience point, actual exercise distance, average speed, maximum speed, total time, travel time, maximum altitude, registration date and time, and region 2. We used these variables to create derived variables. From the classification, each group such as Hiking, and Walking was extracted. To increase the fun of mountain hikes, Tranggle has applied a ranking according to usersŌĆÖ experience point and given a level to them based on the ranking (Tranggle, 2021); experience points are given only to the effective exercise record (actual distance traveled) for hiking tracks, and the unit is mileage (M) (Tranggle, 2021). By referring this, ŌĆ£LevelŌĆØ was created by dividing experience points into sections based on the Tranggle level (rank) standard table. As registration date and time were divided into year, month, day, hour, and day of the week, ŌĆ£YearŌĆØ, ŌĆ£MonthŌĆØ, ŌĆ£DayŌĆØ, ŌĆ£HourŌĆØ, and ŌĆ£WeekdayŌĆØ were created. For month, ŌĆ£Winter seasonŌĆØ and ŌĆ£Summer seasonŌĆØ were created by referring to the criteria of winter season (November-March) and summer season (April-October) classified by Korea National Park Service (KNPS). ŌĆ£HourŌĆØ was divided into working hours (09ŌĆō18 hours), night (19ŌĆō23 hours), early morning (24ŌĆō8 hours), and all (24 hours) according to the definition of daily routine (regular tasks done every day (National Institute of the Korean Language, 2021)). In addition, ŌĆ£Rest timeŌĆØ was created by subtracting travel time from the total time; and ŌĆ£Region 2 (city/province)ŌĆØ and ŌĆ£Region 3 (city/province)ŌĆØ were created by dividing region 2 according to the unit of administrative district. Based on this, data for the ŌĆ£Metropolitan areaŌĆØ group were created by combining data from Seoul, Gyeonggi-do, and Incheon. In addition, a ŌĆ£Mountain nameŌĆØ variable was created according to each file name provided. Afterwards, processing into necessary data was carried out by checking and removing missing values and outliers.
Results and Discussion
Analysis of mountain hiking regions
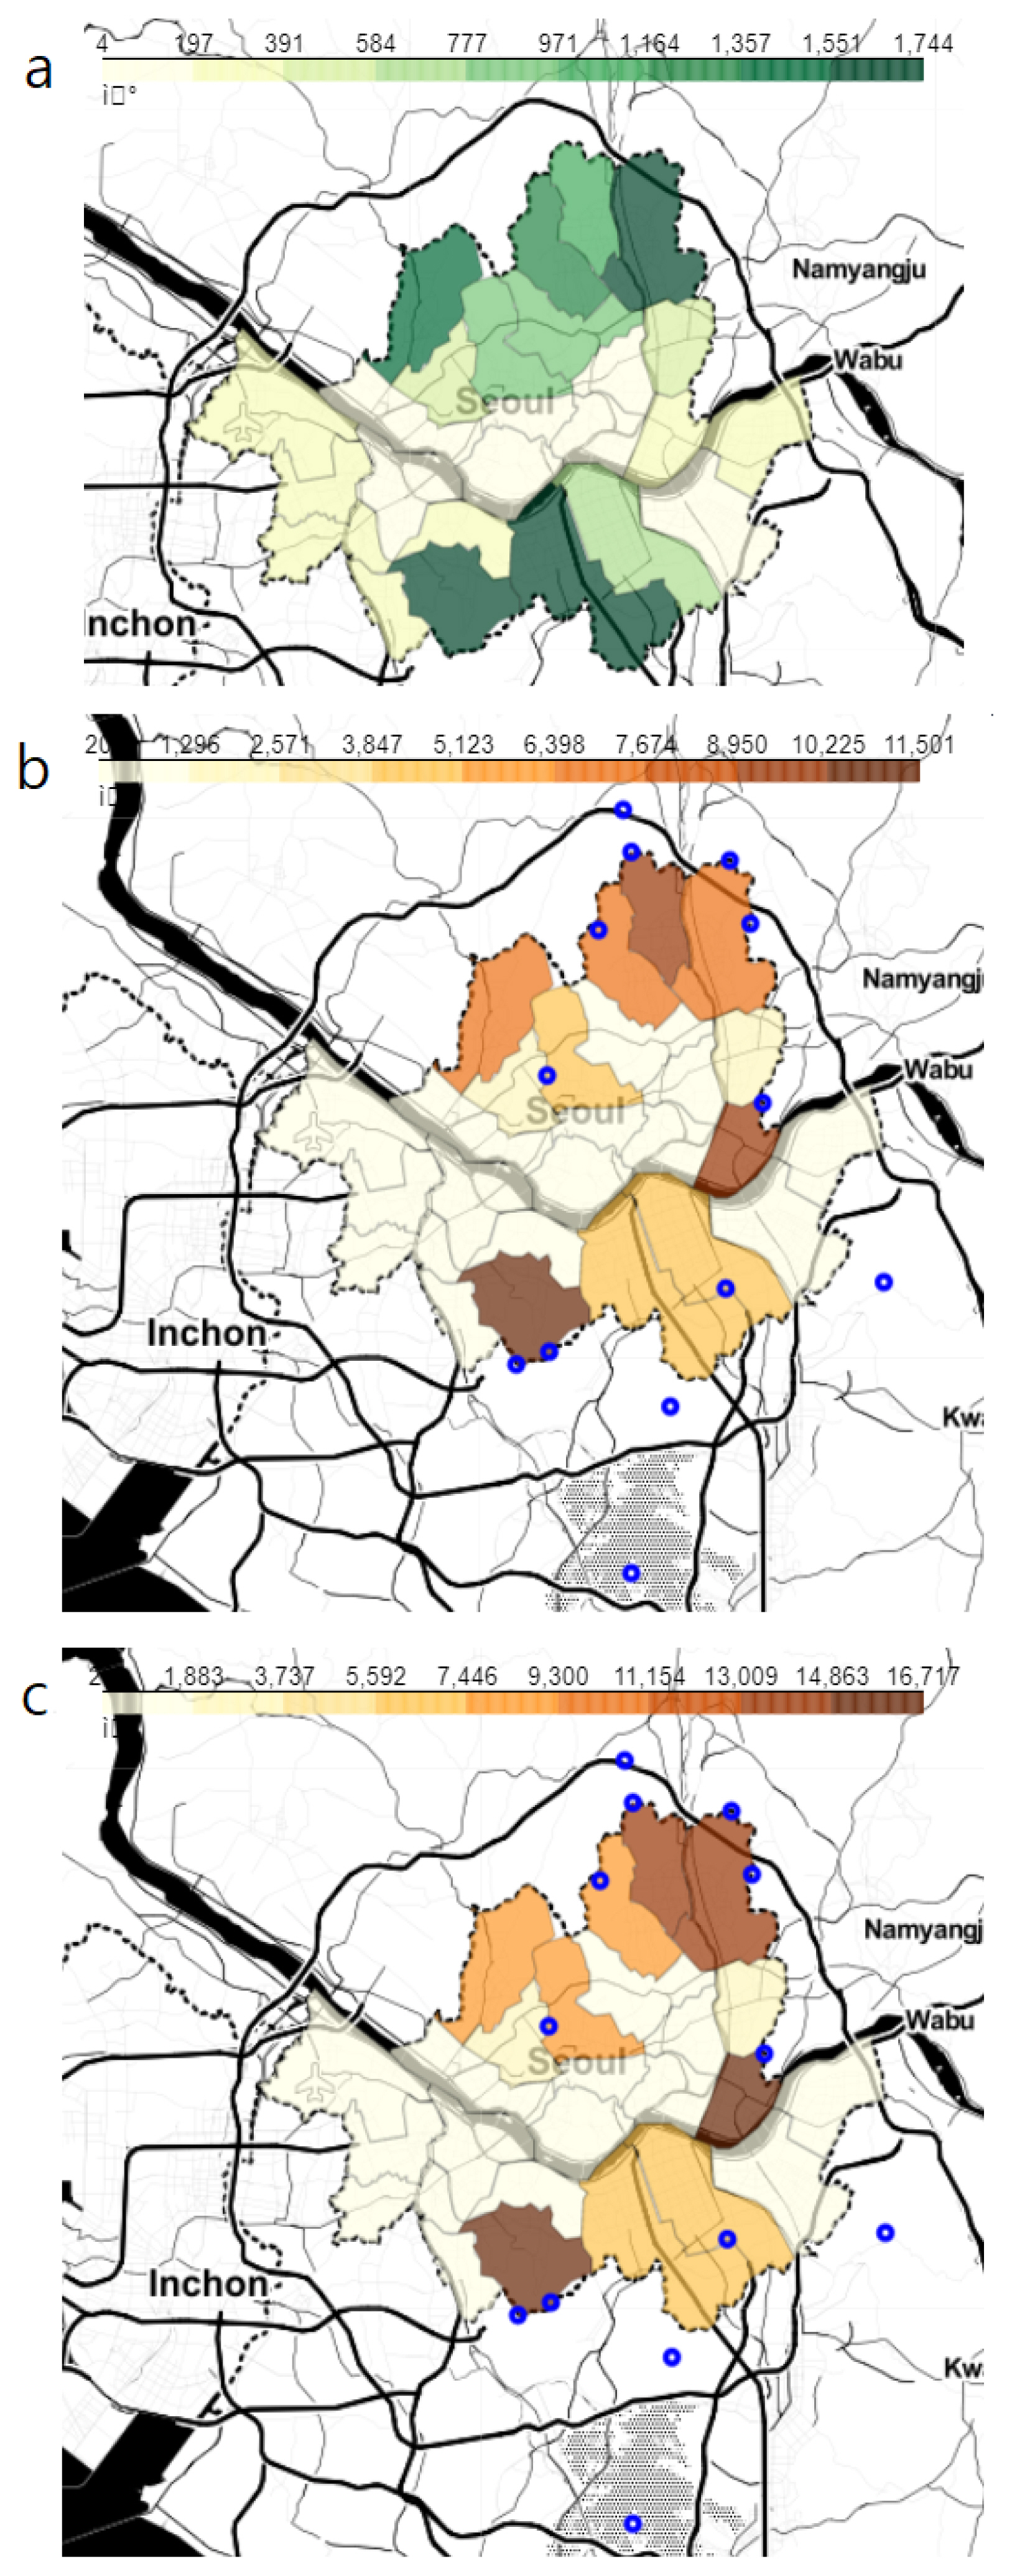
The 13 mountains with the highest frequency of visits in the metropolitan area, which were derived from users in their 20s and 30s using Tranggle app, were mostly located in the northern and southern outskirts of Seoul, and were suburban forests that form the framework of the city (Fig. 2).
In 2020, the number of visits to mountains in the metropolitan area by those in their 20s and 30s using Tranggle app increased 1.36 times compared to 2019. This result is in line with the reports, such as the statistics of visitors to national parks showing preference for suburban forest hikes over long-distance travel due to the COVID-19 pandemic (Korea National Park, 2020); and the findings of travel patterns and behavior of domestic tourists using SKTŌĆÖs T-map traffic data and KTŌĆÖs big data, indicating that demand for short-distance tourism around metropolitan areas and large cities increased rather than long-distance travel (Korea Tourism Organization, 2020; Ministry of Culture, Sports and Tourism, 2020).
To examine the factors that increased mountain hikes in the metropolitan area, we analyzed the top 3 regions (si (city), gun (county) and gu (district)) with high frequency of usage by mountain (Table 1). For the mountains including Buk-han, Bul-am, Su-rak, and Cheong-gye, the frequency of usage by region was evenly distributed in the past, or spread evenly in 2020; and for the other nine mountains, except for the three mountains, the frequency of usage in the regions, which showed the highest frequency of usage in 2019, got higher. This was related to the regional distribution of hiking trails by mountain. For mountains where the regions used by hikers were evenly distributed, hiking trails were evenly created in nearby areas, and for mountains with high frequency of use only in specific regions, hiking trails were built around specific areas only. In addition, according to the analysis results of hiking activities by users in their 20s to 30s based on big data acquired from BeagleŌĆÖs Tranggle (Beagle, 2020), visitors to Mt. Buk-han were evenly distributed over many peaks of the mountain, and those to Mt. Gwan-ak were concentrated on the Sadang Station-Yeonjudae course, and those to Do-bong on the three main peaks of the mountain. Those in their 20s and 30s who used Tranggle used mountain trails actively, showing that their preferred hiking sections can be divided by mountain.
To look into the pattern of mountain hikes in the metropolitan area in a compressed manner, the regional range was reduced to Seoul, where users accounted for more than 50% of the population. In addition, the forest area and research data by gu in Seoul were classified by dividing into All (all classifications), Cycling, Walking, and Hiking, and the number of usages for each classification in Seoul in 2019 and 2020 were counted (Table 2). The results of Spearman correlation analysis conducted with the counted data showed high correlations such as in 2019, All (0.8, p < .001), Walking (0.69, p < .001), and Hiking (0.81, p < .001), and in 2020, All (0.76, p < .001), Walking (0.57, p < . 01), and Hiking (0.76, p < . 001) (Table 2). It can be considered that the larger the forest area of a gu, the more forest usages (All), Walking, and Hiking are done in the district. This is in line with the area of urban forests (Park et al., 2008), which was mentioned as a factor to increase the frequency of forest visits in previous studies. However, in 2020, the Spearman correlation coefficient declined compared to 2019, despite the fact that the larger the forest area in a gu, the higher the frequency of usage in All, Hiking and Walking. In Seoul, there are eight Seoul Dulle-gil (walking trail) courses that connect the outskirts of Seoul, which were among the top 13 hiking trails with the highest frequency of visits by hikers in their 20s and 30s in the metropolitan area. In addition, the top 5 mountains in the metropolitan area with the highest number of visits compared to 2019 were A-cha, Gwan-ak, Gwang-gyo, In-wang, and Bul-am in descending order; A-cha, Bul-am, and Gwang-gyo are easily accessible on foot, and Buk-han and Gwan-ak are also highly accessible as those mountain trails are well connected within the city (Beagle, 2020). Based on these data, it can be considered that hikers in their 20s and 30s using Tranggle in 2020 still had a high number of visits to a ŌĆ£guŌĆØ (district) with a large forest area, but they more frequently used forest recreation areas with convenient transportation or easy access to the mountain within the city center. In addition, after the COVID-19 outbreak, it has been observed that peopleŌĆÖs trips to nearby areas increased, making them a single tourist zone, even if the administrative district (metropolitan city, or province) to which their residential area belonged was different from that of a desired destination (Korea Tourism Organization, 2021a). Considering the above results, the comprehensive analysis of hiking regions can be summarized as follows: during the COVID-19 pandemic, the hiking tendency of those in their 20s and 30s using Tranggle was still high in terms of demand for a large forest area, but its influence was lower than in 2019; and the accessibility to and convenience of using the mountains within their living area were regarded as important. Furthermore, it was found that three of the top 5 mountains with increased frequency of visits in 2020, including A-cha, Gwan-ak, and In-wang, are located in downtown Seoul, or have convenient public transportation connecting them to the city center. It is thought that not only hiking but also commercial areas around such mountains were considered and combined with tourism.
Analysis of temporal factors
The total number of accumulated data on mountain hikes by users in their 20s and 30s in the metropolitan area by year was a total of 337,504, such as 142,806 in 2019 and 194,698 in 2020, showing an increase of 1.36 times in 2020 compared to in 2019. The hiking pattern was analyzed by dividing the temporal factors by month, day of the week, and time of day based on the year.
To classify each month according to the time of sunset, it was divided into Winter season (November-March), Summer season (April-October), and All (12 months), and the high or low usage for each classified period was determined as the mean. Comparing the two years, in 2020, the mean was lowered due to data collected only until the beginning of December, so the number of usages in February appeared to be higher than the mean in the Winter season (Table 3). Spring and autumn showed high frequency of usage, which included months with higher number of usages than the mean for Winter season, Summer season, or All.
Mountain hikes are greatly influenced by the weather due to the nature of outdoor activities. In particular, in 2020, abnormal weather caused by the climate crisis occurred frequently along with COVID-19 (Korea Meteorological Administration, 2021). It is necessary to look at the monthly hikes in 2020 in consideration of the weather characteristics. The winter of 2020 (December 2019-February 2020) was warm nationwide, especially in January, with the warmest temperatures since 1973. In addition, since 1973, the average temperature in spring has severely fluctuated in March (top 2), April (top 44), and May (top 14), but the number of days with yellow dust in spring was 1.0 days, which was less than the normal year (5.4 days). (Korea Meteorological Administration, 2020a). Weather characteristics such as warm temperature and pleasant atmosphere seem to be one of the factors that increased mountain hikes in winter and spring. After that, the number of usages decreased due to frequent rain that fell once every 3 days in May and the heatwave in early June; but the number of usages in June was maintained in July rather than decreasing, due to the lower temperature in July than in June. After mid-August, their mountain hikes seems to have decreased significantly due to heatwaves and tropical nights (Korea Meteorological Administration, 2020a; Korea Meteorological Administration, 2020b). The difference between 2019 and 2020 in the time of decrease in mountain hikes in summer and that of increase in hikes in autumn appears to have resulted from: the temperature fluctuations in summer, 2020, which were different from common years with heatwaves from the end of July to the mid-August; and delayed mountain hikes in autumn due to the longer rainy season that lasted about two months (Korea Meteorological Administration, 2020b).
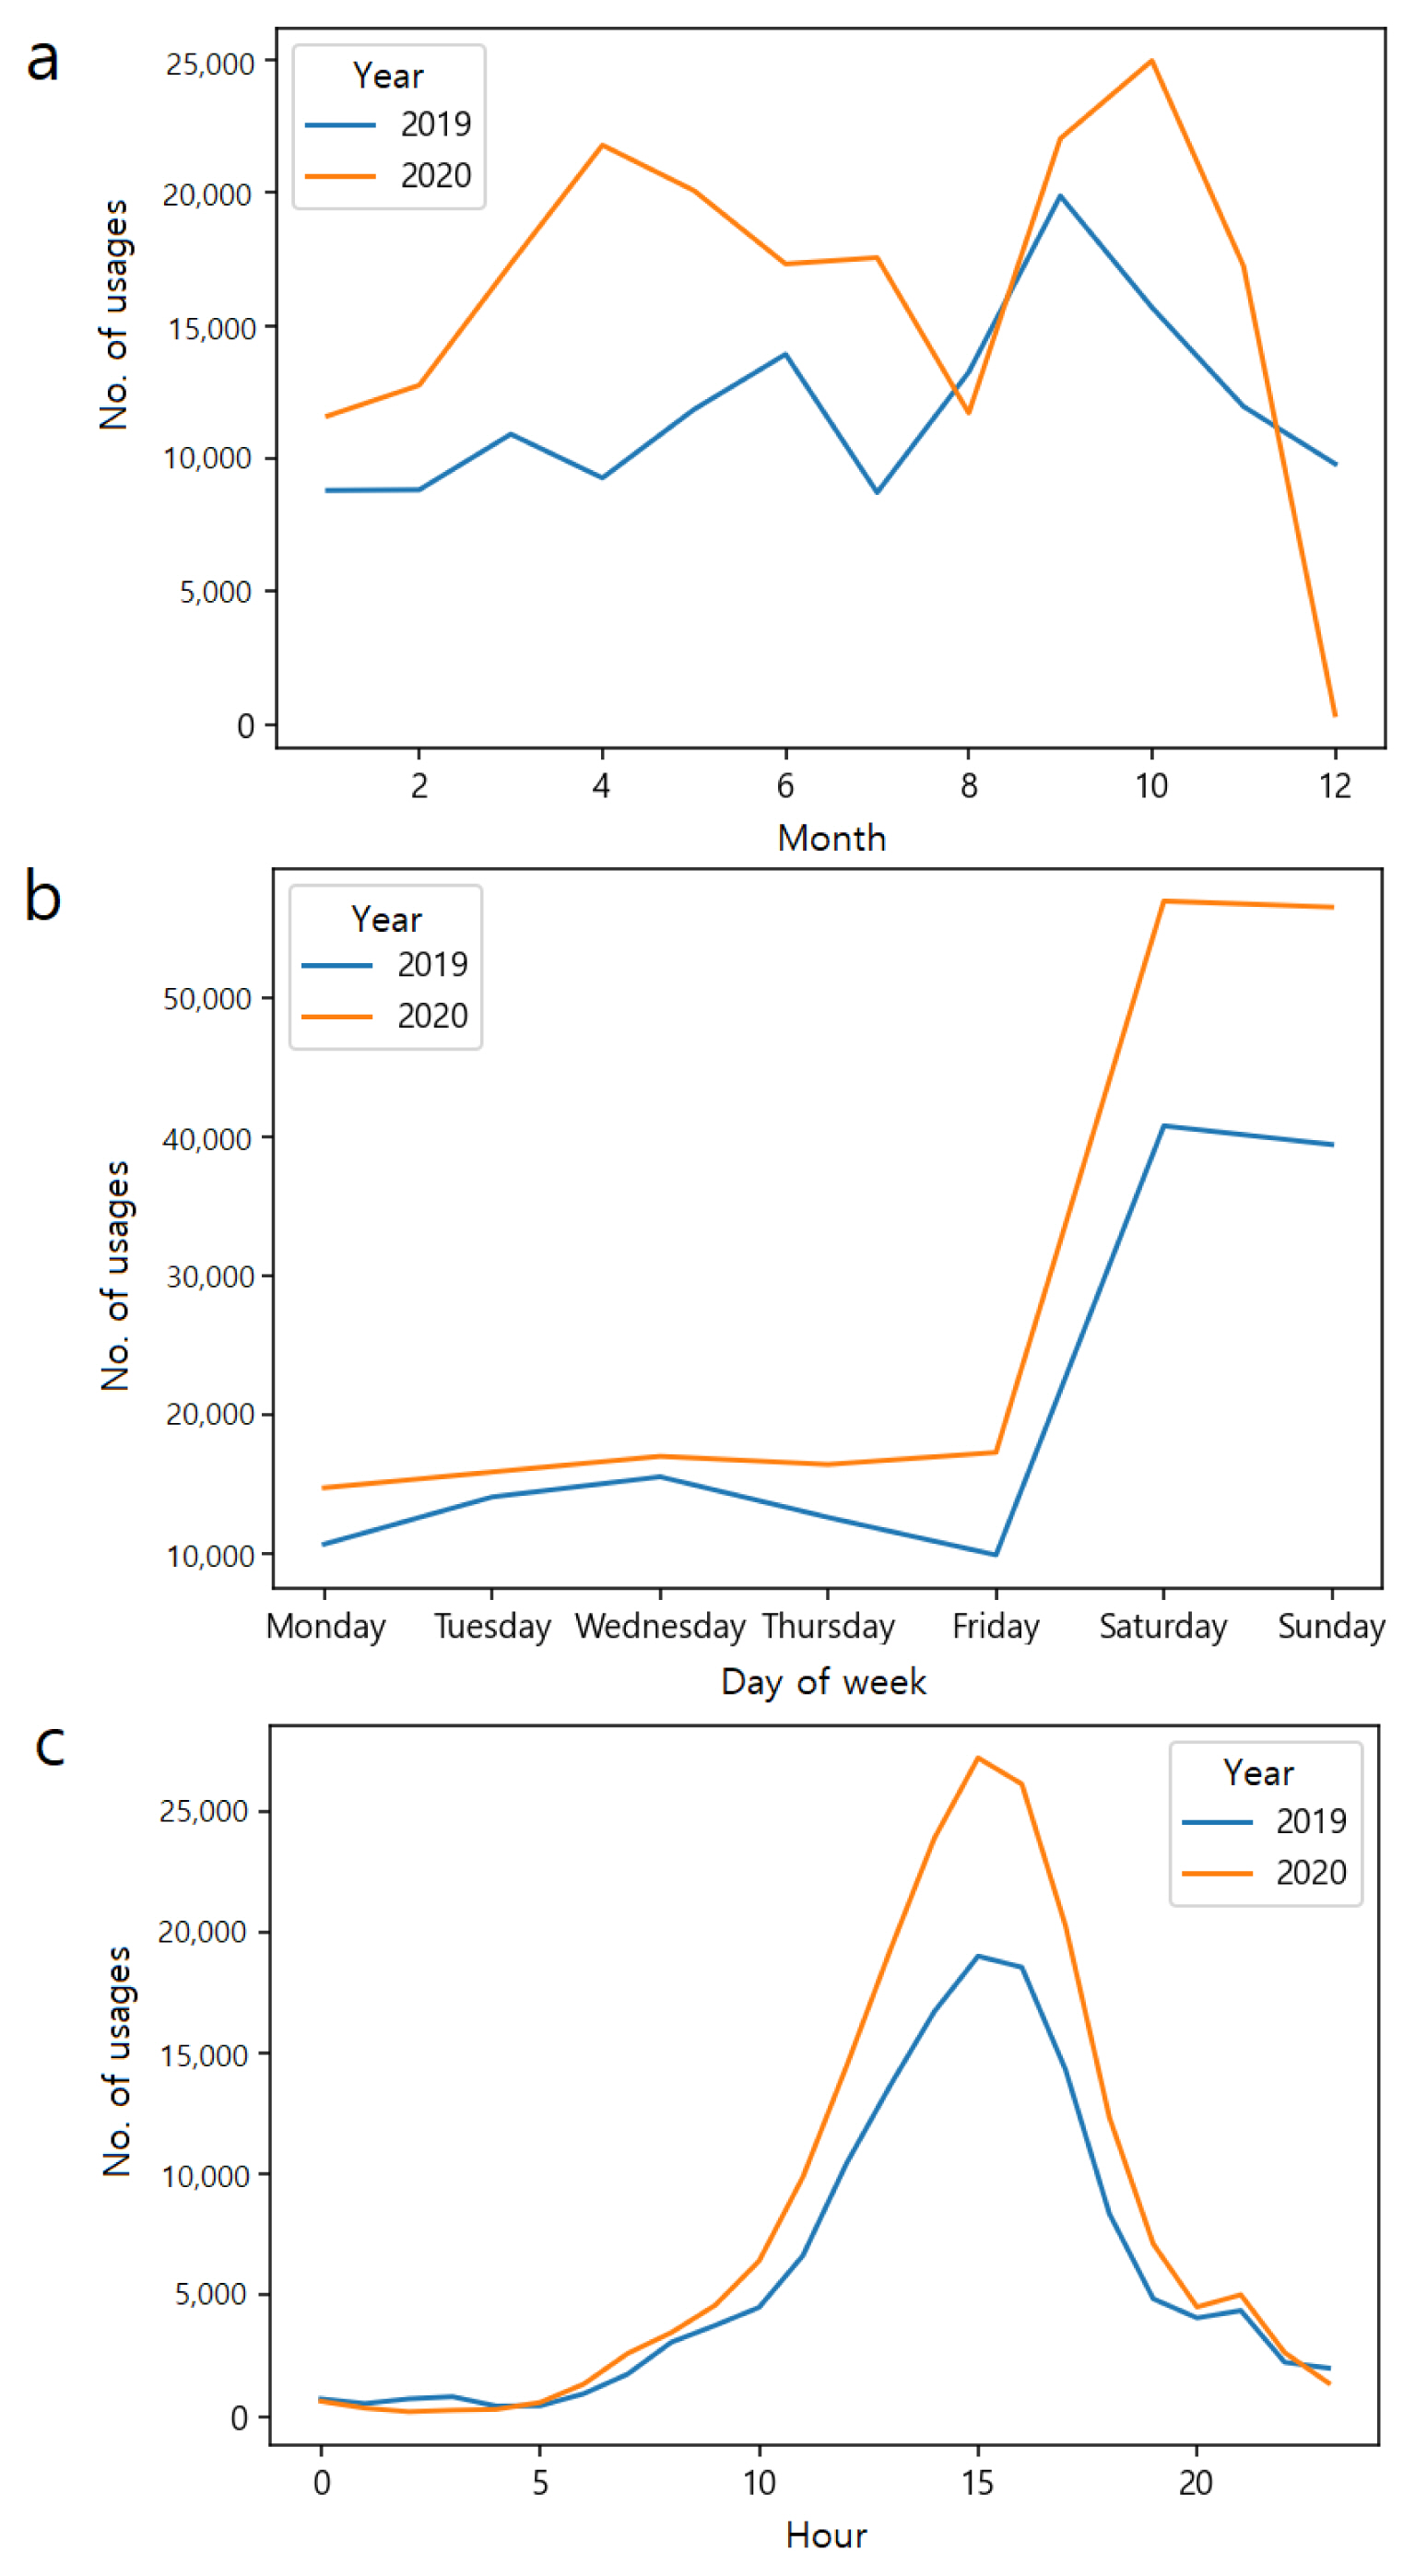
The days of the week were classified by dividing into Weekdays (Monday-Friday), Weekends (Saturday-Sunday), and All (Monday-Sunday) and the means were calculated. Comparing the two years, in both years the mountain usage was highest on the weekends and higher on Saturdays than Sundays. In addition, among Weekdays, the days regarding which the number of usages was above the mean changed from Tuesday-Thursday to Wednesday-Friday (Table 4). Fig. 3b shows more clearly the difference between the two years in the number of usages on weekdays. In 2019, the slope of the graph was large due to the highest usage on Wednesday, but in 2020, the slope was modest due to the small difference in usage between weekdays. To interpret this result, it is necessary to refer to the decrease in the trip/travel of those in their 20s and 30s after the outbreak of COVID-19 based on mobile big data (Statistics Korea, 2020). It is considered that the decrease in the difference in mountain hikes between weekdays in the age group in 2020 was attributed to their increase in mountain hikes in nearby areas due to the reinforcement of quarantine rules, such as social distancing and refraining from private gatherings, despite their spare time increasing due to the spread of telecommuting and remote learning caused by the COVID-19 pandemic.
Usage by time of day was divided into Work time (9ŌĆō18 oŌĆÖclock), Night (19ŌĆō23 oŌĆÖclock), Early morning (0ŌĆō8 oŌĆÖclock), and All (24 hours). Comparing the two years, period of time with above the mean of Work time and All were 13ŌĆō17 oŌĆÖclock and 11ŌĆō18 oŌĆÖclock, respectively, which did not change in both years. However, the time of day with above the mean of the Early morning and Night advanced from 7 oŌĆÖclock to 6 oŌĆÖclock and from 21 oŌĆÖclock to 19 oŌĆÖclock, respectively (Table 5). And despite the increase in the number of data in 2020 by 1.36 times, the number of usages at 0ŌĆō4 oŌĆÖclock and 20ŌĆō24 oŌĆÖclock was similar or lower than that in 2019, indicating a decrease in usage. This change was also confirmed in the pattern of shopping time paid by credit cards after the COVID-19 outbreak. Shinhan CardŌĆÖs Big Data Center reported that the percentage of 10ŌĆō13 oŌĆÖclock among usersŌĆÖ shopping time in large-sized supermarkets on weekends increased by 3% compared to 2019, showing that they seemed to avoid using them during times of big crowds. Pointing out that the proportion of evening hours among the hours of use of convenience stores increased, and related words mentioned on social media such as ŌĆ£homeŌĆØ, ŌĆ£beerŌĆØ, and ŌĆ£supperŌĆØ were ranked at the top, it also reported that the time of returning home and having meals advanced due to the atmosphere of refraining from private gatherings as much as possible (Shinhan Card, 2021). It appeared that such considerations and influences affected mountain usage for hikes, so their use early in the morning when there were few people on the mountains increased, and the usage at night decreased due to earlier time of returning home.
Analysis of activity types and mountains
Looking at the top 3 activities of users in their 20s and 30s, the rate of use for Hiking and Walking was still high, and Cycling increased (Table 6).
Of all the types of activities, comparing the mountains with the highest increase in number of hikes compared to 2019, including A-cha, Gwan-ak, Gwang-gyo, In-wang, and Bul-am, and the hiking trails most mentioned in the social big data analysis by Seoul Tourism Organization (2020), In-wang and A-cha were both highly counted. In addition, after the COVID-19 outbreak, the top 3 mountains with high frequency of visits for the purpose of Hiking (2019: Buk-han, Gwan-ak, Do-bong, 2020: Gwan-ak, Buk-han, Do-bong), Walking (2019: Buk-han, A-cha, Bul-am, 2020: Buk-han, A-cha, Namhan-sansung), and Cycling (2019, 2020: A-cha, Sam-sung, Buk-han) did not change significantly (Table 7). However, the fact that there was a difference in the top 3 mountains with high frequency of visits between activity types shows that the preferred mountains may differ for each activity type. Mt. Buk-han is considered to be a mountain that covers a variety of activities as it was counted as the highest frequency of visits in all of Hiking, Walking, and Cycling. The reason why Mt. A-cha was counted as one of the top 3 mountains in Walking and Cycling seems to be that such activities can be performed smoothly due to its low altitude (287m). Such difference in the preference for mountains by activity type was reconfirmed in the following findings: when analyzing the words associated with SeoulŌĆÖs mountains and Dulle-gil courses on social media, those for Mt. Buk-han were related to mountain hikes focused on active hiking, such as each peak and hiking gear, while those for Mt Gwan-ak were related to lighter hikes, such as daily life, scenery, and rest (Seoul Metropolitan Government, 2018).
(Level-based) analysis of experience point
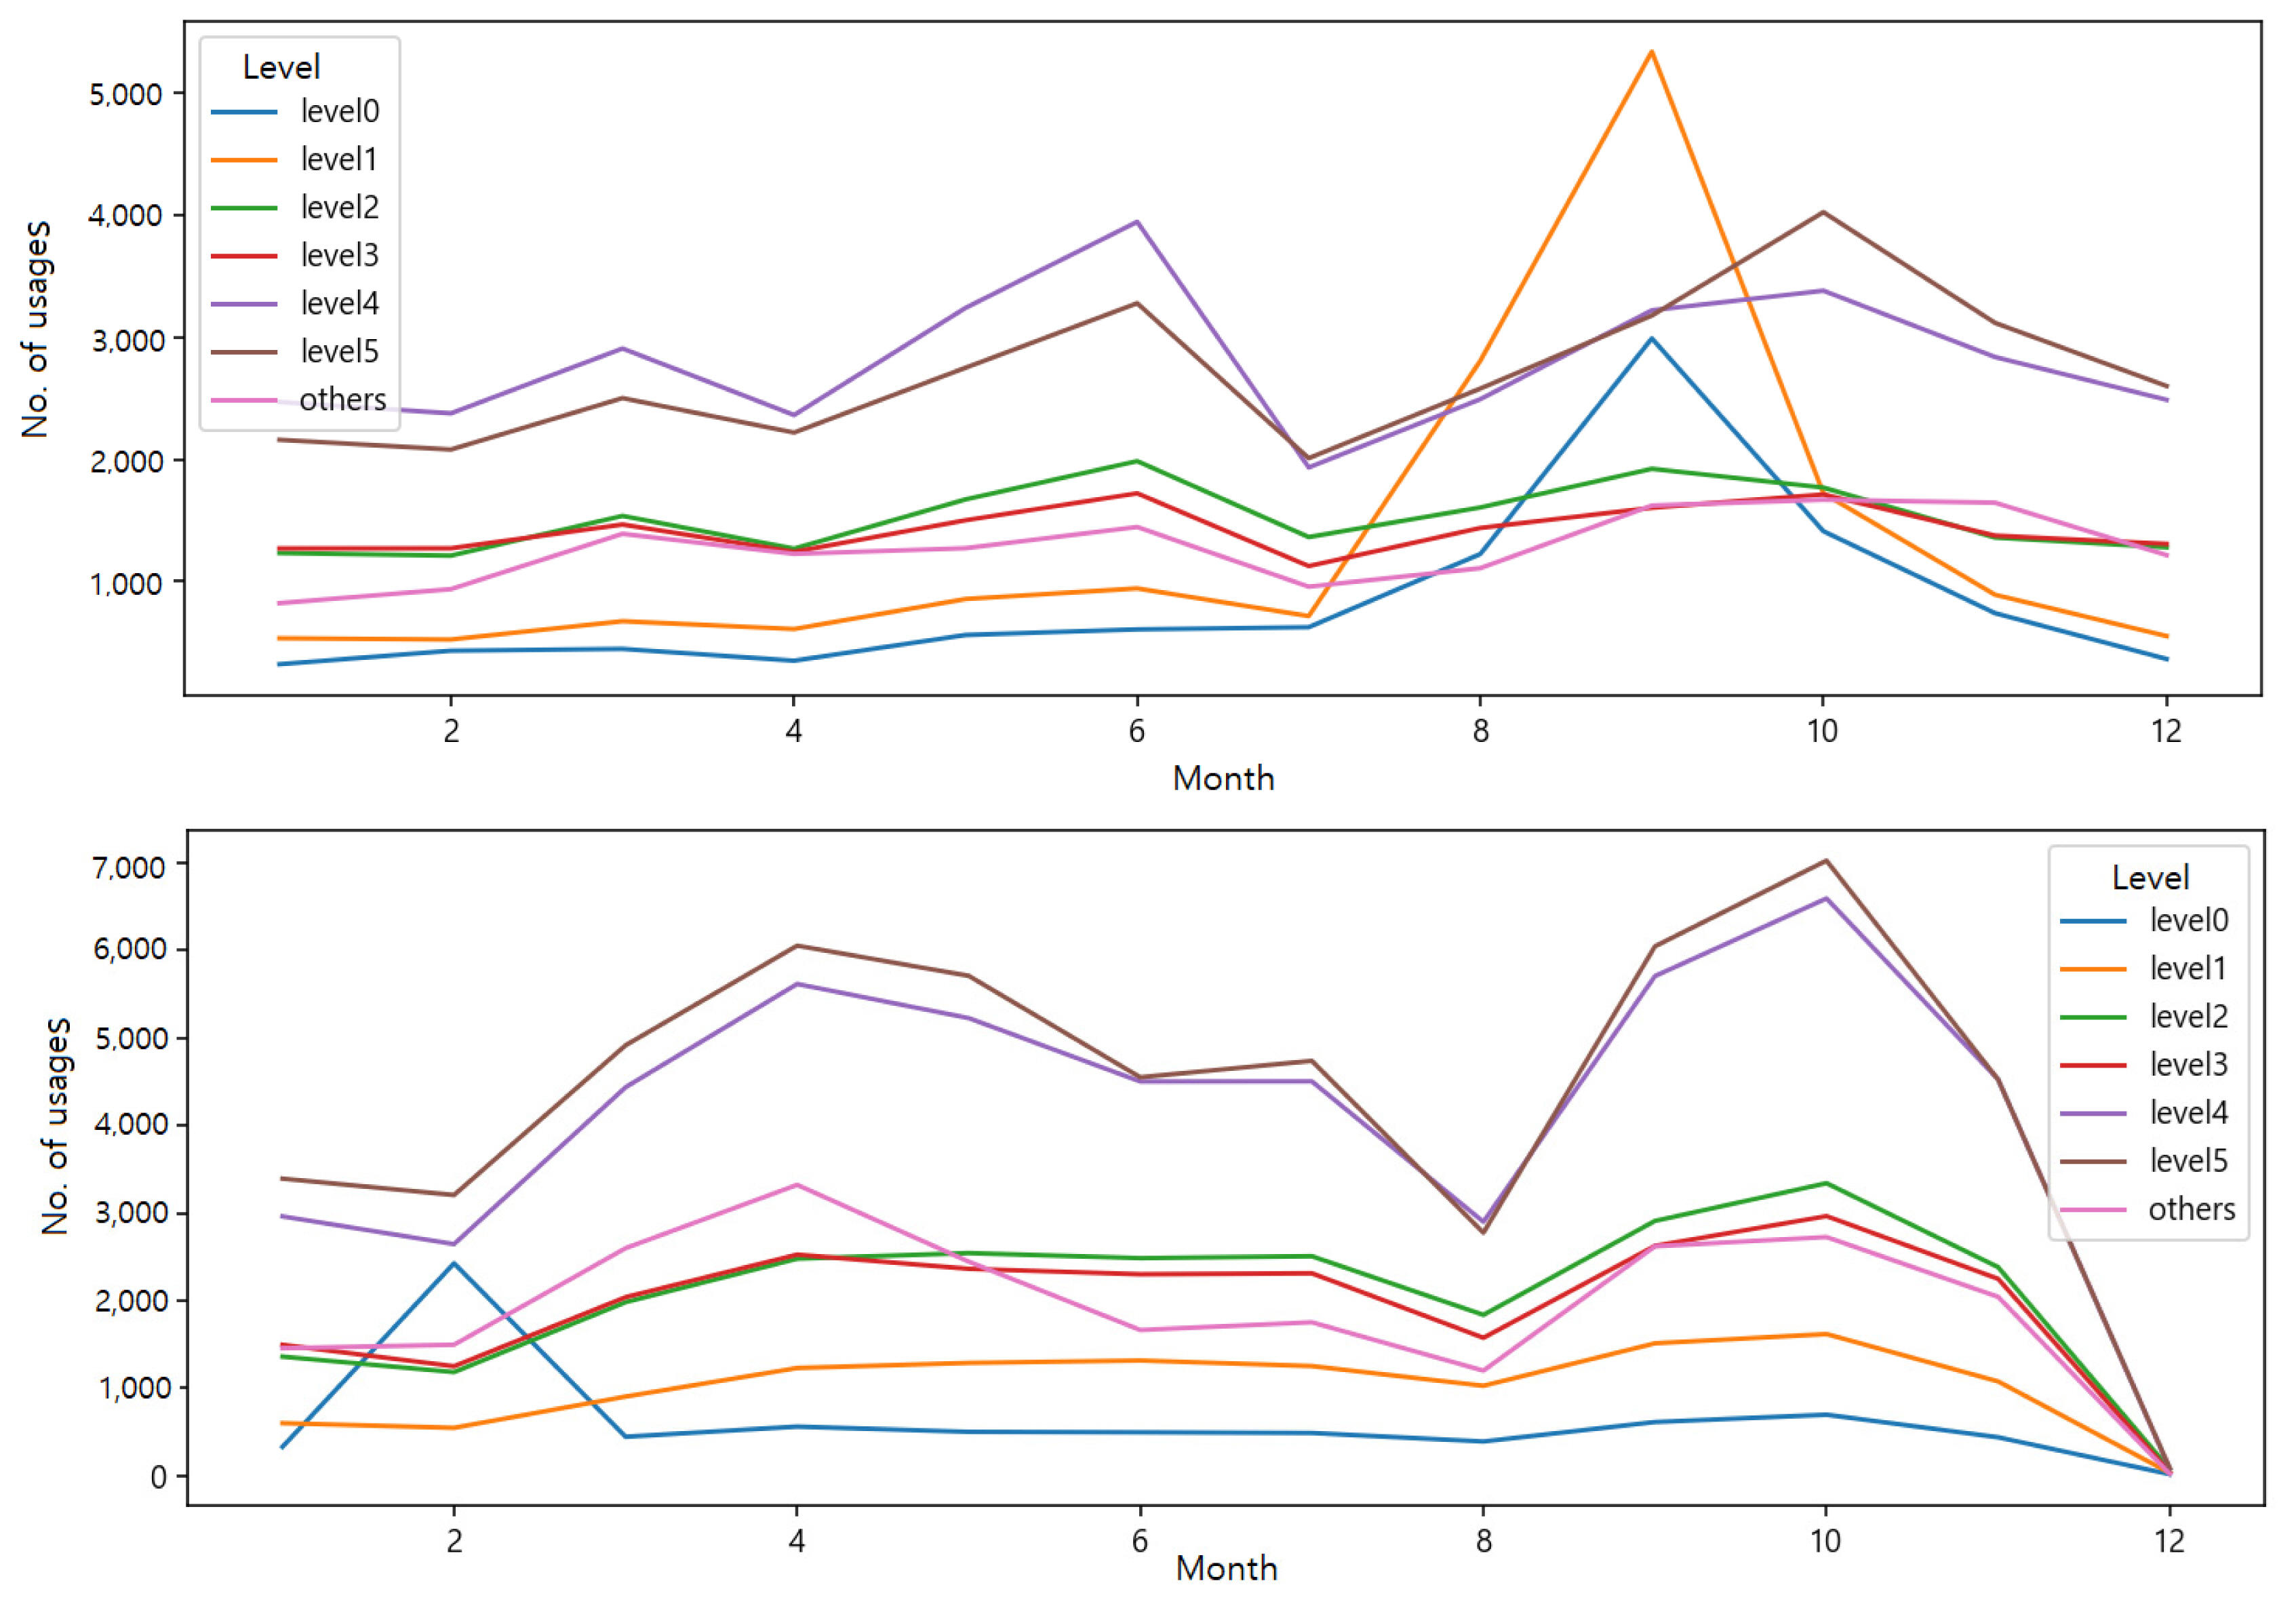
When converting the yearly experience points of users in their 20s and 30s who visited the mountains in the metropolitan area according to Tranggle level standard table, about 90% of them were distributed in the lower six Levels in both years (Table 8). Compared to 2019, the experience points of Level 0 and Level 1 decreased in 2020, and this appeared to result from even more new subscribers (Level 0) in 2019, although there were significant increases in them in August-September 2019 and February 2020. In addition, it is regarded that the proportion of Level 2-Others has increased as existing subscribersŌĆÖ steady mountain hikes (Fig. 4) increased their experience points.
Then, the mean of the number of usages of each Level was calculated for each year, and the mountains in which the number of usages for each Level was above the mean were classified (Table 8). The mountains where the number of usages for each Level was above the mean after the COVID-19 outbreak showed no significant change except for Mt. Bul-am. However, it was necessary to pay attention to the distribution of the Levels by mountain. Mt. Buk-han and Gwan-ak had relatively high altitude among the 13 mountains, but all Levels were evenly distributed in the two mountains. Mt. Do-bong, Su-rak, Cheong-gye and Gwang-gyo were mountains higher than the average altitude (538 m), and were frequently visited by Level 4-Others, and followed by Level 0 and Level 1. Mt. Bul-am and Sam-sung are slightly lower than the average altitude of the 13 mountains, and appear to have mid-altitude between high and low mountains. Mt. In-wang, A-cha, and Dae-mo were also slightly lower than the average altitude, and were frequently visited by Level 0-Level 3 (Table 8). This result shows that the difficulties in mountain hikes varies according to the altitude, leading to the characteristics of each mountain. Hikers in their 20s and 30s using Tranggle are considered to visit mountains selectively according to these mountain-specific characteristics and their own physical abilities.
Comparison of representative values for each characteristic of mountain hikes
Finally, since the median is appropriate as a representative value of the data with singular values, the characteristic of each mountain hike in both years was compared based on the median (Kim, 2009). The experience point was 834 m in 2019, and 916 m in 2020; the actual exercise distance was 8,698 m, and 9,180 m, respectively; the average speed was 3 Km/h, and 3 Km/h; the top speed was 7 Km/h, and 7 Km/h; the total time was 247 minutes, and 257 minutes; the travel time was 208 minutes, and 213 minutes; the break time was 28 minutes, and 33 minutes; and the highest altitude was 610 m, and 628 m. Excluding speed, the medians of all characteristics increased compared to in 2019 (Table 9). According to the analysis of mountain hiking activities in those in their 20s and 30s based on BeagleŌĆÖs Tranggle Big Data, the average hiking time was 4ŌĆō5 hours, the average hiking distance was 6.62 km (3ŌĆō4 km one way), and the average number of hikes per month was 0.6. It was reported that the characteristics of mountain hikes of young people in their 20s and 30s were different from those of middle-aged people (Beagle, 2020). Although the number of data increased by 1.36 times, the representative values of the exercise characteristics did not increase significantly. The rest of the items were similar to those in 2019, except that the experience point increased by 1.1 times and the break time increased by 1.18 times (Table 9).
Jang et al. (2019) classified 0ŌĆō1 m/s as stopping walking and staying, 1.0 to 1.5 m/s as normal walking, and 1.5 m/s or more as fast walking by considering the topographical characteristics of mountain areas. For those in their 20s and 30s using Tranggle, as the average and maximum speed were 0.83 m/s and 1.94 m/s, respectively, it is considered that they alternated between normal walking and fast walking.
Yoo et al. (2013) found that the rate of hikers spending longer than 3 hours was 73.2% for Mt. Buk-han, and 64.4% for Mt. Gwan-ak. Yoo et al. (2004) reported that the amount of time spent in an urban park-based urban forest in the city center was about 1ŌĆō2 hours, and that in an urban forest based on natural ecology outside the city was about 2ŌĆō4 hours. According to Lee et al. (2009), 48.1% of visitors to Mt. Buk-han on weekdays and 64.8% of visitors on weekends stayed for more than 2 hours. It is considered that the hiking time of those in the 20s and 30s using Tranggle was similar to or slightly more than that of all ages.
Conclusion
It is true that past cases are important, but it is becoming increasingly important to accurately understand what is happening and to anticipate and respond appropriately to the upcoming future (National Institute of Forest Science, 2020). This study conducted an exploratory data analysis (EDA) of mountain hiking data for those in their 20s and 30s on the top 13 mountains with the highest frequency of visits (usages) in the metropolitan area, using the 2019ŌĆō2020 data accumulated through a workout app (Tranggle), and comparatively analyzed the characteristic patterns of their mountain hikes before the COVID-19 outbreak (2019) and after (2020).
The top 13 mountains with the highest frequency of visits in the metropolitan area were located in the northern and southern outskirts of Seoul. In the limited area of the metropolitan area, the number of data in 2020 increased 1.36 times compared to that in 2019, indicating an increase in short-distance mountain hikes after the COVID-19 outbreak. When analyzed by day of the week, the mountain usage on weekends (Saturday> Sun) was still the highest, and the usage on weekdays became similar between the days of the week as the difference in the usage between the days of the week was smaller in 2020 compared to in 2019. As a result of the time of use analysis, there was no difference in usages for Work hours (9ŌĆō18 oŌĆÖclock) and All (24 hours) between both years. However, except for Work hours, in 2020, usages early in the morning increased and those at night decreased. In the case of classification, there was no significant change between the two years in the top 3 mountains frequently visited for each activity. There was no significant change in the Levels (experience point) with a frequency of visits above the mean for each mountain, except for Mt Bul-am. For the exercise characteristics, experience point increased by 1.1 times in 2020 compared to in 2019, and the representative values was similar between the two years, except for the 1.18 times increase in break time.
TranggleŌĆÖs new subscribers in their 20s and 30s in the metropolitan area (Level 0) increased significantly in August-October 2019 and February 2020, and the number of new subscribers was higher in 2019 than in 2020. However, as a result of the Korea Forest ServiceŌĆÖs survey of the impact of the COVID-19 pandemic on forest, forestry, and mountain villages in South Korea, targeting citizens and experts, they predicted that after the COVID-19 pandemic, the function and role of forests in our daily life would become more important. In particular, social interest and demand for the function of forests that are directly linked to health promotion and safe living are expected to increase (National Institute of Forest Science, 2020). It is required to actively take action to encourage the continued participation and active use of those in their 20s and 30s, who have increased interest in mountain hikes due to socio-economic factors caused by the COVID-19 pandemic, and routinized workouts. The management direction for this is suggested as follows.
1) In addition to the large number of natural and ecological resources (forest area), the forest recreation infrastructure such as hiking trails and dulle-gils, and the accessibility to and convenience of using a forest have a great influence on mountain hikes of those in their 20s and 30s in the daily life. It is important to induce mountain hikes by expanding forest recreation infrastructure and by linking between mountains so that people can easily use and access to the mountains not only in the mountains near the residential area, but also in the downtown and sub-central areas.
2) As a result of this study, the most significant changes due to COVID-19 pandemic included the increase in mountain hikes near the residential area or in the suburbs, usage evenly distributed between days of the week due to increased use on weekdays, increased usage early in the morning, and decreased usage at night. After the COVID-19 outbreak, forest recreation and healing activities have been changing to one-person-centered, low-density, short-distance usage that prioritizes safety. Therefore, there is a need for changes in the creation of forest welfare facilities and the provision of relevant services in the post-COVID-19 era (National Institute of Forest Science, 2020). To comply with the quarantine guidelines and prepare for possible safety accidents while mountain hikes, information on related services, supplementation and expansion of safety facilities, and flexible deployment of manpower are required.
3) According to the analysis results of classification and experience point, mountain users appeared to choose a mountain in consideration of the characteristics of mountains and their own physical abilities. In the case of Mt. Buk-han and Gwan-ak, many people visited the mountains because the environment was created where people of various characteristics could enjoy themselves without inconvenience. Considering the increase in mountain hikes within and near residential areas after the COVID-19 outbreak, it is necessary to supplement the programs and facilities of each mountain so that various levels of people adjacent to each mountain can enjoy it. In addition, it is required to characterize programs and facilities for each mountain in consideration of the characteristics of each mountain, such as altitude and difficulty of hiking trails, and activities that are mainly performed.
In this study, we examined how the hiking pattern of people in their 20s and 30s using Tranggle app has changed in crisis situations caused by infectious diseases such as COVID-19. As the situation regarding the COVID-19 pandemic became prolonged, the infectious disease disaster adversely affected peopleŌĆÖs mental health, with half of the people experiencing Corona Blue (Lee, 2020). However, even if vaccinations begin, the end of the COVID-19 pandemic is expected to take a long time. Accordingly mountain hikes are likely to at least maintain or further increase their current levels of increase, as long as the quarantine guidelines and social distancing are not lifted at the end of the COVID-19 pandemic. To actively cope with the increased demand for mountain hikes due to the prolonged COVID-19 pandemic, it is necessary to conduct further research in consideration of the sociodemographic characteristics more broadly.