Effects of Plant Spacing with Companion Plants on Growth and Fruit Quality of Cherry Tomatoes
Article information

Abstract
Background and objective
This study was conducted to identify various factors of plant spacing for the growth and fruit quality of cherry tomatoes and to contribute to urban agriculture by improving quality and providing appropriate fertilization methods.
Methods
French marigold (Tagetes patula, T), zinnia (Zinnia elegans, Z), spearmint (Mentha spicata, M), and basil (Ocimum basilicum, O), which have a combination effect with cherry tomatoes (Lycopersicon esculentum), were selected and tested by applying 10, 20, and 40 cm of plant spacing. Cherry tomatoes were planted in the middle of the furrow without companion plants, repeated three times for each experimental section. The growth survey included plant height, stem thickness, total number of fruits per plant, total fresh weight of fruits, fruit hardness, sugar content, and vitamin C. The inorganic constituents of plants were divided into roots, stems, and leaves.
Results
There were statistical differences in stem thickness and total number of fruits per plant. However, there were no statistical differences in plant height, total fresh weight of fruits, sugar content, fruit hardness, and vitamin C. Stem thickness was lower in M20, M40, O20, and O40 compared to the control group. The total number of fruits per plant was higher than the control group in only Z40. The inorganic constituents of cherry tomatoes showed statistical significance. After the experiment, the highest sodium content was found in Z40.
Conclusion
This study was conducted to provide convenience in soil and crop management by analyzing various factors to find out the effect of companion plants and plant spacing on the growth and fruit quality of cherry tomatoes. As a result, the most effective way to improve growth and quality of cherry tomatoes is to plant them with zinnia within 40 cm of plant spacing.
Introduction
As a new perception on agriculture, urban agriculture is accepted to meet the needs of the times such as stabilizing national sentiment, enjoying as a hobby, and ensuring safe food, which leads to active participation and interest in agriculture as well as various forms of evolution (Cho, 2012). As consumer lifestyles are gradually changing toward the direction that values health and environment, there has been a global increase in the consumption of organic agricultural products (Choi et al., 2012). Tringovska et al. (2015) uses companion plants as a planting method related to eco-friendly cultivation. Companion plant is a term that refers to a plant that helps each other or just the other when planted with other crops (Hong et al., 2021). Companion planting in crop cultivation is a special cultivation system that improves the ecological environment of soil and reduces damage from pests and diseases (Chang et al., 2017). In general, companion planting of two or more plants in crop production has various effects such as pest control, positive change in the surrounding microclimate, preservation of water and nutrients by adding organic matter and nitrogen in the soil, and suppression of weeds (Bomford, 2009; Gómez-Rodríguez et al., 2003). However, there are also disadvantages such as a decrease in the total number of fruits per plant due to competition over light, water, and nutrients (Borowy, 2012; Jedrszczyk and Poniedzialek, 2007; Lu et. al., 2000).
There was a study on the effect of companion plants discovering that it was effective to plant companion plants with cherry tomatoes together at 30 cm intervals in rooftop urban agriculture and that companion planting of cherry tomatoes and basil (Ocimum basilicum) had an effect on growth, physiology, and productivity (Ju et al., 2021). Lee et al. (2021) studied the effect of companion planting on the growth and quality of cherry tomatoes and discovered that companion planting generally had a more significant effect on the growth of cherry tomatoes compared to monoculture. There were also studies on plant spacing, proving the effect of nursery days and plant spacing on the quantity in two-stem cultivation of cherry tomatoes in which it is effective to keep the spacing of furrows at 100 cm and spacing in the row at 40cm (Chae, 2011). Although the subjects were not cherry tomatoes, there was also a study proving that fruit weight increased by plant spacing in growth and fruit characteristics by plant spacing and cultivation type of mini watermelons (Jeong et al., 2018). However, there was almost no research on how companion plants affect the growth of cherry tomatoes.
Accordingly, in addition to the previous study investigating the accompanied effect by companion plants, planting type, and planting ratio with cherry tomatoes (Lee et al., 2021), this study was conducted to identify factors through which companion planting affects the growth of cherry tomatoes by plant spacing of total 4 types of companion plants comprised of herbs and flowers such as basil, spearmint (Mentha spicata), French marigold (Tagetes patula), and zinnia (Zinnia elegans) that proved to be effective in studies by Tringovska et al. (2015) and Moon (2011). This will contribute to high yield, quality improvement, and active urban agriculture to increase satisfaction of gardening activities for urban residents.
Research Methods
Materials and methods
In this study, we formed 45 ridges in the size of 4 m× 1.2 m×0.5 m (width x length x height) on April 16, 2021 at the National Institute of Horticultural and Herbal Science located in Iseo-myeon, Wanju-gun, Jeollabuk-do (Figs. 1A, 1B).
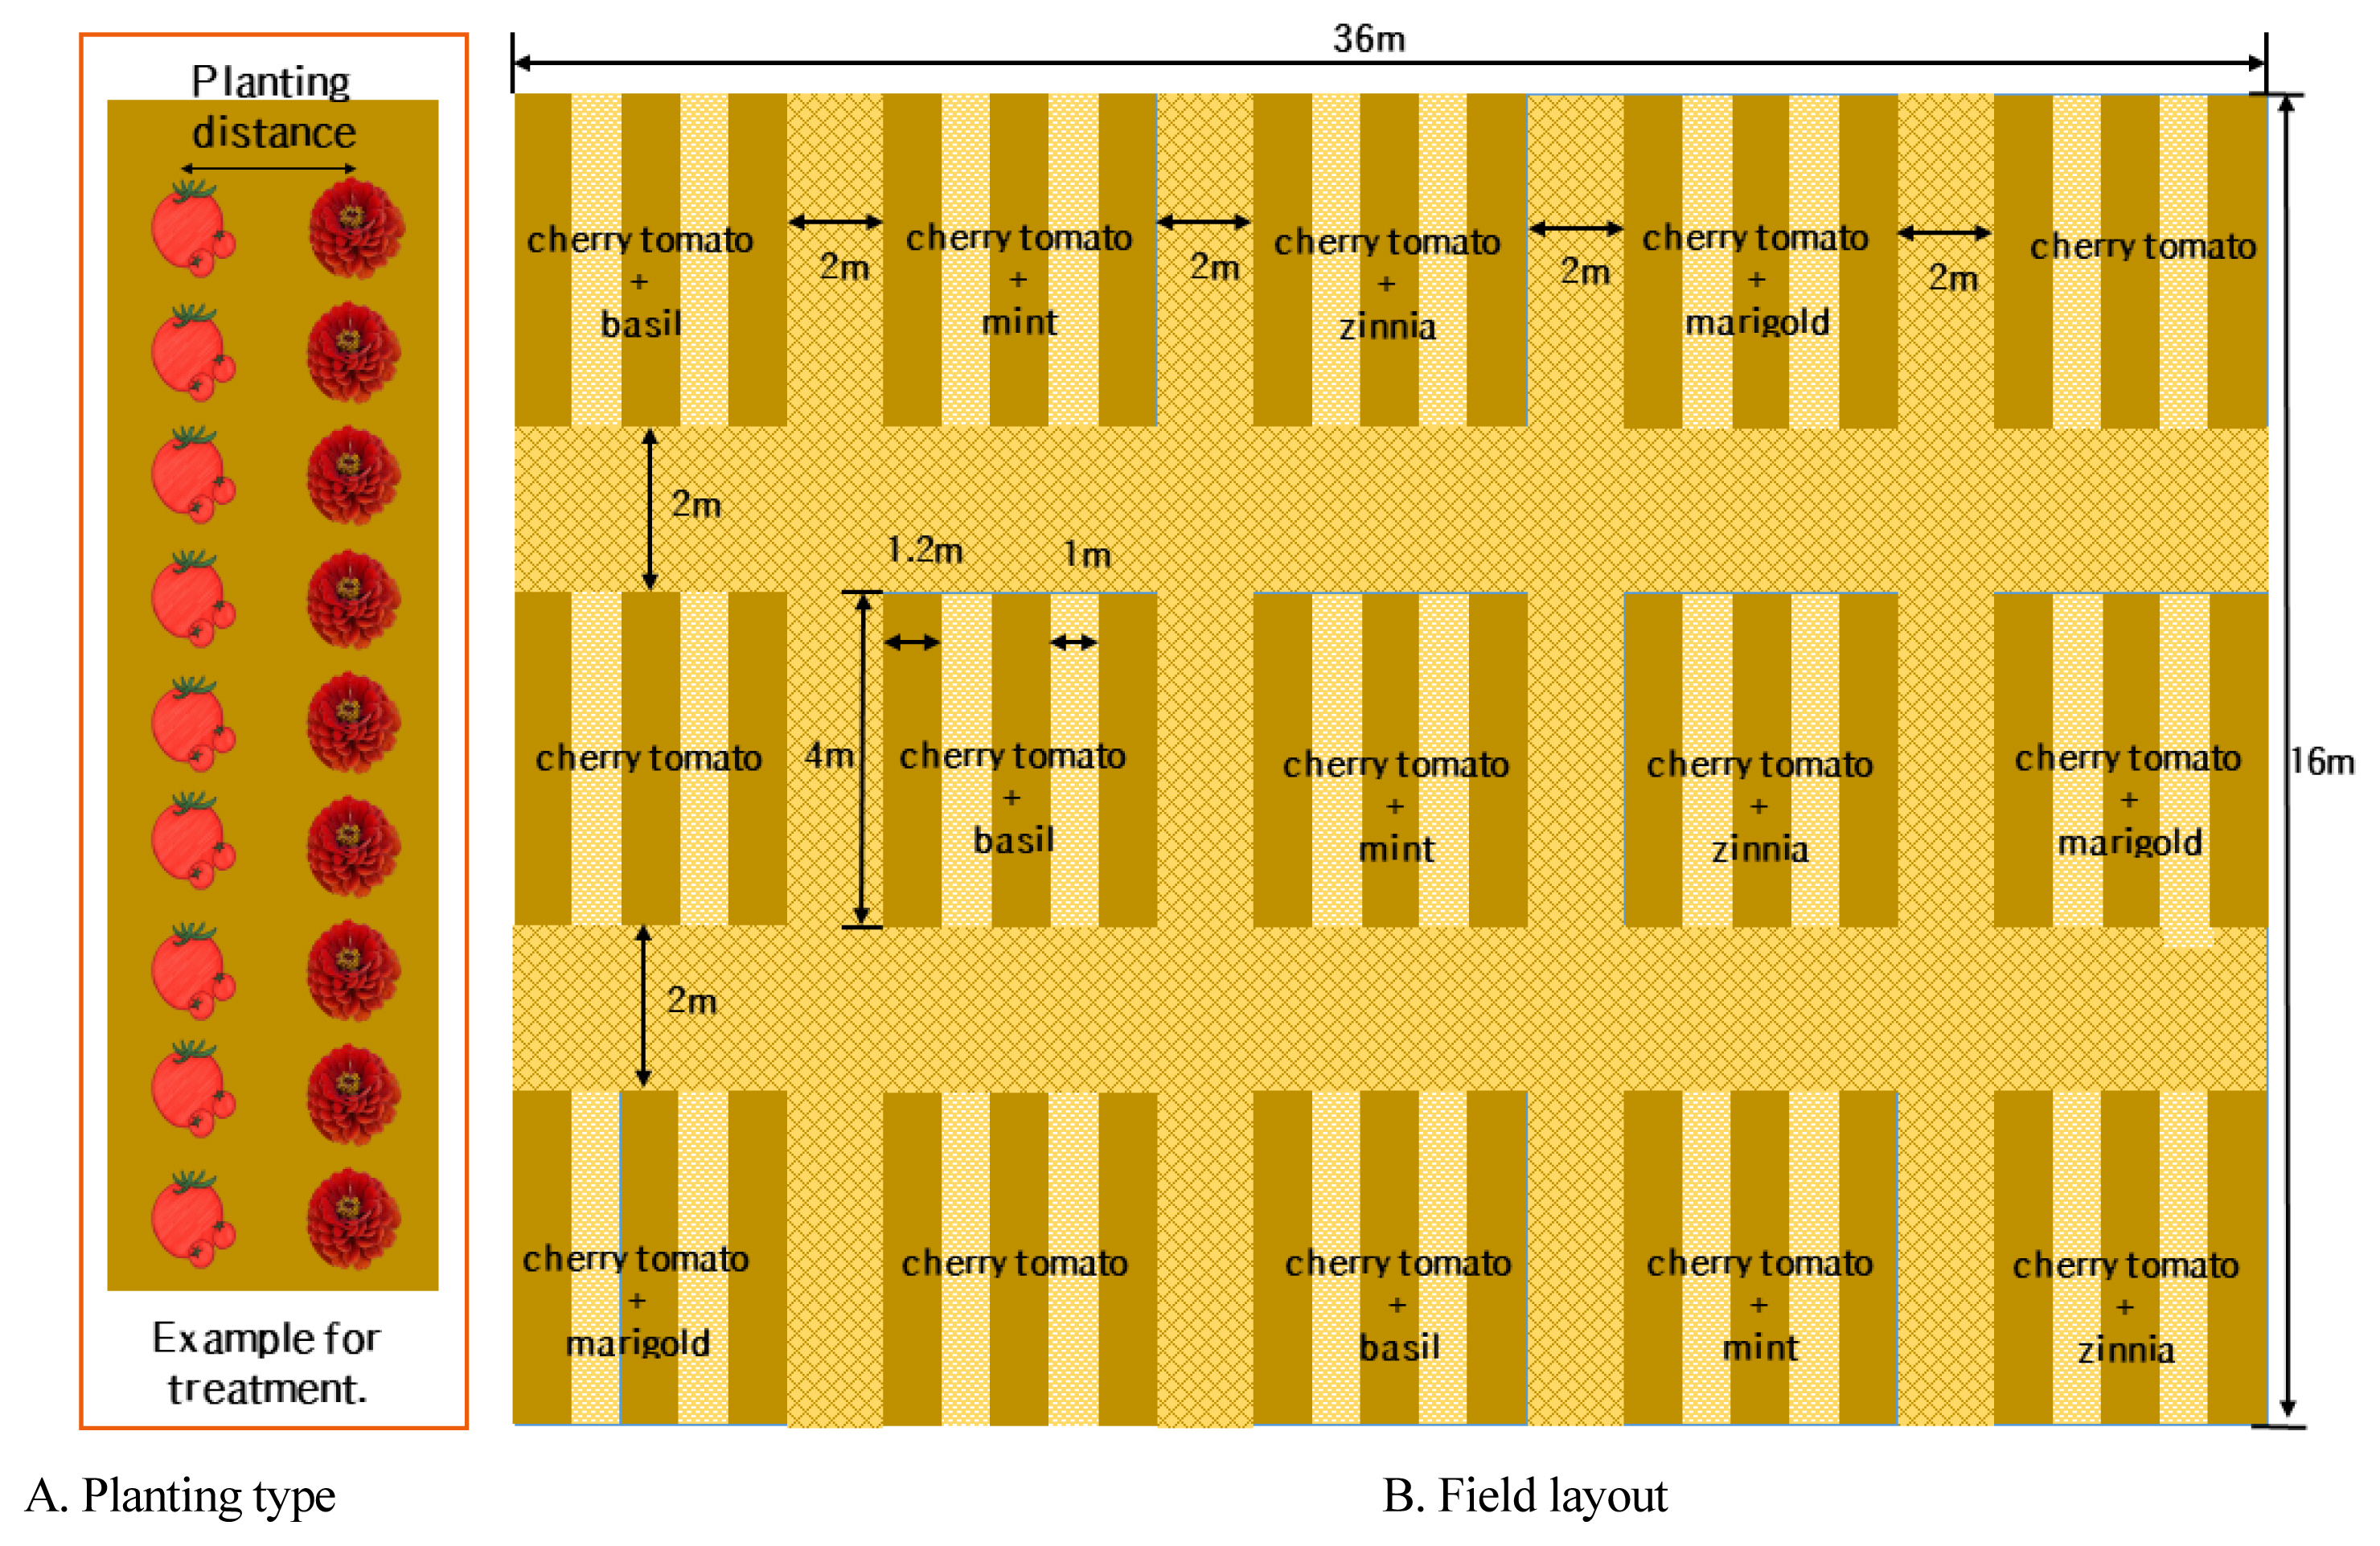
Experimental layout (A) and planting type (B) in this study.
The variety of cherry tomatoes (Lycopersicon esculentum) selected as the major crop was ‘TY Holiday’ that is resistant to tomato yellow leaf curl virus (TYLCV) and tomato spotted wilt virus (TSWV), have short internodes, and show excellent yield ability as plum tomatoes. We selected 4 types of companion plants such as spearmint (Mentha spicata ‘Spearmint’), basil (Ocimum basilicum ‘Sweet Basil’), French marigold (Tagetes patula ‘Boy Yellow’), and zinnia (Zinnia elegans ‘Lilli Put Mix’).
We sowed seeds of cherry tomatoes and companion plants on February 10, 2021 using a horticultural substrate (Substrate No. 2 Baroker, Seoul Bio, Eumseong, Chungbuk, Korea) and raised them in a greenhouse in the National Institute of Horticultural and Herbal Science. When the first flower bloomed in the first flower cluster on May 25, 2021, companion plants were planted at the same time so that they will maintain a similar size as the cherry tomatoes (shading screen, pruning, etc.). The growth state of cherry tomatoes when planted was plant height 13.8 cm, 8 leaves, and stem thickness 3.77 mm. The plant spacing between cherry tomatoes was the row spacing of 50 cm (Fig. 1A). The plant spacing between companion plants and cherry tomatoes was 10 cm, 20 cm, and 40 cm (9 major crops, 9 companion plants), and we did not plant companion plants in the control group and planted 9 major crops in the middle of the ridge, repeating 3 times in each experimental group (Table 1).

Companion plants and planting distance by treatment name in this study
Survey and analysis method
We examined plant height, stem thickness, total number of fruits, weight, fruit hardness, sugar content, and vitamin C for a total of 8 times, once every two weeks from the initial survey on May 25 to September 2, 2021. The growth and yield of crops were investigated in accordance with the Rural Development Administration’s agricultural test standards (RDA, 2012). Fruit hardness was measured with a 10mm diameter using AMETEK Universal Test Machines and NEXYGEN PLUS3 (AMETEK Inc., Berwyn, PA, USA) after sample collection. Sugar content was measured with a refractive sugar meter (ATAGO PAL-1, ATAGO, Tokyo, Japan) after sampling and squeezing, provided in °Brix unit. Vitamin C was quantitatively analyzed using high-performance liquid chromatography (HPLC) (Agilent Technologies 1260 Infinity II, Agilent Technologies, Santa Clara, CA, USA). MFDS, 2000), and the value was obtained in accordance with the Ministry of Food and Drug Safety’s test and analysis standards (MFDS, 2000).
Samples for the analysis of inorganic constituents in plants were washed with water for each experimental group after harvest, divided into root, stem, and leaf, and dried at 70°C. Then, we pulverized them to 100 mesh using a grinder and collected samples with a wet decomposition method of nitric acid (HNO3) and perchloric acid through plant preprocessing, after which we used ICP (Integra XM2, GBC Scientific Equipment, Australia) to conduct analysis in accordance with the plant analysis method of soil chemical analysis (NIAST, 2000). To understand the relationship between crop growth and absorption of inorganic soil constituents according to the plant spacing between cherry tomatoes and companion plants, we analyzed the soil characteristics before planting and 100 days after planting according to the soil chemical analysis of Rural Development Administration (RDA, 2010). The results were statistically analyzed using IBM SPSS statistics Ver. 25 program, obtaining the means and standard deviations. We examined the correlation between dependent variables to test the difference in variables among factors, after which we conducted multivariate analysis of variance (MANOVA) for growth and fruit characteristics. Plant spacing from companion plants was determined by conducting a multivariate test on each factor and testing the significance at the 95% confidence level (p < .05) through Duncan’s multiple range test.
Results and Discussion
Changes in growth and fruit characteristics of cherry tomatoes
The growth of cherry tomatoes was examined using growth (plant height, stem thickness, total number of fruits per plant, total fresh weight of fruits) and fruit characteristics (sugar content, fruit hardness, vitamin C). As a result of examining the growth in each experimental group, the plant height of cherry tomatoes ranged from 193.3 to 214.9 cm. The result of the post-hoc test showed there was no statistical difference between the experimental groups and the control group. Stem thickness ranged from 9.64 to 13.20mm, and the result of the post-hoc test showed that it was lower than the control group in M20, M40, O20, and O40, while the rest showed a similar level as the control group. The p-value was p < .001, showing a statistically significant difference (Table 2).
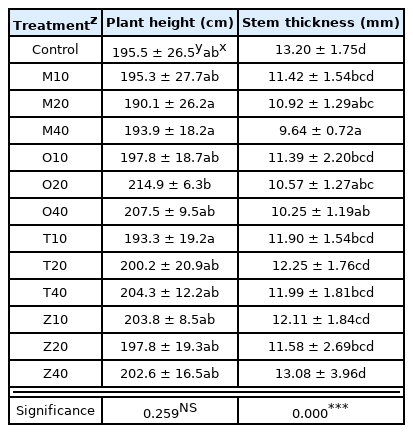
Plant height and stem thickness of cherry tomatoes as influenced by four companion plants with different planting distance at 100 days after planting May 25th, 2021, until September 2
MANOVA was conducted to examine the growth of cherry tomatoes, type of companion plants, plant spacing with companion plants, and interaction effect (Table 3). Plant height and stem thickness showed a statistically significant difference in types of companion plants. There was no statistical difference in plant height and stem thickness in plant spacing. There was no statistical difference in plant height and stem thickness in the interaction effect of companion plants and plant spacing.

Interaction effect between companion plant and planting distance at plant height and stem thickness
In sum, companion plants had an effect on plant growth, but there was no interaction effect with plant spacing. This is similar to the result by Lee et al. (2021) proving that companion planting affected the growth of cherry tomatoes.
The total number of fruits per plant of cherry tomatoes ranged from 142 to 195, and the result of the post-hoc test showed that the total number of fruits per plant was greater in Z40 than the control group. As a result of ANOVA, the p-value was p < .05, showing a statistically significant difference (Table 4). Total fresh weight of fruits ranged from 1.2 to 2.0 kg, and the result of the post-hoc test showed that the p-value was p < .05, showing a statistically significant difference. Sugar content ranged from 6.2 to 9.0° Bx, which was higher than the standard sugar content when fully ripe at 5.8° Bx (RDA, 2008) and similar to the result by Lee et al. (2021) at 7.0–8.1° Bx. The post-hoc test result also did not show a statistical difference. Fruit hardness was 1.81–2.51 kg/cm2, and the post-hoc test result also did not show a statistical difference.
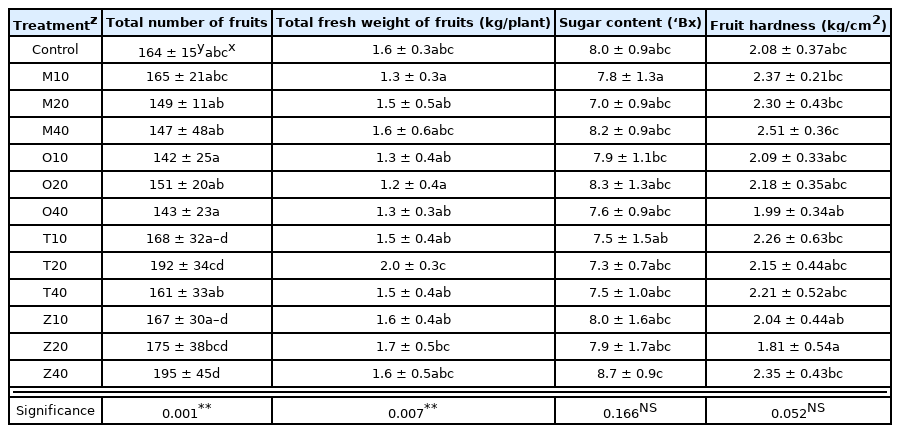
Fruit characteristics of cherry tomatoes as influenced by four companion plants with different planting distance
Table 5 shows the MANOVA results for the fruit growth of cherry tomatoes, type of companion plants, plant spacing with the companion plants, and interaction effect. There was a statistically significant difference in total number of fruits per plant, total fresh weight of fruits, and fruit hardness in the types of companion plants, but there was no difference in sugar content. Plant spacing and interaction effect did not show a statistical difference in all treatments.
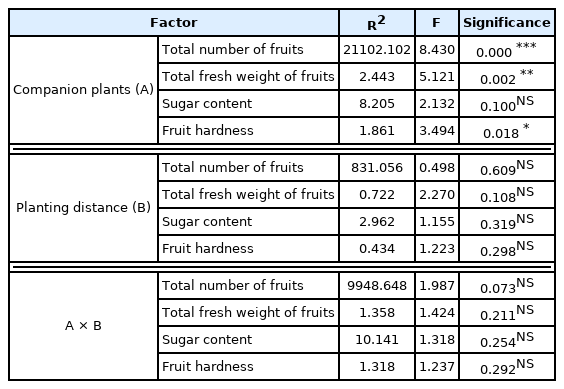
Interaction effect between companion plant and planting distance at total number of fruits, total fresh weight of fruit, sugar content and fruit hardness
In sum, companion plants had an effect on all except sugar content of fruits, but no interaction effect with plant spacing. However, unlike total number of fruits per plant, total fresh weight of fruits, and fruit hardness without clear standards, sugar content of fruits was 6.2–9.0° Bx, which was higher than the standard sugar content when fully ripe at 5.8° Bx (RDA, 2008) and similar to the result by Lee et al. (2021) at 7.0–8.1° Bx.
Vitamin C after harvesting cherry tomatoes ranged from 46.29 to 71.02 mg, which was higher in all experimental groups than 24.0 mg when fully ripe according to the Ministry of Food and Drug Safety’s standards, and much higher than the standard by Lee (2020) claiming that the adequate vitamin C content is 15.59 mg. The result of the post-hoc test showed that there was an equal level in all, and ANOVA result showed that there was no statistical difference (Table 6).
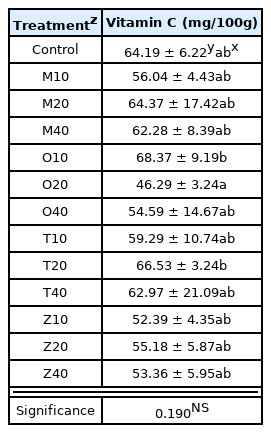
Vitamin C contained quantity of cherry tomatoes as influenced by four companion plants with different planting distance
There was no statistical difference in the MANOVA results to investigate the effect of vitamin C content of cherry tomatoes according to the type of companion plants, plant spacing with the companion plants, and interaction effect (Table 7).

Interaction effect between companion plant and planting distance at vitamin C
Change in mineral content of plants
Although the part used by humans is fruit, we examined the inorganic constituents of plants based on previous research proving that fruit weight and quantity of products increase when the nitrogen content in leaves is within the range of 3–3.8% (Lee et al., 1995). Although there were not many studies on companion plants and plant spacing, we analyzed macroelement content by harvesting plant leaves when flower clusters bloom as well as the change in the concentration of inorganic constituents in the supply, drainage, and plant body according to increased pinching in aquaculture of cherry tomatoes (Lee et al., 2017). As a result, since the concentration of various inorganic elements such as anions in the drainage was easily leached away, the concentration in the medium did not increase despite the increase in the concentration of the drainage, and in the end, it did not significantly affect the absorbed amount. As a result of comparatively analyzing inorganic constituents and functional ingredients of organically cultivated fruits and vegetables in distribution as well as fruits grown in conventional culture (Lee et al., 2017), contents of N, K, and P of conventional tomatoes were higher than organic tomatoes, and Na of organic tomatoes was also higher than conventional tomatoes.
After about 3 months of field planting, we harvested all the cherry tomatoes and analyzed the mineral content, and there were statistically significant results (Table 8). Nitrogen (N) is a component of chlorophyll, protein, and enzymes, and it was higher in all of leaves, roots, and stems compared to the standard content at 8.1 mg (RDA, 2005), in the order of roots > leaves > stems, and there was a difference from the part of nitrogen content in previous research (Lee et al., 2021). Compared to the control group, stems showed high content in all groups except M20 and O20, and highest in Z40. Leaves showed high or significant difference in all except O10, O40, T10, T20, and Z20, and highest in O20. Roots showed low content in M20, M40, T10, T40, and Z10, while the rest were high or similar, and highest in Z20. This is similar to the result by Lee (2005) stating that the biggest absorbed amount is found between 60 and 90 days after planting.

The content of inorganic elements in stem, leaf and root of cherry tomato plants as influenced by four companion plants with different planting distance
Potassium (K) is involved in photosynthesis and carbohydrate synthesis. Unlike previous research by Lee et al. (2021), the potassium content was high in the order of stems > roots > leaves, and was generally higher than the control group. Stems and roots showed higher content than the standard content at 16.4 mg, but leaves showed mostly low content. Stems showed lower content in Z10, Z20, and O40 compared to the control group, while the rest showed a significant difference or high content. Leaves showed high content in T40, M10, M20, M40, and O20, while the res were all low. Roots showed higher content than the control group in all. This was similar to the result by Papadopopoulos (1986) that when the nitrogen concentration in the soil increases in plant nutrient uptake, so does the nitrogen content in the plant, but the potassium content decreases.
Phosphorus (P) controlled by pH in soil was distributed mostly in the leaves, followed by roots > stems, showing a different result from the previous study by Lee et al. (2021). Stems showed higher content in all except Z10 compared to the control group, and leaves showed low content in T40 and Z10, while showing high content or significant difference in all others. Roots showed lower content in M20 and O10 compared to the control group, while the rest showed high content or significant difference. Moon and Yoo (2013) reported that absorbed phosphorus is distributed in the body in the form of organic phosphorus compounds or inorganic phosphate, and is involved in cell growth and proliferation. Compared to previous research (Lee et al., 2021), the P content was extremely high, thereby affecting the number and weight of fruits.
Calcium (Ca), which is widely distributed in the soil and has a low absorption rate of plants, is distributed most in the leaves, followed by stems > roots. Ca present in the soil was distributed less compared to the amount of calcium absorbed by plants, which was the same as conventional culture, and the absorptivity was highest in leaves as was in previous research (Lee et al., 2021). Magnesium (Mg) has severe antagonism with other cations and is mostly distributed in leaves with chlorophyll, followed by roots > stems. Leaves showed the highest content as did in previous research (Lee et al., 2021), and the content was much higher than the adequate standard (4.76 mg·kg−1), showing higher content or significant difference in all of stems, leaves, and roots compared to the control group. Increased soil pH leads to decreased mineral content in the plant. This is antagonism among cations in the absorption process as calcium and magnesium solubilized in soil increase (Hanan, 1998; Lindsay, 1979), and this was similarly found by Mengel and Kirkby (1987) and Marschner (1995) as well.
Sodium (Na) involved in the increase of the number of fruits was mostly distributed in roots as a beneficial element instead of an essential element, followed by leaves > stems, showing the same result as previous research (Lee et al., 2021). Stems showed lower content in O40 compared to the control group, while the rest showed high content or a significant difference. Leaves and roots showed a significant difference or high content. This may have effect as a substitute of potassium.
The results of the experiment showed that, compared to the control group with monoculture of only cherry tomatoes, the mineral content of cherry tomatoes planted with companion plants such as spearmint, basil, French marigold, and zinnia was significantly high in most cases except Ca in leaves and N in roots. This is similar to the difference in inorganic constituents found in previous research (Lee et al., 2021).
As a result of examining the f-statistic of Wilks’ lambda to test the effect among factors, there was a statistically significant difference in companion plants and plant spacing (p < .001). As a result of verifying the effect among individuals, Sig. of F = .000 < .001, thereby showing an interaction effect between companion plants and plant spacing (Table 9). Future studies must analyze inorganic constituents of fruits as well.

Mutual relation of individual factors on this study
Physicochemical change of soil
The cultivation period of crops is short in field soil, and various cropping systems such as succession planting and crop rotation are adopted, making it difficult to manage soil and use fertilizers suitable for the characteristics of each crop (RDA, 2020). Accordingly, in order to determine the reusability of arable soil, the types of companion plants (Fig. 2) and inorganic soil constituents (Fig. 3) according to plant spacing were identified before and after planting of crops.
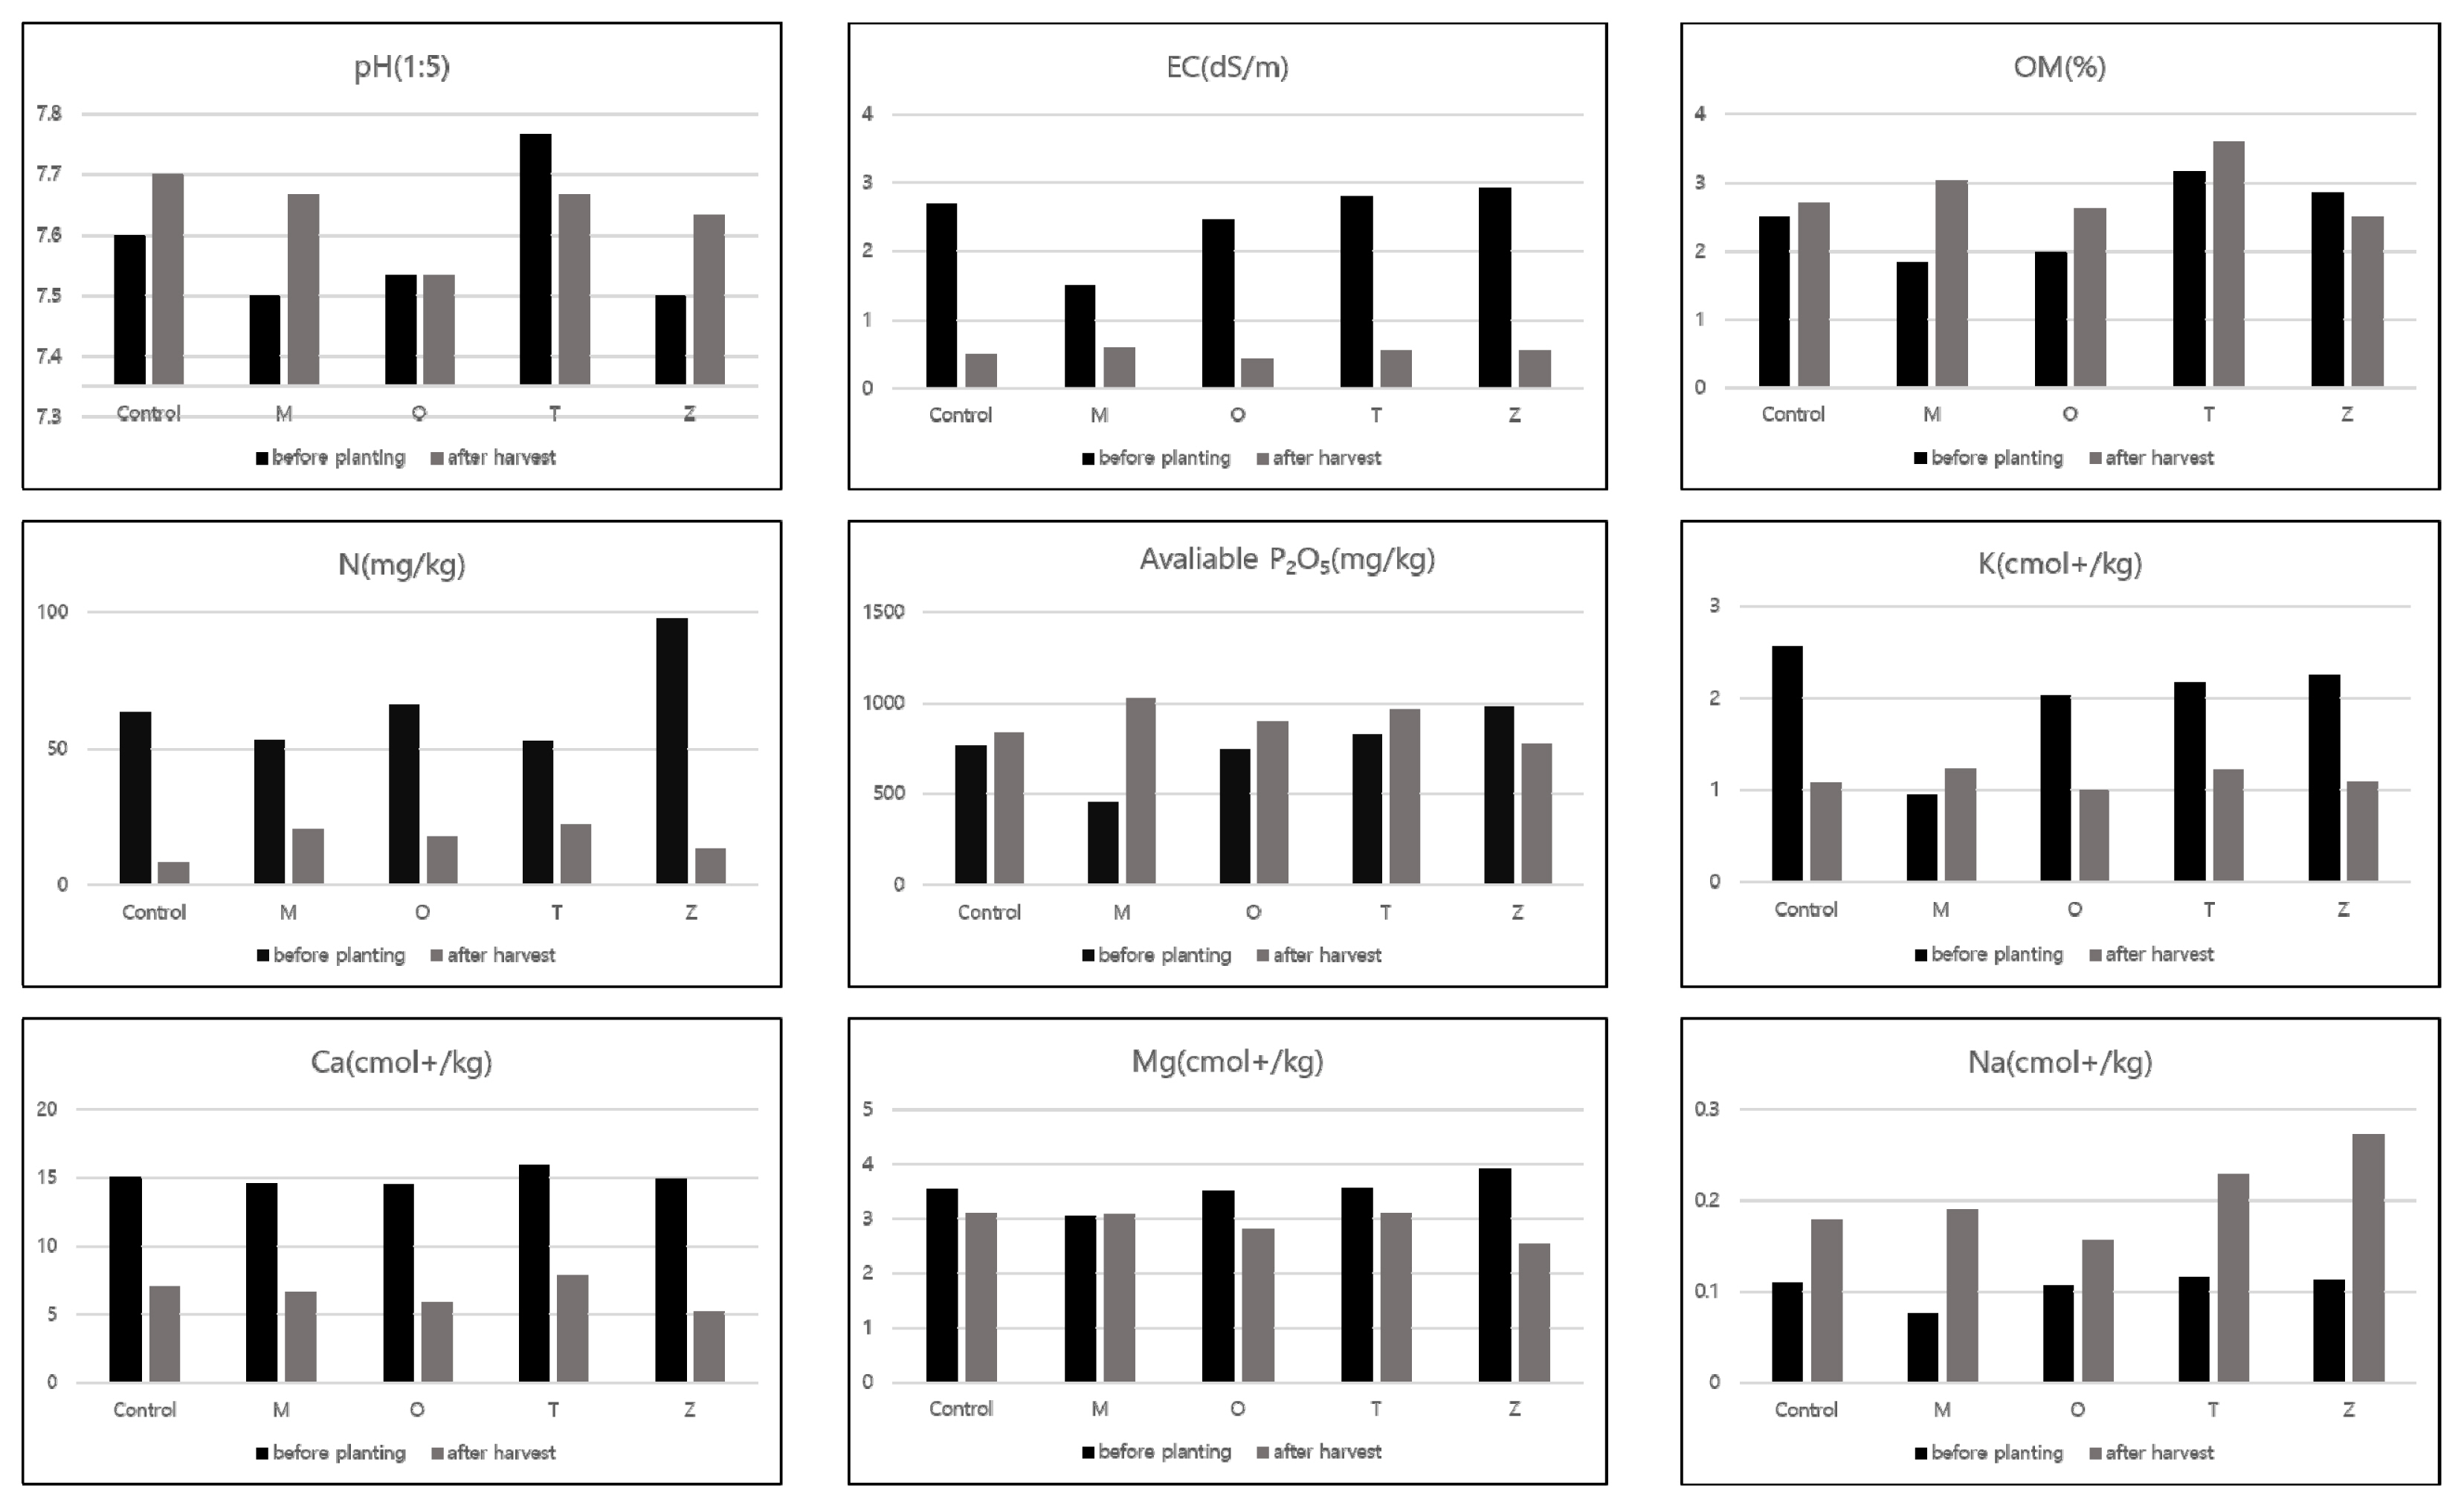
Chemical characteristics of soil on cultivation plot before planting and after harvest by four companion plants.

Chemical characteristics of soil on cultivation plot before planting and after harvest by different planting distance.
The soil pH of the cultivated area before planting ranged from 7.4 to 7.7, and the average pH of all experimental groups was alkalescent (pH 7.6). The pH of the soil after harvest ranged from 7.5 to 7.8, and the average pH of all experimental groups was 7.6. According to Lee et al. (2021), soil pH after the experiment ranged from 5.5 to 9.0, maintaining alkalescent soil without much change compared to the average pH of 7.7. Moreover, pH according to the type of companion plants and plant spacing was 7.5–7.8 and 7.5–7.6 before planting, and pH after harvest was 7.5–7.8 and 7.6–7.7, which was within the alkalescent range. Soil pH is an important factor that determines the solubility of inorganic nutrients, and cherry tomatoes prefer a slightly acidic pH of 6.0–6.5. (Lunt and Clark, 1959; Yun et al., 2000). The increase in the pH of some soils may be due to the increased absorption of anions such as NO3 − in the vegetative growth period the increased absorption of cations such as K+ in the reproductive growth period, as reported by Park and Kim (1998), releasing hydrogen ions (H+) from the roots. As of 2017, it was reported that the average pH of upland soil in Korea was 6.4, which is constantly increasing (Kim et al., 2019). The average pH of the soil was 7.6 before the experiment and pH 7.8 after the harvest, which was slightly higher than the pH of standard soil. This is considered a phenomenon of salt accumulation due to succession planting with more than 3 years of cultivation in the same field.
The conductivity of the soil before planting was 0.9–4.1 dS/m, and after harvesting it decreased to 0.4–0.8 dS/m but exceeded the standard value (less than 0.2 dS/m). EC according to the type of companion plants and plant spacing was 1.5–2.9 dS/m and 2.2–2.7 dS/m before planting, and EC decreased to 0.4–0.6 dS/m and 0.5–0.6 dS/m after harvesting but exceeded the standard value. Moreover, most soil nutrients have high effectiveness near the pH of 6.5–7.0 and thus advantageous for plant absorption, but as the absorption rate of plants decreased due to high pH, inorganic soil constituents increased, thereby causing salt accumulation in soil (RDA, 2020).
According to Lee et al. (2021), organic matter (OM) in the experimental soil was 2.4–13.7 g/kg, with an average of 7.12 g/kg, but it was significantly reduced to 1.6–3.4 g/kg before treatment and increased to 2.4–3.9 g/kg after the experiment. M10 showed the greatest increase and Z10 showed the greatest decrease. OM according to the type of companion plants and plant spacing was 1.8–3.2 g/kg and 2.3–2.7 g/kg before planting, which increased to 2.5–3.6 g/kg and 2.7–3.0 g/kg after harvesting. In addition, when the P content decreased, so did the OM, and when the P content increased, so did the OM. This indicated that P content in soil has an effect on the increase and decrease of organic matter.
After the experiment, the soil in which zinnia was planted as a companion plant showed the highest sodium content, which was consistent with the result of the experiment that sodium, which is involved in increasing the number of fruits in plant analysis, is a beneficial element instead of an essential element that is distributed most in the roots. The increase in sodium concentration in the soil caused antagonism between cations as nutrients are absorbed by plant roots, causing an increase in the relative absorption of magnesium and a decrease in the amount remaining in the soil. Nonetheless, the soil chemical properties after harvest are as follows according to the upland soil standard (RDA, 2020): the acidity is high, and phosphoric acid, exchangeable potassium, calcium, and magnesium all increased compared to the previous year but still had little content, and there was a need for soil amendment. To improve the overall physicochemical properties of soil for the experiment, it is necessary to secure soil pores through till-age to a depth of 60–70 cm, adjust adequate amount of irrigation considering that drainage is good due to deep tillage, and minimize nitrogen fertilizers in fertilization and management. The values of physicochemical properties of soil before planting showed differences in all treatments, which may be an error that occurred in the process of collecting soil samples from random locations after formation due to the nature of the wide open field, and it is difficult to create a precisely even state since it is not a pot experiment. To make up for this, accurate analysis can be conducted in further research through a pot experiment.
Conclusion
This study was conducted to examine the effect of companion planting and plant spacing on the growth and quality of cherry tomatoes. By analyzing various factors such as the growth of cherry tomatoes according to companion plants and plant spacing, growth and vitamin C content of harvested fruits, mineral content of plants, and inorganic soil constituents, this study intends to lay the growth foundation for high quality and high yield to meet the needs of urban residents and provide convenience in soil and crop management for succession planting.
We formed 45 ridges 45 ridges in the size of 4 m×1.2 m× 0.5 m (width x length x height) for 7 days from April 16, 2021 and applied spearmint, basil, French marigold, and zinnia to accompany cherry tomatoes at 10cm, 20cm, and 40cm. We did not plant companion plants in the control group and planted only cherry tomatoes in the middle of the ridge, repeating 3 times in each experimental group. The results are as follows.
Plant height of cherry tomatoes was the same as that of the control group, and stem thickness was lower in M20, M40, O20, and O40 compared to the control group. The total number of fruits per plant showed greater effect than the control group in only Z40, and T20 also showed many fruits per plant, although there was no difference from the control group. As a result of root component analysis, the highest sodium content was detected in Z40, which was consistent with the experimental result that sodium, which is involved in increasing the number of fruits in plant analysis, is a beneficial element instead of an essential element and is mostly distributed in the roots.
As a result of MANOA to examine companion planting, plant spacing, and the interaction effect between companion plants and plant spacing, it was found that companion planting showed a statistical difference in plant height, stem thickness, total number of fruits per plant, total fresh weight of fruits, and fruit hardness, but no difference in sugar content and vitamin C of fruits. There was no statistical difference in plant spacing from companion plants, and the interaction effect between companion plants and plant spacing also did not show a statistical difference. However, sugar content and vitamin C content were substantially higher than the standard value, proving that there was an effect although there was no difference.
As a result, the most effective way to improve growth and quality of cherry tomatoes is to use zinnia as a companion plant and maintain the plant spacing of 40cm from cherry tomatoes. However, this study has limitations in that it failed to analyze the mechanism by soil microbes in root zones during the growth duration of cherry tomatoes. Therefore, further research can be conducted to examine the types of soil microbes in root zones and the effect on the growth of cherry tomatoes.
Notes
This paper is funded by a Rural Development Administration project (PJ01507601).