


Introduction
Damages of lives and loss infrastructure have been increasing in recent years due to earthquake. A recent example is the April 2015 earthquake that occurred in Nepal of magnitude 7.8M (Assessment Capacities Project (ACAPS), 2015) and depth of 15km which was NepalŌĆÖs worst earthquake since 1934. The earthquake took 9,000 lives while injuring more than 23,000 individuals.
The need to understand the spatial and temporal landslide is particularly important in regions frequently affected by earthquakes (Hermanns et al., 2000; Lin et al., 2008). Especially, vegetation phenology has significant relationship with landslide (Zhang et al., 2010) and has shown high correlation with occurrence of landslide (Kim et al., 2014). Therefore, finding vegetation phenology characteristics with landslide is necessary for understanding which terrain is susceptible to landslide (Zhang et al., 2015). This relationship of finding quantitative characteristics of landslide can be used to reduce landslide damage resulted from earthquakes by detecting them beforehand and by promoting an adaptation plan for restoration of forest. However, it is difficult to acquire that data through field surveys because of financial burden to environmental agencies and limited access to prone regions. Thus, remote sensing can be used to understand the correlation between vegetation phenology and landslide at a regional scale.
Most studies have focused on anthropogenic factors such as slope disturbance (Walker et al., 1996), inconsiderate irrigation (Wang et al., 2004) and deforestation (Swanson and Dyrness, 1975), intense rainfall (Iverson, 2000), and are based on coarse resolution data from Moderate-resolution Imaging Spetroradiometer (MODIS) (Hwang et al., 2011). These methods are insufficient to identify a susceptible place to reduce landslide damage through forest management.
The objective of this study is to identify landslide occurrence area and vegetation phenology characteristics using LANDSAT8 multi-temporal data and Normalized Difference Vegetation Index (NDVI).
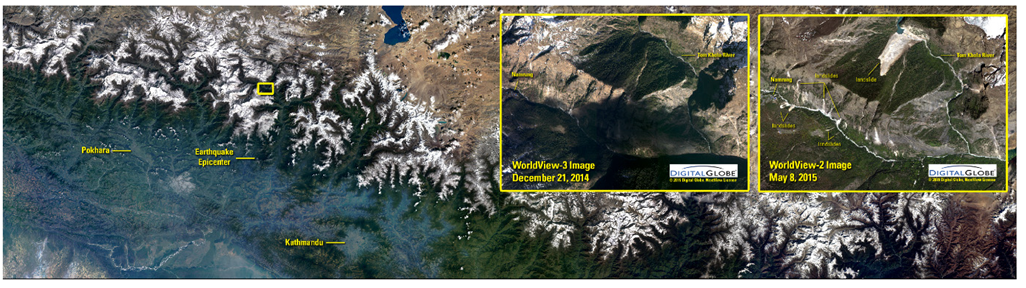
Fig.┬Ā1
Earthquake epicenter in Gorkha District (background) and location of study site (yellow boxes with left (before the earthquake) and right (after the earthquake) in Manaslu Conservation Area, Nepal.).Note) WorldView3 Image produced by Digital Globe in the two smaller images shows study site before and after the earthquake (Image acquisition by USGS)
Method and materials
1. Study site
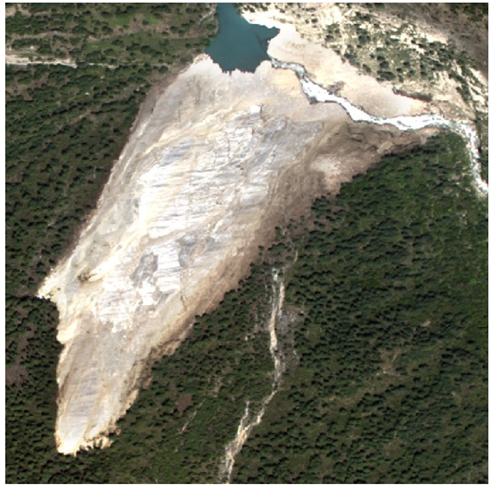
The landslide that occurred in Manaslu Conservation Area (MCA) is located in Gorkha District of Nepal. The study area is about 46km from the epicenter of the Earthquake that struck on April 2015 estimated to have a magnitude of 8.0 according to United States Geographical Survey (USGS). The geographical co-ordinates for the landslide is 28┬░33ŌĆÖ8ŌĆØN and 84┬░47ŌĆÖ30ŌĆÖŌĆÖE. The elevation of MCA ranges from 1400m to 8,156m and has an average rainfall of 1900mm. The area of 1,663km2 has 2,000 species of plants, 33 species of mammals, 11 species of butterflies and 3 species of reptiles. The dominant vegetation species are oaks and mixed hardwoods including Quercus spp. (oaks), Carya spp. (hickory), Nyssa sylvatica (black gum), Liriodendron tulipifera (yellow poplar), and Tsuga canadensis (eastern hemlock). Major evergreen species are Rhododendron maximum (rhododendron) and Kalmia latifolia (mountain laurel) (Day et al., 1988).
2. Data acquisition and processing
The method we propose relies upon the use of pre- and post-event remotely sensed images for detecting vegetation phenology characteristics correlated landslide activities. For this case, images from multi-temporal sensors are most desired. After searching the entire LANDSAT database archived by USGS EarthExplore (www.earthexpoler.com), we were able to obtain LANDSAT8 Operational Land Imager (OLI) scene acquired from April 2014 to November 2015, more than 6 months after the earthquake. Data acquisition time is very important to extract biomass or chlorophyll content about biological characteristics because most of the plants in forest have a relatively unique growth cycle (Jensen, 2000). Therefore, we selected temporal data from April to October of 6 months considering growth cycle of vegetation in study site. However, it is difficult to obtain cloud-free satellite scenes over mountainous areas due to high moistures, particularly after an extreme event such as an earthquake or a severe storm. Obtaining cloud-free image pairs for change detection is even more difficult (Ju and Roy, 2008).
For the removal of clouds, MVC (Maximum Value Composite) was used for NDVIŌĆÖs monthly data. MVC method is a widely used to remove clouds from image (Marcal and Wright, 1997; Jeong et al., 2006). The process piles multiple images and selects the highest pixel value among the pixel values in the same location (Jeong, 2006) to produce a cloud free image as shown in Fig. 3 (center). In case of July 2014 and 2015, MVC was not able to remove the cloud covering and has been omitted in the result. We also conducted a limited field work to collect first-hand data concerning the earthquake impacts and landslide activities in Gorkha District. This part of work has been quite helpful for facilitating data processing and interpretation.
3. Vegetation phenology characteristics analysis
Vegetation phenology represents a potentially significant source of landslide information (Simonetti et al., 2015). The use of phenological indicators derived time-series data and NDVI is becoming more popular for regional and national scale vegetation monitoring. NDVI is an index to measure vegetation difference and cannot accurately measure characteristics other than those of vegetation (Takeuchi and Yasuoka, 2004; Jeong et al., 2006). Our study chose NDVI as an index of vegetation not only because it is one of the most widely used indices but also because it is less affected by topographical factors and illumination than other vegetation indices (Lillesand and Kiefer, 1994; Lawrence and Ripple, 1998; Lyon et al., 1998; Riera et al., 1998). The NDVI is also sensitive to land cover changes, making it possible to detect landslide areas (Temesgen et al., 2001; Lee, 2005). The value of NDVI ranges from -1.0 to 1.0, with high values indicating high volume of live photosynthetic vegetation (green leaves), while low value represent bare soil and rock area. The vegetation index differencing examined in this study was performed by subtracting the values from one date to another. This method is then referred to as NDVI method that derived using the following equation where NIR is the Near-Infra Red band and RED is the Red band of LANDSAT8 multi-spectral image data:
With this Eq. 1, NIR (Near Infrared) have wavelength range from 0.77 - 0.90, which emphasizes biomass content and shorelines. RED have wavelength range from 0.63 - 0.69 that can discriminate vegetation slopes. The values of NDVI have range from -1 to 1. The negative values express the decreasing biomass or green vegetation and may be an indicator of landslides occurrence. This method had been implemented by Nelson (1983) to detect leaf defoliation caused by ŌĆ£gypsy mothŌĆØ attack. Singh (1989) had also implemented this method for detecting land clearing location. Change detection is effective method to find detail change characteristics from multi-temporal image (Lunetta et al., 2006). We selected the traditional change detection method based on pixels to find phenology difference between pre- and post-landslide images.
Results and discussion
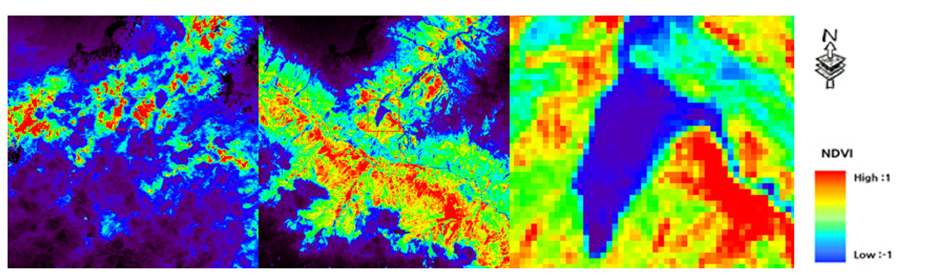
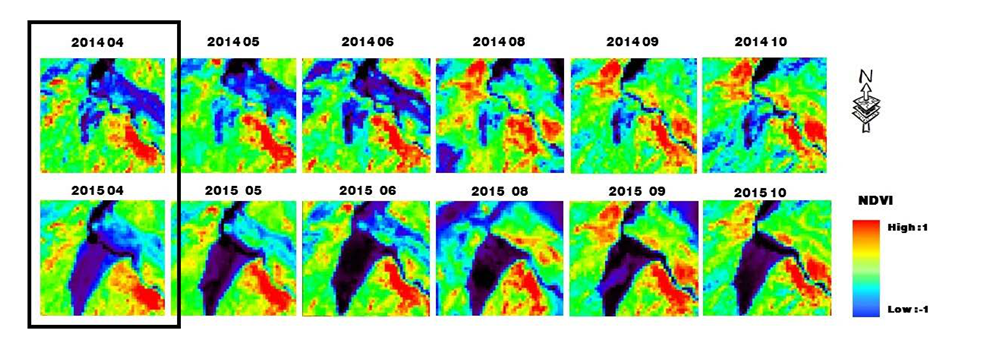
Fig. 4 and Fig. 5 shows the monthly NDVI image that represents vegetation phonological characteristics for pre-landslide, pre-earthquake, and post-landslide, post-earthquake in Gorkha district. The pre-landslide NDVI MVC composite is from April, 2014 to March, 2015 while post-landslide NDVI MVC is from April, 2015 to November, 2015. The landslide study area showed lower NDVI value than the surrounding area before the earthquake triggered the landslide. As low NDVI value shows that an area is primarily composed of bare soil or has a low vegetation density (Holben, 1986) and can also show that rooting in forests, if any, is low (Verbyla, 2015), the landslide study site had low vegetation and low rooting of plants.
Fig. 4 shows how the NDVI values have been changing through the months between April, 2014 to November, 2014. Data for July, 2014 has been omitted as MVC data could not remove the cloud covering on the study site. The data shows the mean NDVI value to fluctuate between 0.247 to 0.397, peaking on the month of September.
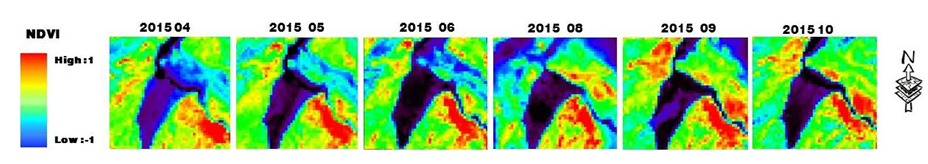
In Fig. 5 shows how NDVI values have been changing through the months between April, 2015 to November 2015, that is, after the earthquake had struck and the landslide had taken place. The data for July, 2015 was omitted as comparative data for July, 2014 was not available. The data showed the mean NDVI value to fluctuate between 0.1 to 0.2, peaking in the months of June, August, September and October.
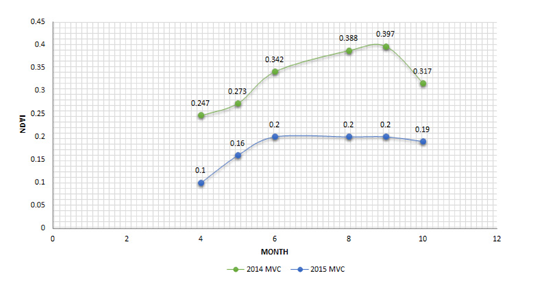
Fig. 6 shows comparative NDVI MVC imagery for the landslide study site. There is clear distinction in NDVI value change between the two years. Firstly, comparing the month where the earthquake triggered landslide occurred, the data shows that NDVI value has decreased by 0.147 from the previous year. Secondly, 2014 data shows that the value of NDVI was supposed to increase in monsoon season upto September, however, the 2015 data shows that the value remained constant 0.2 in that time. A maximum NDVI difference of 0.197 was observed in the month of September. The graph in Fig. 7 succinctly summarizes the result discussion.
Fig.┬Ā4
NDVI MVC data for months of April 2014 to December 2014, before the earthquake induced landslide.
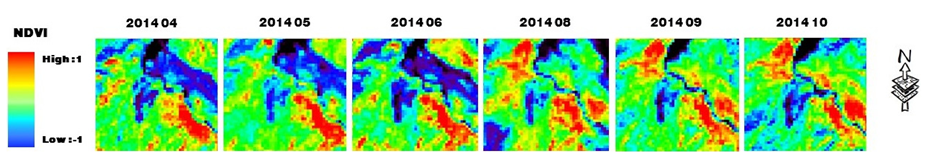
Fig.┬Ā5
NDVI MVC data for months of April 2015 to December 2015, after the earthquake induced landslide.
The temporal data shown in Fig. 7 shows how each monthŌĆÖs NDVI mean value can be compared to one another. As mentioned before, in 2014, the value increased uptill September, however in 2015, the value increased till June and remained steady until it fell by 0.01 in November. The steady 0.2 NDVI value shows that the vegetation in that area did not grow as expected in 2015. Both the comparative lower NDVI value and the plateauing of NDVI value shows that the landslide did have an effect on the mean NDVI. This is consistent with a previous study which showed that NDVI value decreased after landslide because of total loss of previously existing vegetation (Behling et al., 2014).
The method used in this study has been effective in demonstrating lower NDVI areas could be prone to landslides as such values represent bare soil (Todd and Hoffer, 1998) which have higher risk for landslide than dense vegetation. The study shows that denser vegetation can reduce the risk of landslides and re-vegetating such lower NDVI areas could prevent landslides happening in the future. More specifically, observing the months of April 2014 and 2015 (when the earthquake struck), slopes with NDVI mean value less or equal to 0.247 are likely to be prone to landslide in an event of an earthquake.
Conclusion
The purpose of this study was to identify relationship between vegetation phenology and landslide using remote sensing to gather information on landslide prone areas. The study focused on a single study area, taking temporal data of pre and post landslide which was in MCA, Gorkha Distict, Nepal. The data obtained during the study showed that a lower NDVI mean value of the area (before the earthquake) was a reason for itŌĆÖs susceptibility to the landslide. Additionally, the study also showed that NDVI mean value remains low after the landslide has taken place.
Moreover, observing the data obtained from April 2014, we understand that slopes with NDVI mean value less or equal to 0.247 are likely to be landslide prone because the same area was susceptible to landslide in April 2015 when the earthquake struck. However, more study sites have to be studied to confirm this finding. If confirmed, the implications of this finding could be used to detect landslide-prone areas using NDVI and take measures much re-vegetation programs or relocate residents directly under threat.


