


Introduction
With more than half of the global population migrating to urban areas due to rapid urbanization, indiscriminate development is causing habitat degradation and fragmentation in urban ecosystems. As a result, this has a detrimental impact on biodiversity (Kim et al., 2018), leading to the loss of natural habitats and insufficient green spaces in urban environments, making it challenging for species to find suitable habitats (Vlahov and Galea, 2002). To address these issues and enhance urban biodiversity, it is essential to secure green spaces within the city (Kowarik et al., 2019).
In particular, diverse types of natural spaces and green areas are necessary to create an environment where various species can inhabit urban areas. Urban biotopes, especially in city centers, are considered crucial green spaces contributing to biodiversity. Changes in biotope classifications are altering the habitat value of species in urban environments. Hence, in-depth research on changes in biotope classifications in city centers is essential to promote urban biodiversity. Through such research, effective policies for urban environmental conservation and ecosystem management should be established.
Wild birds serve as crucial indicators of urban ecosystems, and numerous previous studies have focused on biodiversity research in urban green spaces (Park & Mo, 2021). Unlike many other species, birds can move quickly between green spaces and respond immediately to environmental changes through flight (Song, 2014; Song, 2018). Therefore, wild birds hold significant importance as key indicator species for assessing the health of urban ecosystems (Yang et al., 2020). The presence of wild birds in parks is influenced by the park’s size and factors such as tree species diversity and the proportion of impermeable surfaces (Song, 2015). Particularly in urbanized areas, the occurrence of wild birds is closely associated with block size, green coverage, building coverage, and the height of the tree layer (Kwak et al., 2010).
Research cases focusing on the habitat suitability of birds in urban areas exist, including a study conducted on bird species in Seoul. The study investigated changes in bird habitats based on variations in biotope areas. The results indicated increased bird habitat within biotopes with diverse vegetation structures. The findings suggest that biotope composition and management can contribute to expanding bird habitats (Chae et al., 2004). Moreover, increasing the area of biotopes can enhance avian diversity in urban areas (Chae & Koo, 2005). Furthermore, according to research aimed at understanding the effects of small-scale biotopes on urban ecological restoration, it has been observed that stable avian habitats are possible in areas designed for urban ecological restoration (Kim et al., 2022). Based on the aforementioned previous studies, it is evident that there is a close correlation between avian habitats and the area and diversity of biotopes.
The research site, Seoul, has been continuously updating and operating the “Urban Ecological Status Map” since 2002 up to the present year, 2023. This status map is structured with thematic maps covering land use, impermeable soil coverage, existing vegetation, biological distribution, biotope types, and biotope type assessments. Among these, biotopes are crucial indicators from a biodiversity perspective, serving as a grading system that indicates to what extent specific areas or spaces within the city support and sustain biodiversity (Yun et al., 2014). The biotope grading system is divided into five levels, ranging from Grade 1 to Grade 5. Grade 1 represents areas with an excellent environment that supports a variety of fauna and flora, serving as core spaces for habitats and ecosystems within the city. These areas are considered crucial and require absolute conservation. Grade 2 areas, while less satisfactory than Grade 1, are still considered crucial ecosystems within the city and should be given priority for conservation. Grade 3 areas have a favorable environment in specific locations that support biodiversity. While they are relatively less critical than Grades 1 and 2, they still provide some ecological functions within the city.
Indeed, the biotope grading system plays a crucial role as an indicator reflecting the extent to which specific areas or spaces within a city support and sustain biodiversity. If the biotope grade is elevated, there is a potential for an increase in biodiversity. The upward adjustment of biotope grades aims to conserve ecosystems and enhance urban ecology. This process primarily considers species sensitive to environmental conditions, positively impacting urban biodiversity. The increase in biotope grades serves as a crucial factor for improving species habitats, preserving biodiversity, enhancing urban ecosystems, expanding habitats for species, and providing support for policies and decision-making. Because this is accompanied by various social, economic, and environmental costs, research on raising the biotope level is necessary to improve the urban ecosystem efficiently. However, there is a lack of comprehensive research cases analyzing the effects of biotope grade changes and improvements within urban areas.
Therefore, this study has set the following research objectives to derive effective methods for improving biotope grades: First, analyze the potential habitat changes of wild bird species within the city according to biotope grade change scenarios. Second, compare the area of biotope grade change with the increased potential habitat area and analyze the efficiency of each grade change scenario. Third, propose efficient methods for elevating biotope grades, considering the efficiency of each biotope grade change scenario. The results of this study are expected to be applicable to support projects and policy decisions aimed at improving and conserving urban ecosystems and enhancing biodiversity within the city.
Research Methods
Study area and materials
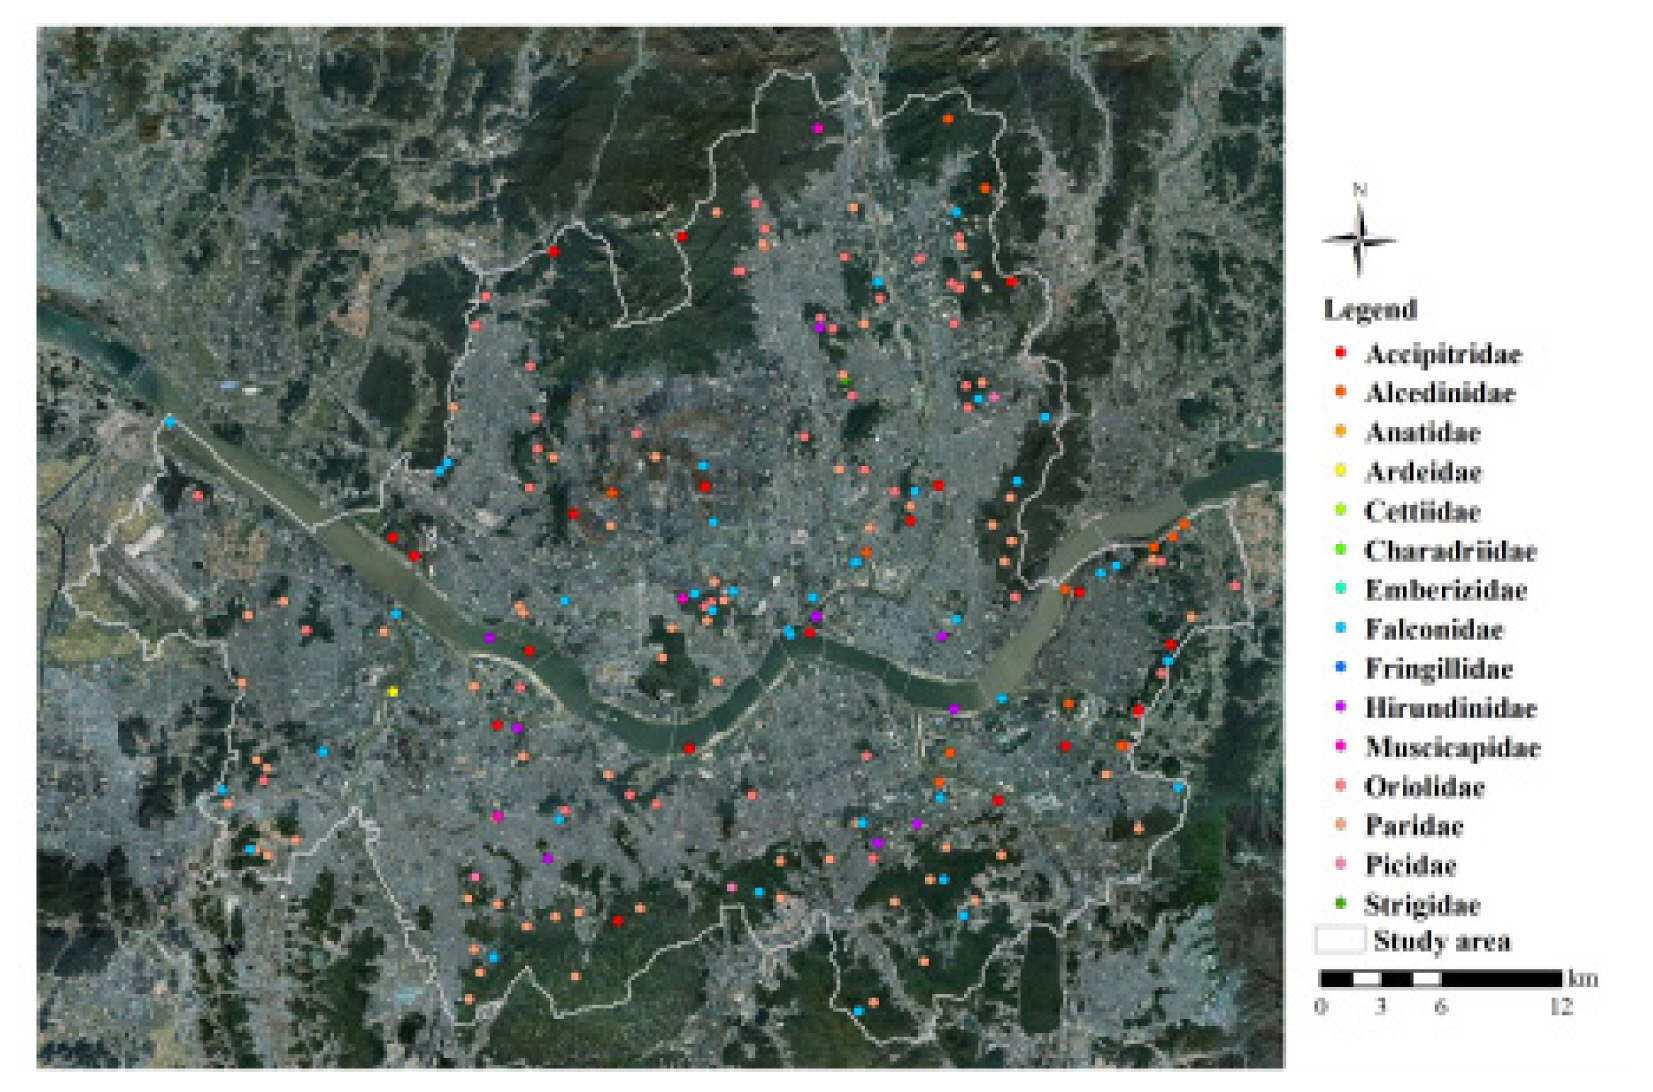
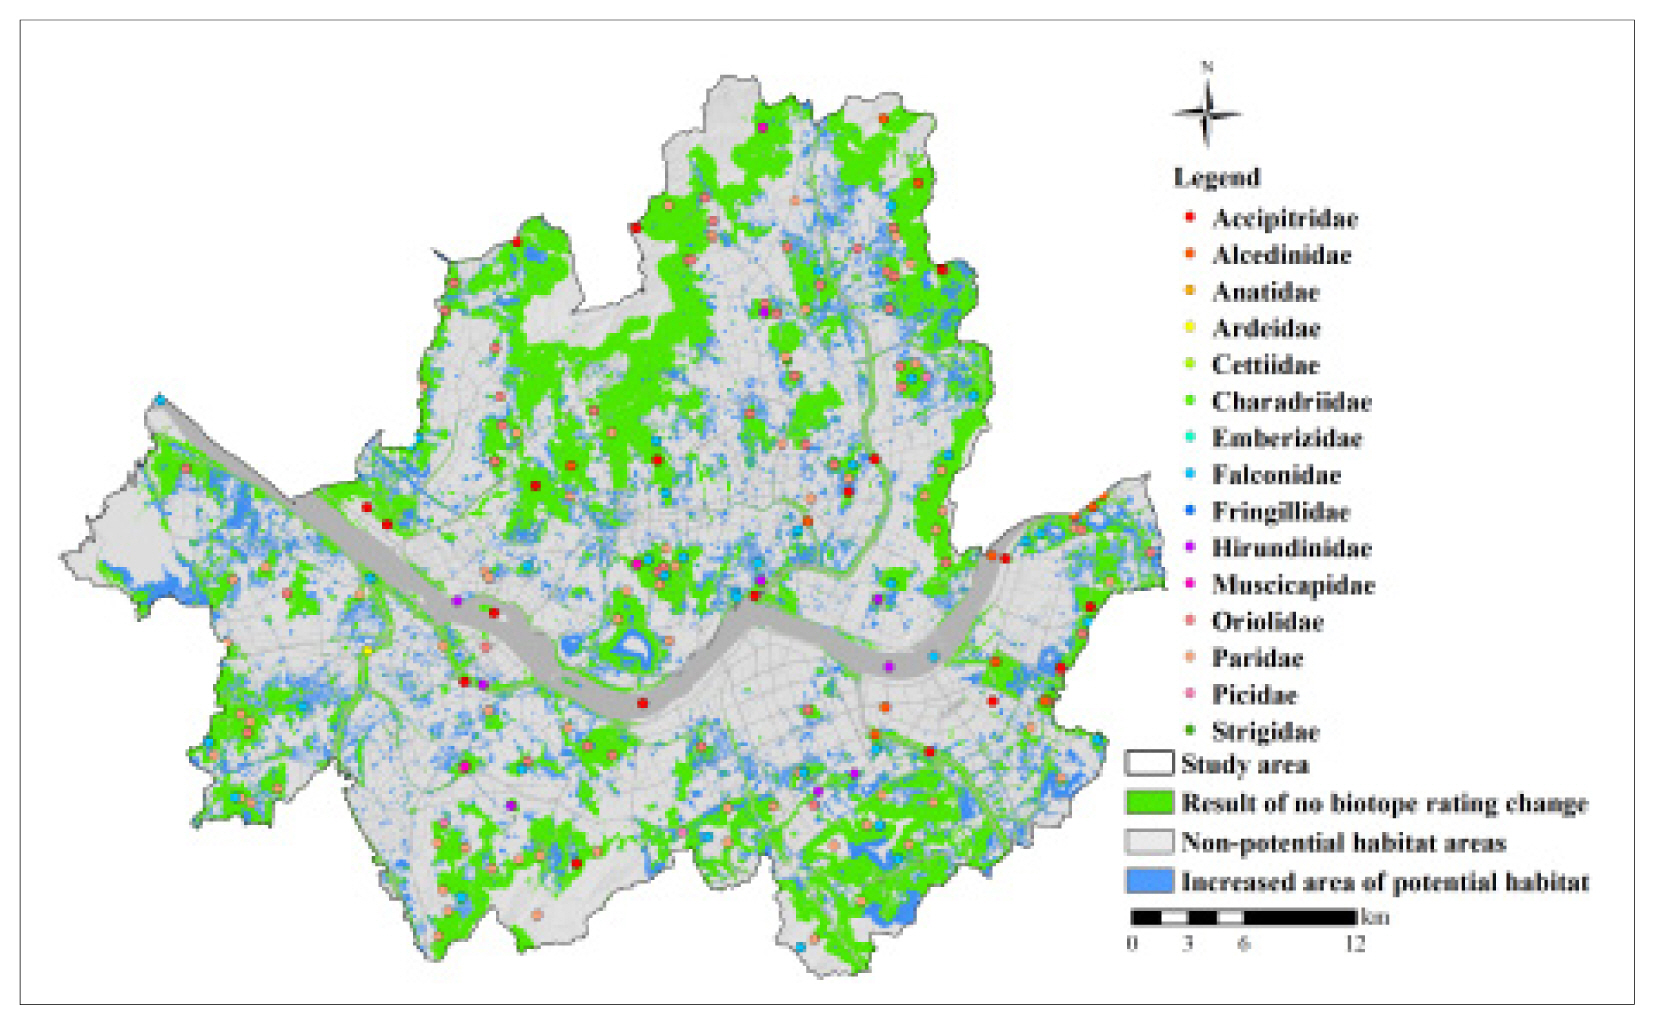
The spatial scope of this study is Seoul, South Korea. Despite having the highest urbanization rate domestically, Seoul boasts a significant distribution of green spaces within the city. The selection of Seoul is attributed to the presence of diverse wild bird habitats, as illustrated in Fig. 1. Seoul continuously updates and constructs spatial information on the urban ecological status, designating and constructing specific habitats for bird conservation species within the city. This facilitated the selection of Seoul as the study area for ease of research analysis. The temporal scope of the study is set to the latest production year of Seoul’s “Urban Ecological Status Map,” 2022.
The target species for the study are the bird conservation species designated by Seoul City. The reason is that the city of Seoul designates wild birds that are ecologically important and worth conserving (natural monuments, endangered species 1 and 2, etc.) as protected species, so it was judged appropriate to evaluate the health of the urban ecosystem. In order to mitigate the influence of seasonal variations, 15 resident bird species, excluding migratory birds, were specifically chosen from the list of target birds. The 15 selected resident bird species for this study are categorized as follows: Oriolidae, Fringillidae, Picidae, Muscicapidae, Falconidae, Emberizidae, Charadriidae, Alcedinidae, Paridae, Ardeidae, Accipitridae, Anatidae, Strigidae, Hirundinidae, and Cettiidae.
The analysis utilized 899 occurrence points for the selected 15 resident bird species. Biotope is not merely an urban ecological space for a single species; it represents a communal living space for plants and animals (Kim et al., 2015). Hence, various ecological features like ecological diversity and interactions between species were considered to obtain comprehensive results for potential habitats. This study conducted an integrated analysis involving the 15 species.
Analysis method
Species distribution model (MaxEnt)
The MaxEnt (Maximum Entropy) model was chosen as the analysis model for potential habitat analysis, providing high reliability even in the absence of occurrence information. MaxEnt has been evaluated as a model with proven scalability and accuracy in various studies, making it suitable for predicting species habitats by considering complex ecological interactions. Furthermore, machine learning models effectively manipulate data, apply environmental variables to various models, and produce optimal results. Its strength lies in the ability to statistically interpret variables, including assessing the contribution of each variable to the model’s outcomes.
Obtaining occurrence and non-occurrence information should be possible if field surveys are conducted specifically for a particular region and species. However, gathering information on non-occurrence in most field surveys is often challenging (Phillips et al., 2006). Therefore, MaxEnt is advantageous when there is insufficient data on the occurrence and non-occurrence of a species or when traditional statistical inference methods cannot derive a probability distribution effectively (Cho et al., 2015). In this study, it was deemed appropriate to utilize MaxEnt for analysis as there is a lack of non-occurrence information.
The results of MaxEnt analysis are derived as a habitat probability distribution map ranging from 0 to 1. This was then transformed into binary data with occurrence (1) and non-occurrence (0) values, using the logistic threshold, specifically the ‘maximum training sensitivity plus specificity’ value as a criterion (Hu & Jiang, 2011; Thuiller, 2004).
The hyperparameters used for the MaxEnt model in this study include feature class combinations, regularization multiplier, maximum iterations, background samples, and cross-validation. The above parameters are used to control the operation and complexity of the model. The values of the parameters used during operation in this study were set to default values and are as follows. Feature class combinations include Linear, Quadratic, Product, and Hinge Feature classes, while the Regularization multiplier used to control the model’s complexity is set to 1. The maximum iterations, representing the number of iterations in finding the optimal model, is set to 500. Additionally, the background samples used to generate non-occurrence information for the model’s training and prediction are configured as 10,000. Furthermore, cross-validation was conducted four times to ensure a reliable model performance evaluation. The default hyperparameters have been widely utilized for the analysis of various species and, as this study does not focus on specific species, we conducted the analysis using the default values.
Environmental variable data
To select environmental variables for the analysis of potential habitats for birds, relevant environmental variables were derived by referencing previous studies related to bird species (Brotons et al. 2004; Oja et al. 2005; Seoane et al. 2005). The characteristics of environmental variables were derived, focusing on 11 environmental variables that influence bird habitats, including urban areas, green spaces, cultivated areas, topography, and climate (Table 1). The environmental variables were produced at a 10 m × 10 m high resolution. All editing and production of environmental variables were conducted using ESRI’s ArcGIS 10.4.1.
Rating change scenario analysis
This study applied four scenarios based on upgrading the biotope grades in Seoul. (1) Potential habitats according to the current biotope grade, (2) Potential habitats when converting Grade 2 areas to Grade 1, (3) Potential habitats when converting Grade 3 areas to Grade 2, and (4) Potential habitats when converting Grade 2 and 3 areas to Grade 1 were analyzed. The change in the potential habitat area according to the change in the biotope grade was analyzed. Analysis was conducted in a total of 4 scenarios to derive the efficiency of increasing the potential habitat according to the increase in the biotope grade for each scenario.
Results and Discussion
Analysis results of potential habitats
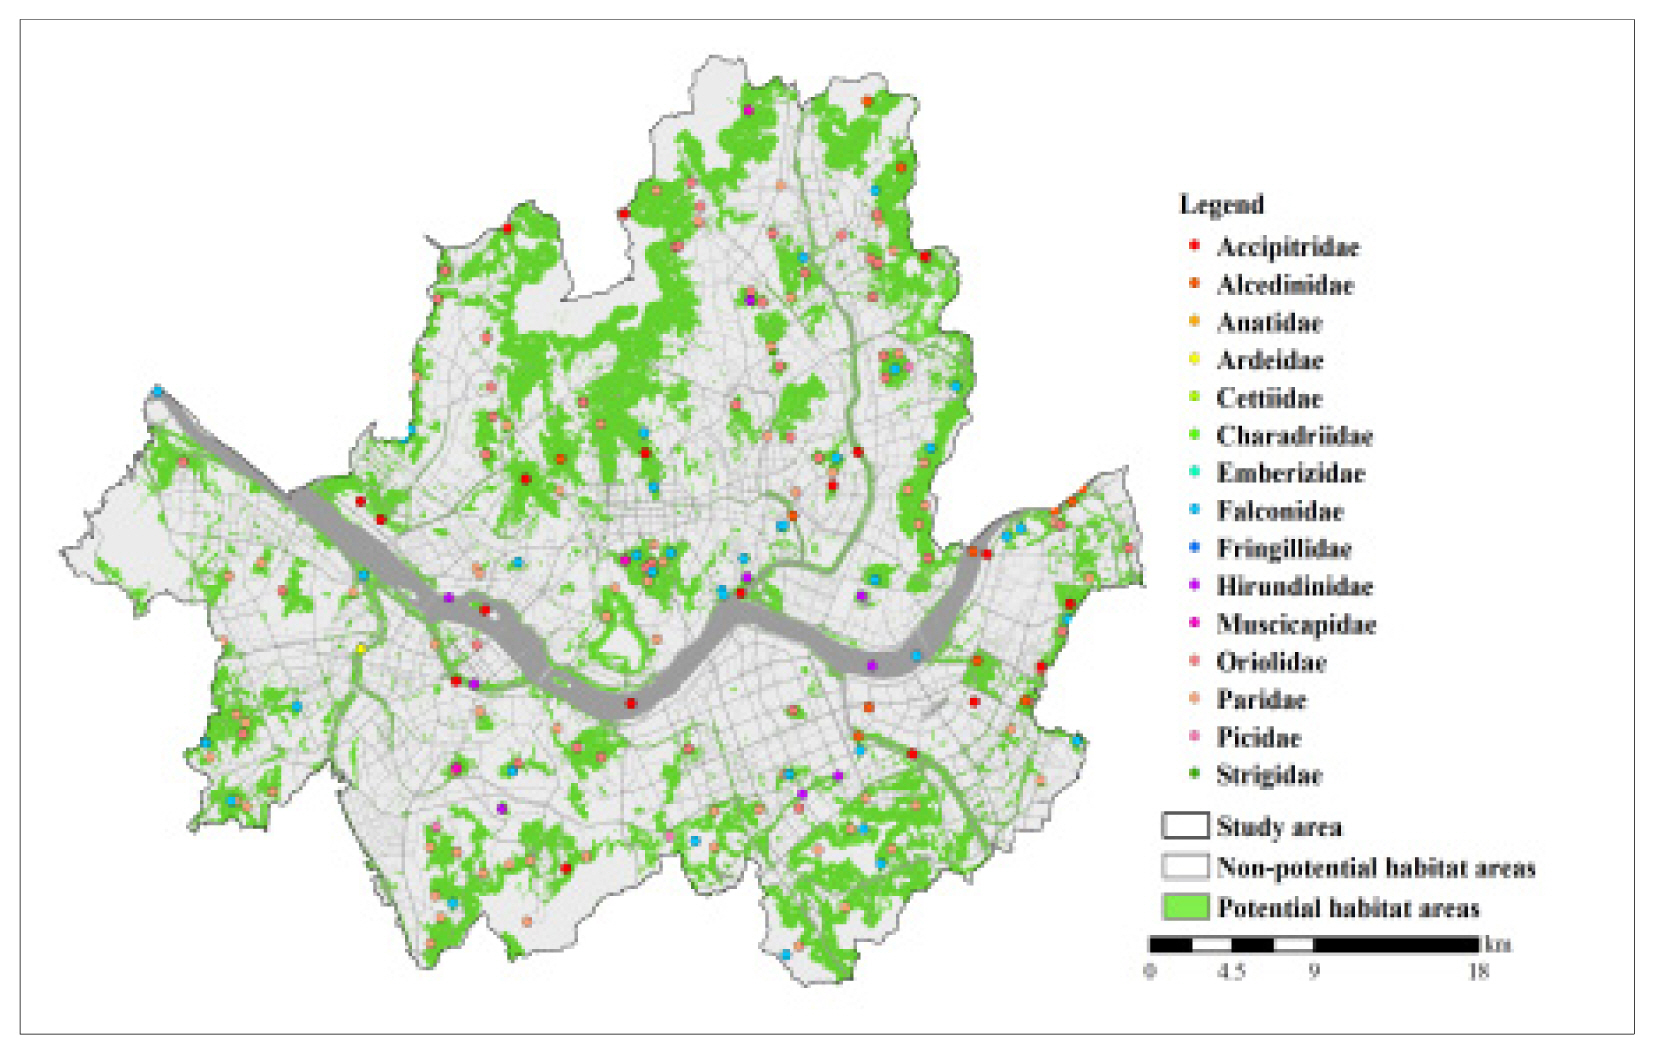
The analysis of potential habitats using 15 target birds in Seoul, 899 occurrence points, and 11 environmental variables revealed a high reliability of the model, with an AUC (Area Under the Curve) value of 0.813, indicating a strong confidence level. The threshold value for species occurrence, used to determine potential habitats, was derived as 0.288. Generally, studies utilizing statistical models consider AUC values as excellent when in the range of 0.9–1.0, good between 0.8–0.89, fair between 0.7–0.79, and poor between 0.51–0.69 (Carter et al., 2016). The potential habitats for target birds species in Seoul are concentrated in a belt-like pattern around the city’s outskirts. This pattern is attributed to large natural forested green spaces, such as Bukhansan, Gwanaksan, and Umyeonsan, considered suitable potential habitats. Additionally, small potential habitats for target birds were identified in the central part of Seoul, along rivers, urban parks, and green spaces (Fig. 2). Previous studies have also evaluated that urban birds frequently appear in parks and green spaces within the city center (Hong and Kwak, 2011).
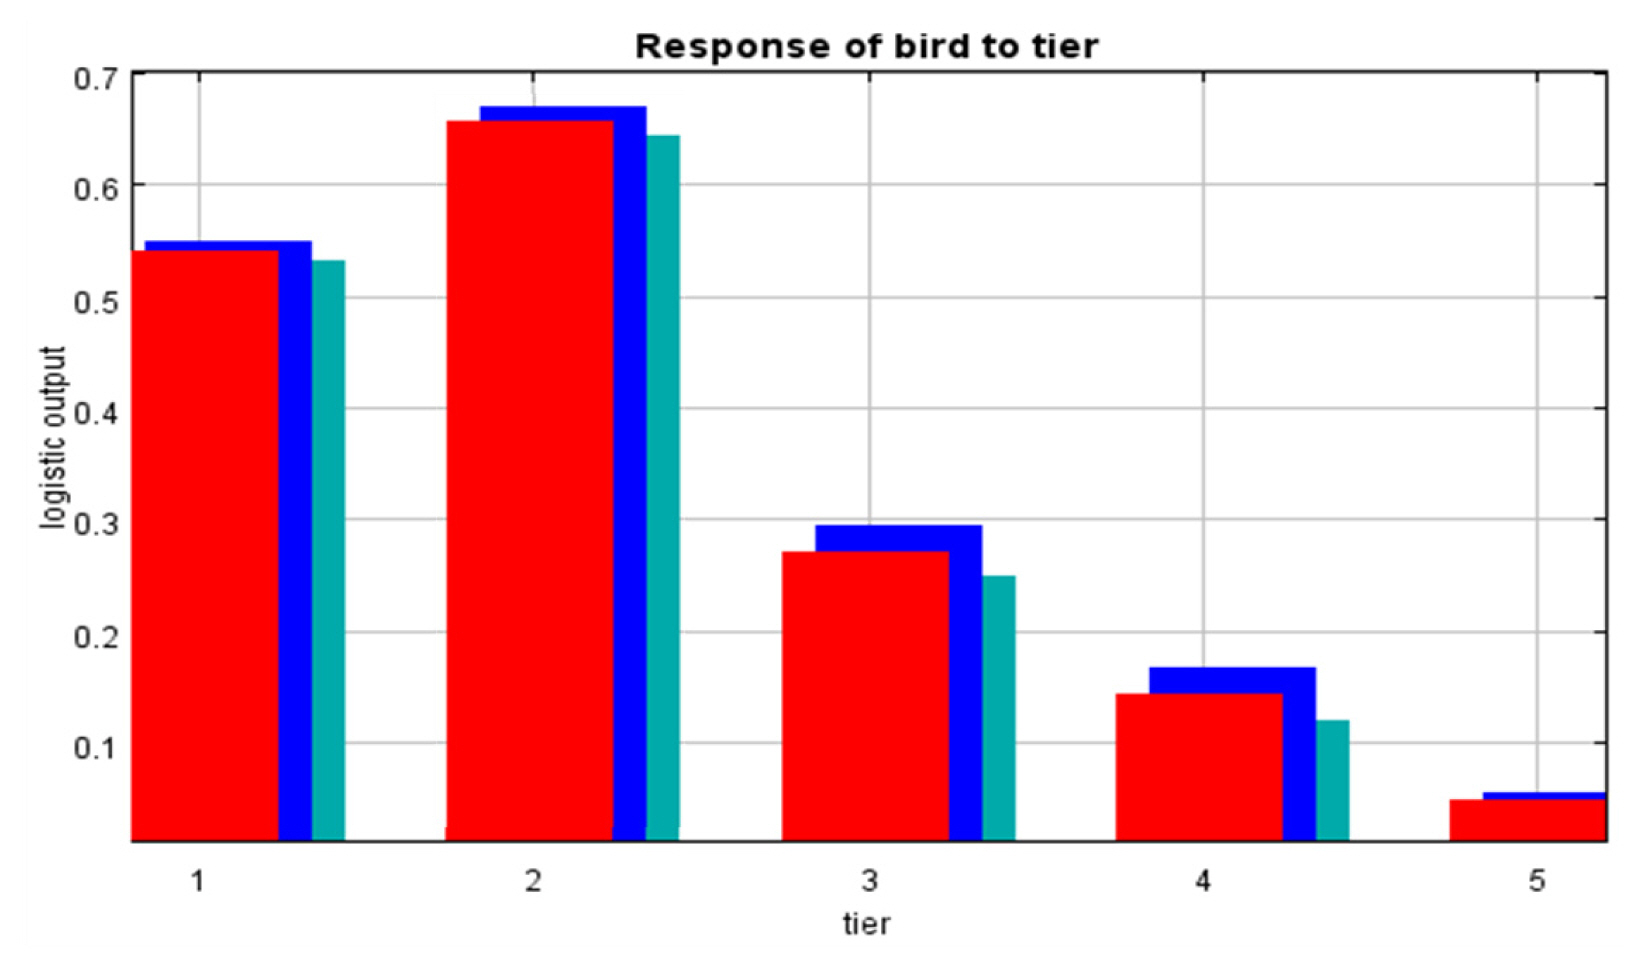
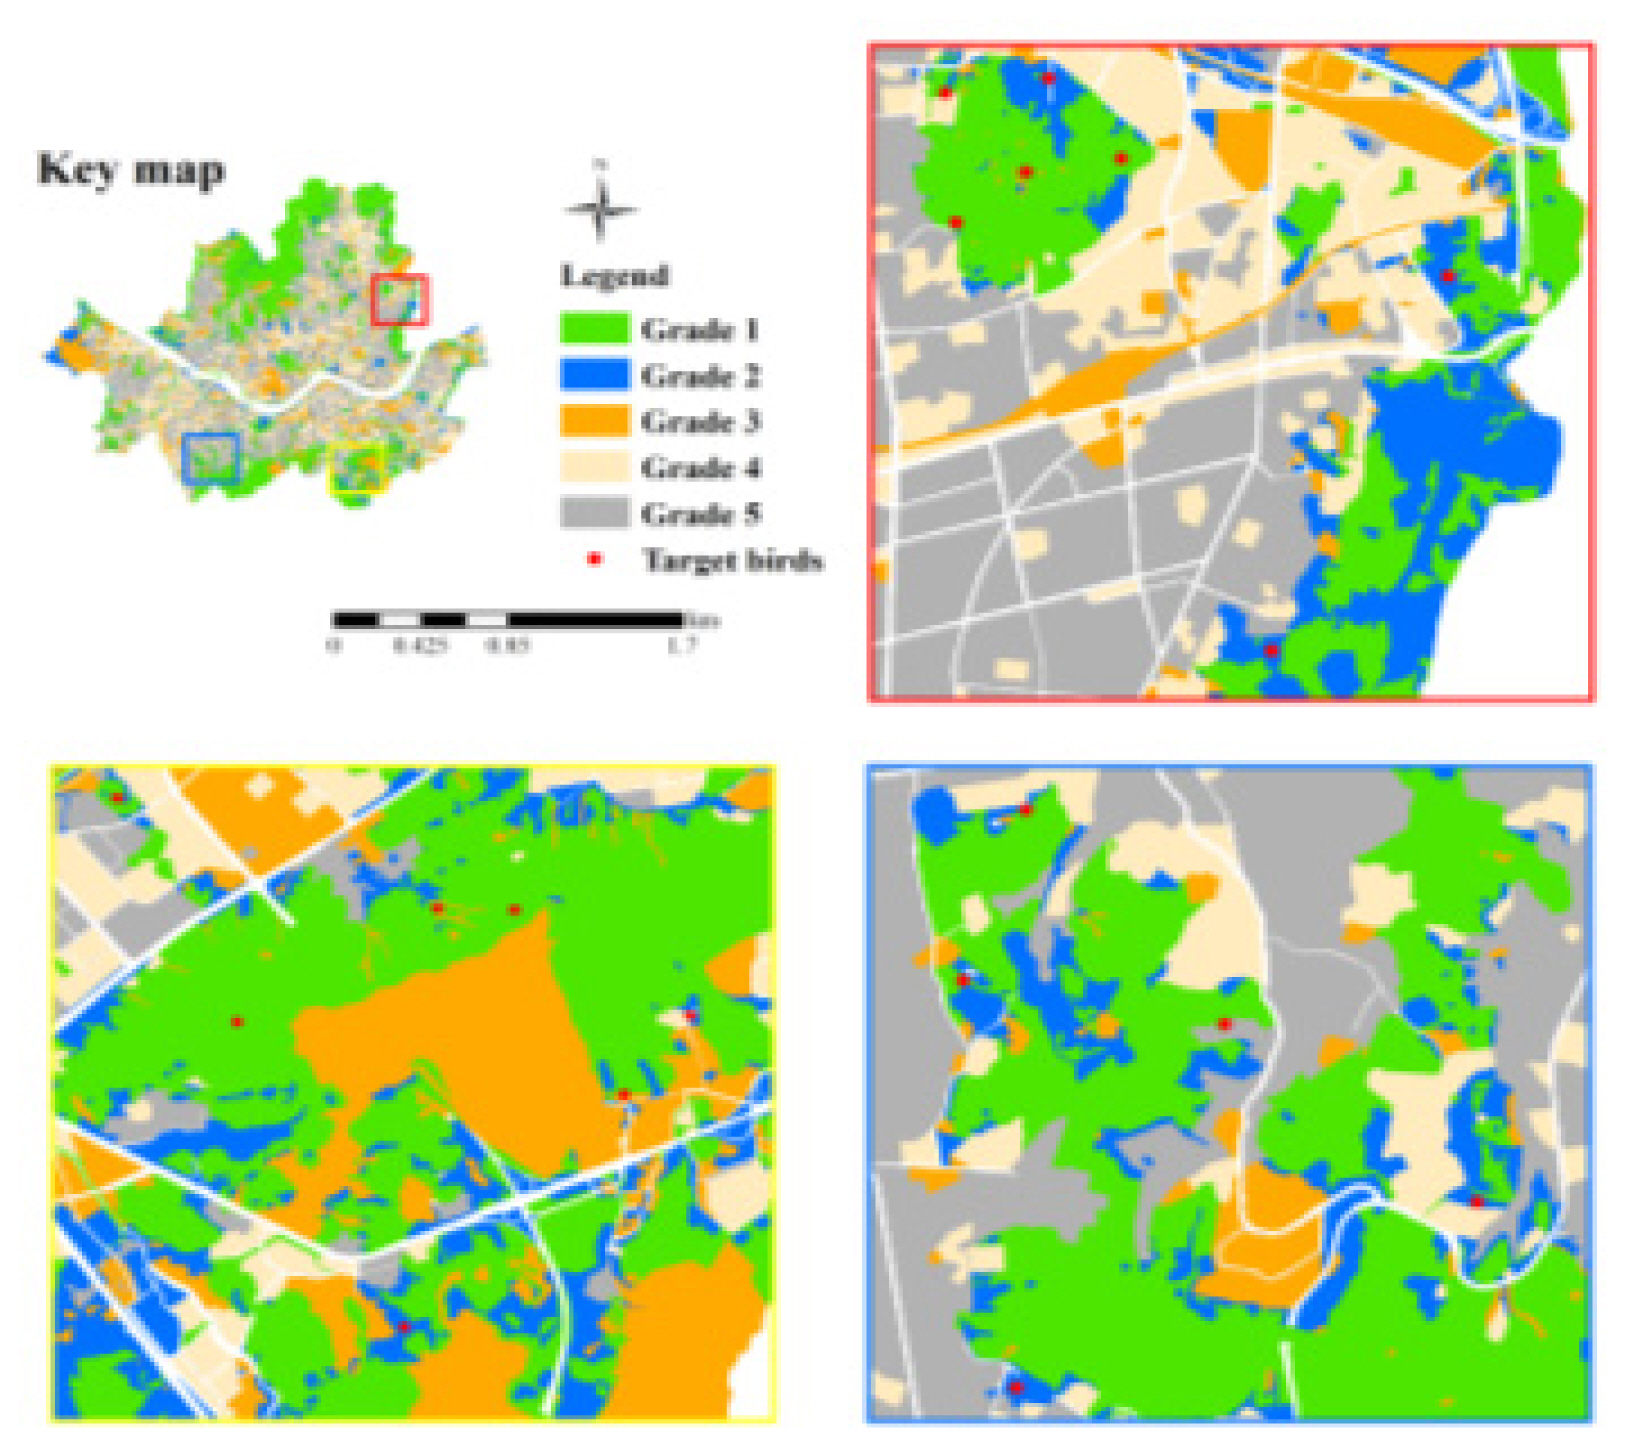
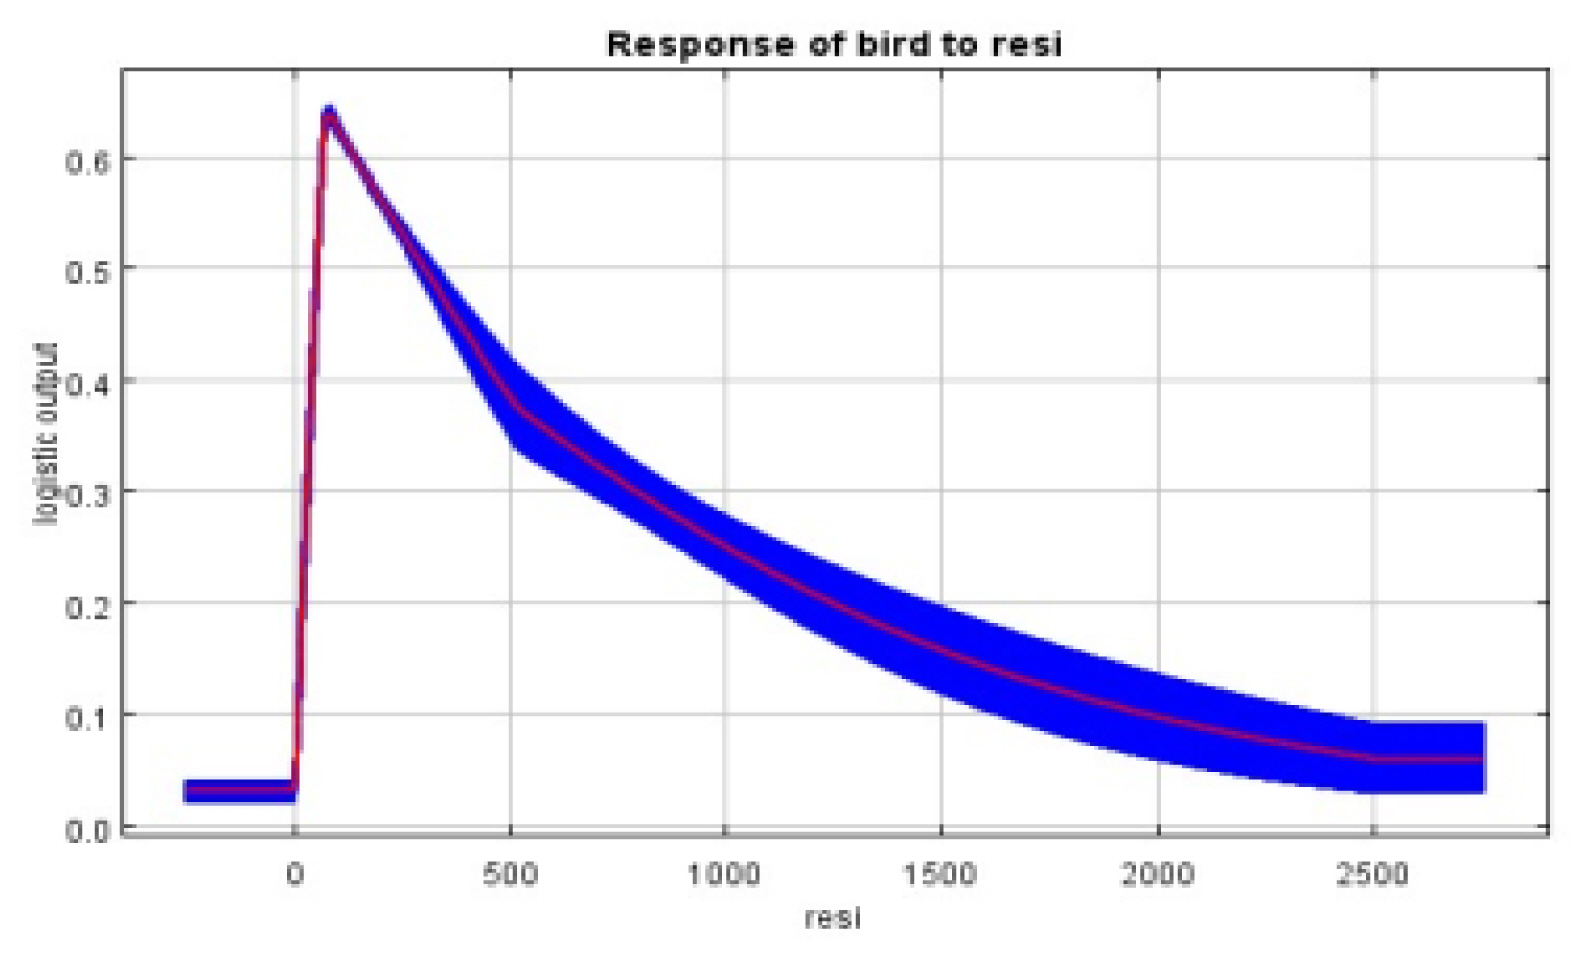
The contribution of environmental variables to potential habitat analysis showed high values for variables such as biotope grade, distance from residential areas, and distance from forests (Table 2). The results indicate a close association between the biotope grade, residential areas, and forested areas for the target birds in Seoul. When observing the correlation graph between potential habitats of target birds in Seoul and environmental variables, the probability of occurrence was highest in biotope Grade 2 areas (Fig. 3). The reason for the highest probability of occurrence being in Grade 2 rather than Grade 1 is the largest number of 396 occurrence points among the bird protection species occurred in Grade 2 areas (Table 3). Examining the expanded map of the biotope grade, Grade 2 areas connect the ecological functions between Grade 1 areas, leading to the occurrence of many target species (Fig. 4).
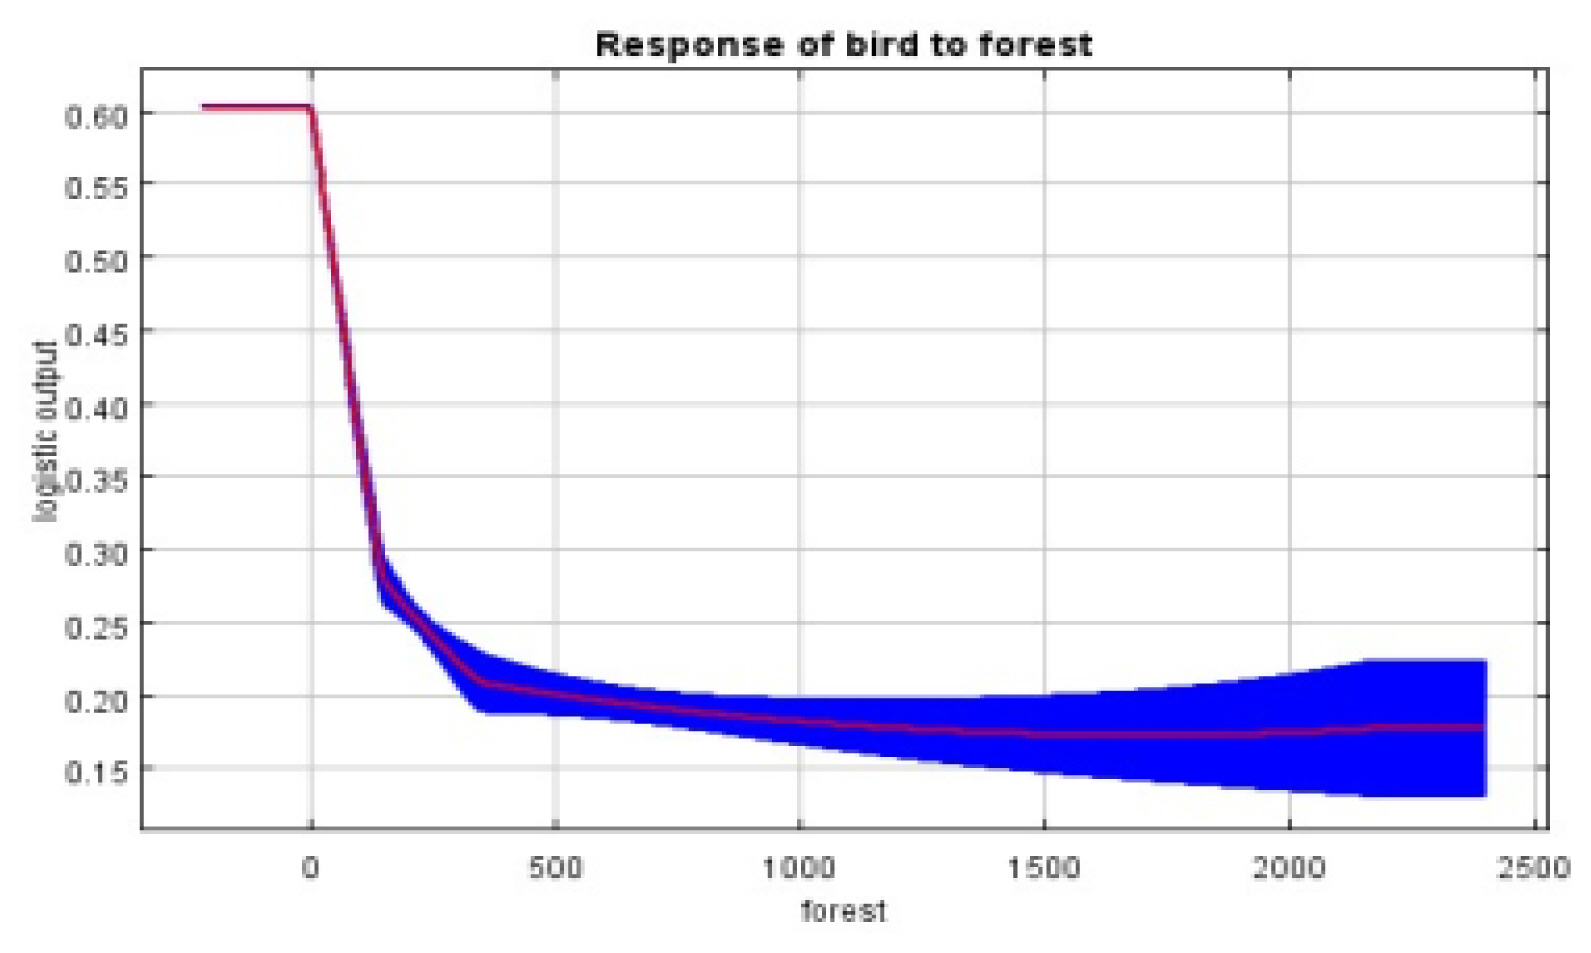
For the residential area variable, the potential habitat probability was high in areas located approximately 50m to 300m away from residential areas. The reason is that residential areas contain key biotope elements such as natural green spaces, artificial green spaces, and landscaped areas, which birds prefer, and these elements are typically situated within the range of 50 to 300 meters (Fig. 5). In the case of forest areas, the probability of potential habitat decreased as the distance from forest areas increased (Fig. 6). Particularly, there was a sharp decline in the probability of potential habitat up to around 200m, indicating that proximity to forested areas is crucial for potential bird habitats.
Rating change analysis results
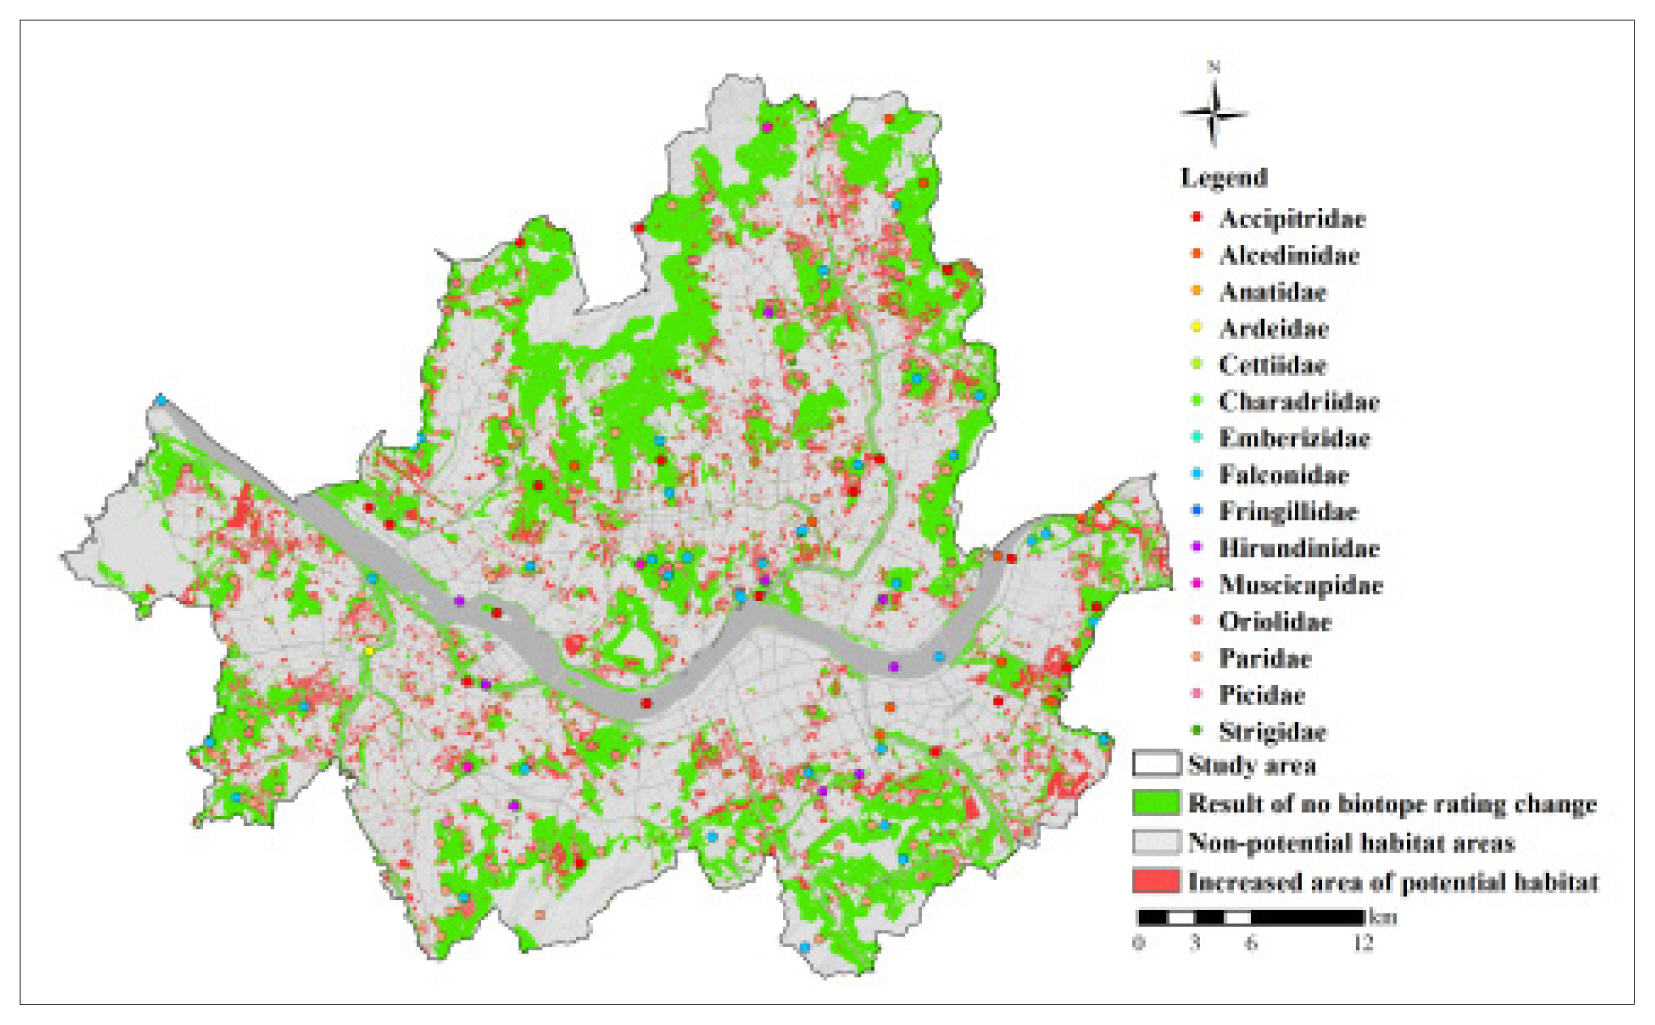
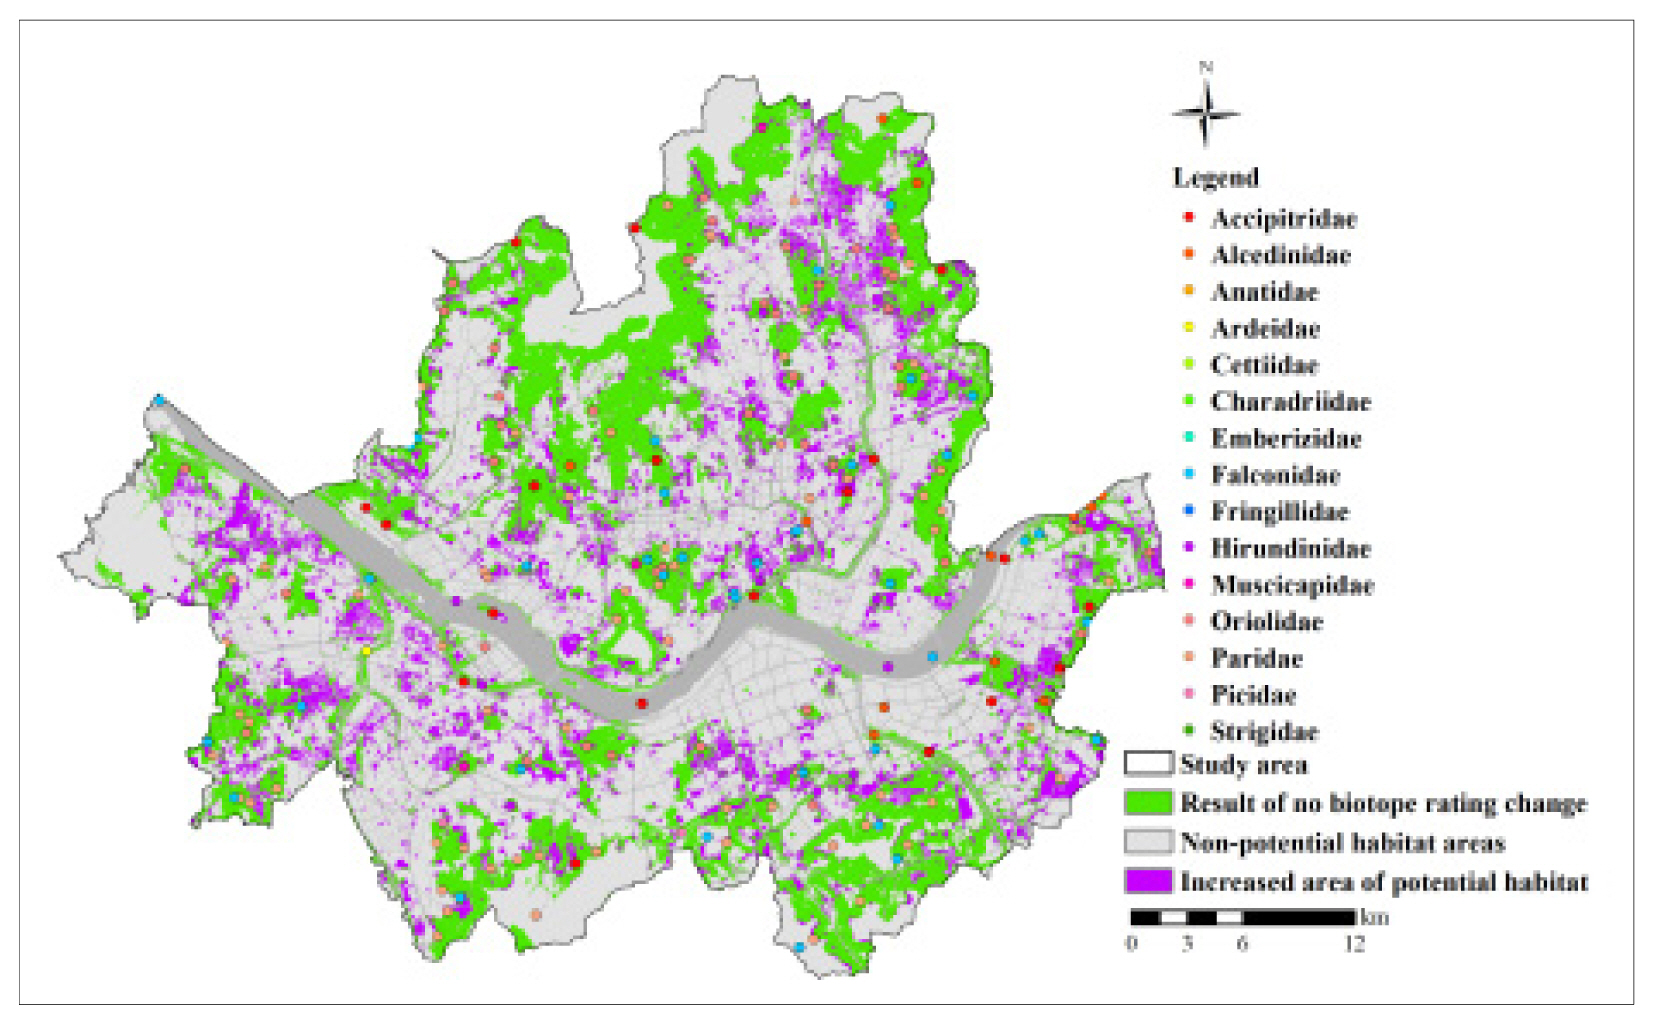
Analysis results of avian conservation species suitable habitats in response to changes in Seoul’s biotope grades show that when upgrading Grade 2 areas to Grade 1, the potential habitat area increased by 22% compared to the original analysis (Fig. 7). When upgrading Grade 3 areas to Grade 2, the potential habitat area increased by 19% compared to the original area (Fig. 8). When upgrading both Grade 2 and Grade 3 areas to Grade 1, the potential habitat area increased by 42% compared to the original area (Fig. 9). The expanded potential habitat areas were mainly observed around forested areas and near residential areas.
The increase in potential habitat area due to the improvement of the biotope grade is attributed to the expansion of spaces preferred by birds. While Grade 2 areas were already spaces favored by birds even before the grade change, the increase in Grade 1, which is the most suitable habitat for flora and fauna, likely provided an even more favorable environment for habitation. The significant increase in potential habitat area is attributed to transforming the existing Grade 2 areas into Grade 1, indicating a substantial expansion of spaces with a high likelihood of bird habitation. Similarly, the potential habitat area is also anticipated to expand when adjusting the existing Grade 3 areas to Grade 2 or upgrading both Grade 2 and 3 areas to Grade 1.
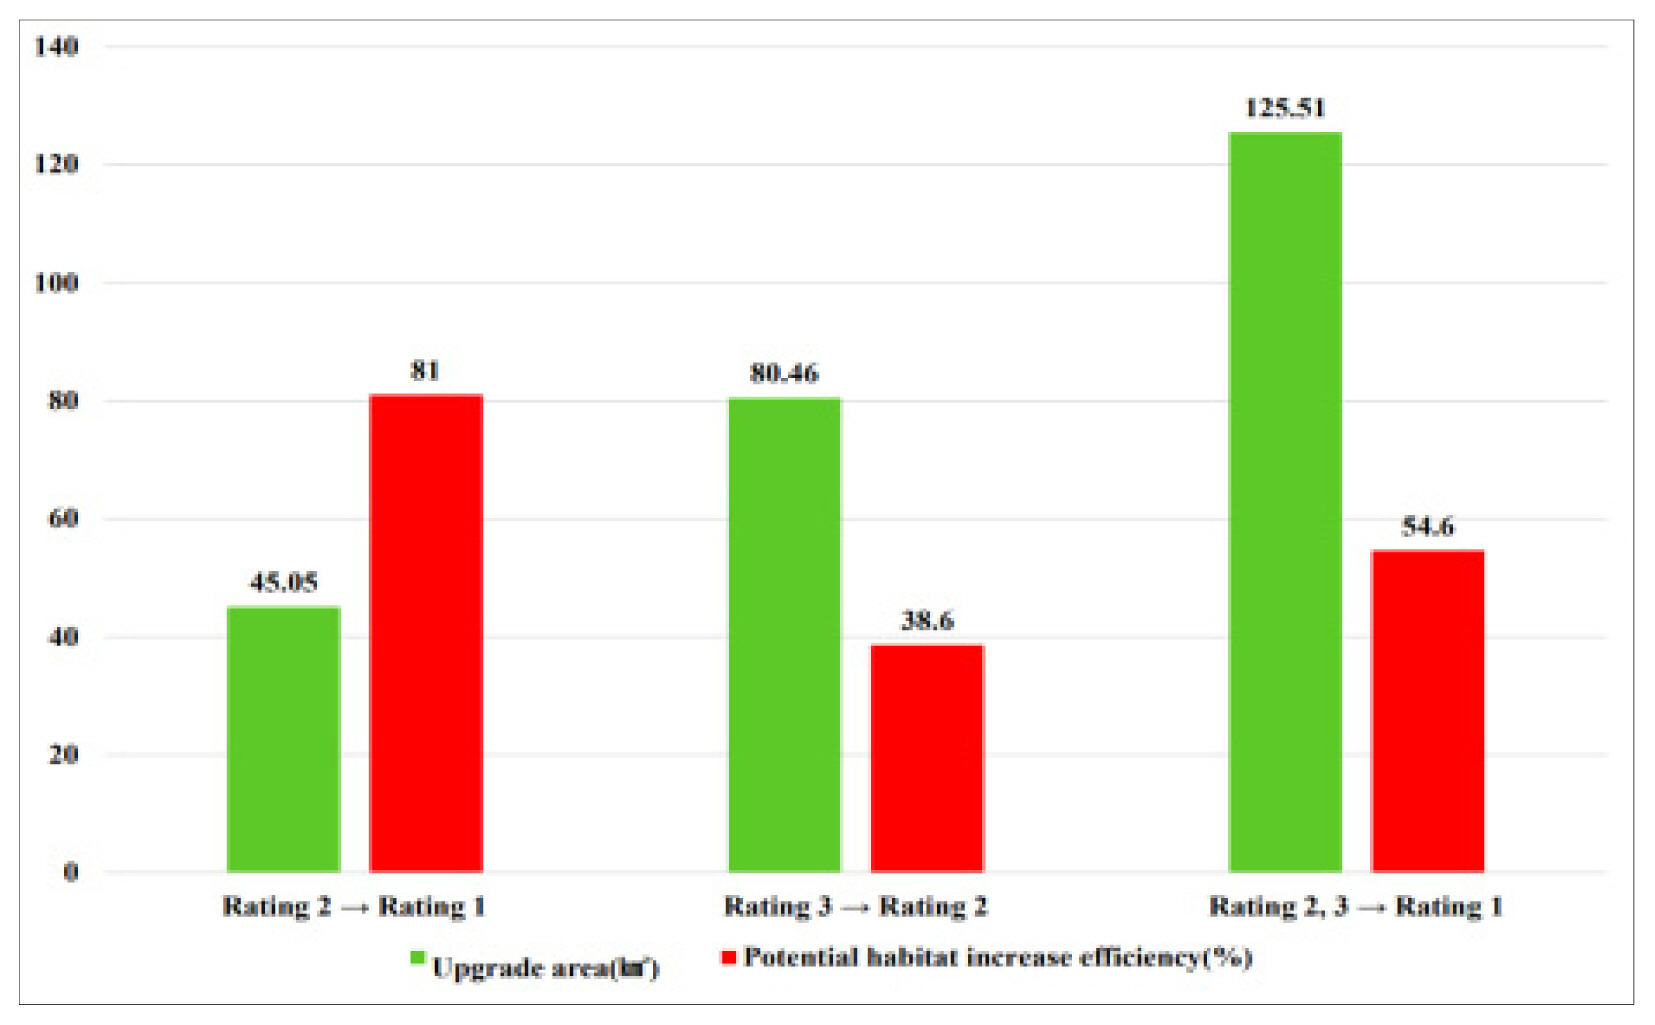
As mentioned earlier, the scenarios of upgrading the biotope grades resulted in varying proportions of increased potential habitat area compared to the existing conditions. To assess the efficiency of the increase in potential habitat due to the improvement of biotope grades, the areas where the biotope grades were enhanced were compared to the increased potential habitat area, and the ratio was calculated. The area of the second-grade region upgraded to first-grade is 45.05km2, and the efficiency of increased potential habitat due to the improvement in biotope grades is 81%. The area of the third-grade region upgraded to second-grade is 80.46 km2, and the efficiency of increased potential habitat due to the improvement in biotope grades is 38.6%. The area of the second and third grade regions upgraded to the first grade is 125.51km2, and the efficiency of increased potential habitat due to the improvement in biotope grades is 54.6%. Therefore, it was determined that the efficiency of increased potential habitat is the highest when upgrading the second-grade region to the first-grade (Fig. 10).
According to the analysis of scenarios for improving the biotope grade, it is anticipated that the elevation of the biotope grade will expand potential bird habitats within the city. Particularly noteworthy is the substantial increase in potential bird habitats in all scenarios, indicating that efforts to improve the biotope grade are crucial in securing bird habitats within the city. However, due to limitations in socio-economic costs, it is impractical to improve the grade of all biotopes. Therefore, it is deemed necessary to adopt an efficient approach to improve the grade of biotopes in areas with a high potential for habitat expansion, considering factors such as proximity to existing habitats and connectivity with other habitats. To achieve this, it is essential to integrate research such as the spatial exploration of avian habitats and connectivity analysis based on occurrence information (Song, 2017).
Conclusion
This study analyzed potential habitat changes for 15 target birds in Seoul due to changes in the biotope rating. The results revealed that potential habitats for bird species in Seoul are predominantly found in large natural forested areas on the outskirts of the city and small green spaces in urban areas. This indicates that biodiversity is being maintained even in urban areas. It was confirmed that the biotope rating, distance from residential areas, and distance from forests significantly impact the potential habitats of target birds. Notably, there was a tendency for the probability of potential habitats to increase as the distance from residential areas decreased, and the distance from forests decreased. Results of the biotope rating change scenario analysis showed that the efficiency of increasing potential habitats compared to the existing area was 81% when changing second-grade areas to first-grade, 38.6% when changing third-grade areas to second-grade, and 54.6% when changing second and third-grade areas to first-grade. Therefore, it can be inferred that an increase in the biotope rating may provide more habitats for biodiversity within the city, confirming the significance of biotope rating changes as a crucial factor influencing changes in species habitats.
Through the analysis conducted in this study, it was possible to recognize that changes in biotope ratings (i.e., efforts for the restoration and conservation of urban ecosystems are crucial elements in adapting to environmental changes caused by urbanization and maintaining the health of urban ecosystems. Limitations of this study include the failure to consider the potential impact of different environmental variables on specific bird species. Additionally, there was a lack of consideration for additional environmental variables, such as meteorological factors, that could influence habitat preferences. For future research, developing a more comprehensive and accurate model for evaluating the efficiency of biodiversity grade change scenarios is crucial. This could be achieved through studies encompassing a broader range of regions and protected species, allowing for a more in-depth analysis. The advancement of such a model is anticipated to contribute to formulating policies for the sustainable management of urban ecosystems and protected species. By demonstrating the importance of expanding, conserving, and managing higher-grade biotope areas, this study could be instrumental in devising strategies for biodiversity conservation and improving urban environments to maintain urban biodiversity and ecosystem health. In addition, it is believed that the results of this study can provide guidelines for developing strategies on how to adapt to climate change at the city level by flexibly adjusting the ecosystem within the city in preparation for climate change in the near future.