


Introduction
As the times have changed, the landscape of forests has been significantly transformed, so have peopleŌĆÖs perception of forests. The roles of forests in the past were mainly to produce fuel and lumber and to conserve the national land, but today we are living in an era where the public value of forests is 20 times higher than their net production value. As peopleŌĆÖs quality of life improves, and the public value of forests increases, the Korea Forest Service issued a guidelines for classifying and differentiating forests by function.
For the past 50 years, Korea has experienced rapid economic development and already entered an aged society, and in 2025 it is expected to become a super-aged society where over 20% of the total population is aged 65 and older. Industrialization, the foundation of economic development, has expanded urban areas and at the same time has reduced the area of forests, and people in modern society have been exposed to various environmental sources of stress, which has threatened their health (Park and Miyazaki, 2008). In particular, as the share of the aged whose immunity weakens increases, peopleŌĆÖs interest in health has continuously increased.
As aging has been accelerated, the number of people who want to visit forests has increased, and the number of recreational or healing forests has also increases annually. As of now, nine healing forests are publicly operated under the Korea Forest Welfare Institute, and seven healing forests are under creation (Korea Forest Welfare Institute, 2019). These healing forests are evenly distributed across the country. In addition, as peopleŌĆÖs interest and demand for healing forests increase, local governments and private organizations started to operate healing forests.
Currently, forests in Korea are classified into six functions, and are managed under guidelines by function. However, no official guideline has been issued yet for managing healing forests of which number has increased annually.
It is important to reflect the opinions of program operators in managing healing forests, and thus to qualitatively thin trees (Kim et al., 2015), but it is also very important to consider the density of standing trees. Lee (2011) surveyed the preferred density (three grades) of trees including Pinus densiflora, Pinus koraiensis, Hinoki cypress and Larix Kaempferi, and Shin et al. (2013) reported that people preferred 60ŌĆō80% of the density of pine forests for forest healing compared to trees for producing lumber. Arthur (1977) reported that peopleŌĆÖs visual preference in large-pole, mature stands of trees was higher than in young forests, and another study suggested that the optimum density of standing trees (DBH 20ŌĆō30cm) to secure comfortability in forests is 700ŌĆō800 trees/ha. Since the density of standing trees is an important element that affects peopleŌĆÖs perception of forest landscapes (Brown and Daniel, 1986; Brush et al., 1979; Hull and Buhyoff, 1986), it needs to be considered as an essential element in creating and managing pleasant healing forests. As such, several studies have been conducted on the management of recreational and healing forests, but most of them were fragmentary. For this reason, it is necessary to conduct more systematic studies on various species of trees.
Against this backdrop, this study aimed to review methods for managing the understory vegetation along the trails of healing forests, to determine the optimum density of various species of trees by diameter, and thus to suggest ways to manage healing forests.
Research Methods
Unlike earlier studies, this study investigated the density of standing trees in an area where the key species of trees of different diameters that grow in Korea are distributed, and selected one of the areas targeted by the forest-tending project to survey the understory vegetation through on-site and questionnaire surveys.
On-site survey
Management of understory vegetation
One of the areas where the forest-tending project was initiated is the area of standing Larix kaempferi and broad-leaved trees located in San 79-3, Majang-ri, Gwangtan-myeon, Paju-si in 2016. PeopleŌĆÖs preference for methods for managing the understory vegetation in the area was surveyed with photos taken the next year, and the area was divided into the following groups: ŌæĀ forest with no understory vegetation removed (control group), ŌæĪ forest with bad sub-trees and a part of the understory vegetation removed (about 40% removed), Ōæó forest with no flowering trees removed, but sub-trees and bad understory vegetation removed (about 50% removed), ŌæŻ forest with most of the understory vegetation removed (about 80% removed), and Ōæż forest with all the understory vegetation removed (100% removed).
Density of standing trees
To examine the density of standing trees, six major coniferous tree species that grow in Korea (Pinus densiflora, Larix kaempferi, Korean Pine, Abies holophylla, Hinoki cypress and Japanese cedar) and three broadleaf tree species (oak trees, Betula platyphylla and Liriodendron tulipifera), a total of nine species of trees were classified by diameter as follows: small-diameter (B11ŌĆō20cm), medium-diameter (B21ŌĆō30cm), large-diameter (B31ŌĆō40cm) and super-large-diameter (B41ŌĆō50cm). One standard land was selected for each species and diameter class, and a total of 29 standard lands were surveyed in the following areas: Gangneung and Inje in Gangwon-do; Gapyeong, Yangju and Paju in Gyeonggi-do; Namdong-gu in Incheon; Mungyeong in Gyeongbuk; and Jangseong in Jeonnam. The size of standard lands was 400m2 (20m├Ś20m), and all the standing trees within the standard lands were surveyed to calculate their average diameter. Elevation drawings used in questionnaire surveys were produced in 3D after recording the diameter of the standing trees at breast height and their location on a graph paper of the standard survey form.
Questionnaire survey
Subjects and analysis
To ensure at least 0.1% of the total workers in the areas associated with forestry in Korea (as of 2017, 253,000 workers) were surveyed, 330 persons were targeted, and a questionnaire survey was conducted through online surveys and door-to-door interviews. The data of 204 workers in the forestry sector and 109 ordinary people (200 males, 100 females, 13 not responded) were collected. The surveyed workers in the forestry sector included forest experts (professional engineer forestry), forestry project design and supervision (engineering), forestry construction (forestry associations and corporations), public officials in green lands, academia, researchers, forestry-related organizations, forest therapists, forest expounders, and students in forestry departments. The surveyed ordinary people were included to analyze differences in opinion between them and workers in the forestry sector.
Descriptive statistical analysis and frequency analysis were conducted on the collected data using MS Excel and SPSS programs.
Calculation of the number of trees for tree density
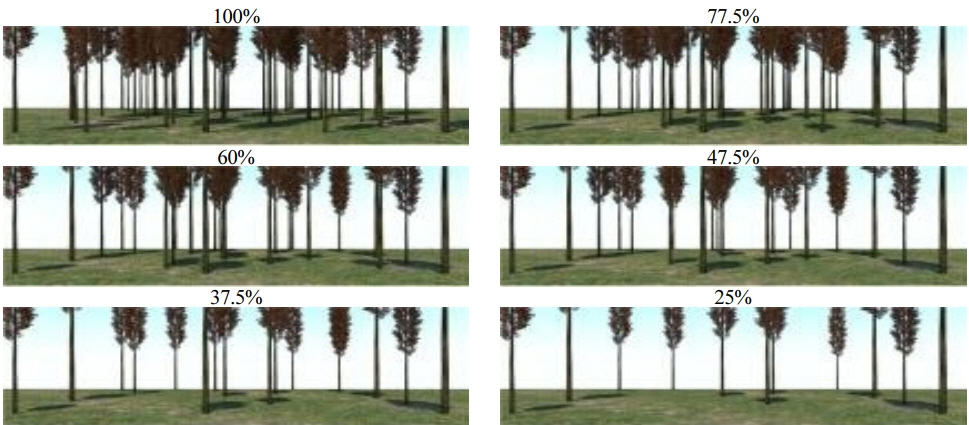
To survey their preferred density of standing trees, the number of standing trees surveyed on site was set as 100, and the thinning rate was reduced by about 20%. Images of the standard lands and six items for each diameter class were produced in 3D for the questionnaire survey. Based on the surveyed data, the preferred number of standing trees was determined using the Equation 1. In order to obtain data as accurate as possible, the number of respondents who selected Preference Ranks 1ŌĆō3 among six items was multiplied by the number of trees. The preferred number of trees for six items was calculated, and the average of the sum of tress preferred by subjects who ranked first, second and third was applied to the density per ha.
The reason why the thinning rate was reduced by 10ŌĆō20% compared to the number of trees to produce graphics was that the interval of 10~20% is the standard thinning intensity for light thinning.
(1)
where
N1: number of trees preferred by subjects who ranked first in preference/ha.
A1: number of subjects who ranked first in preference.
N2: number of trees preferred by subjects who ranked second in preference/ha.
A2: number of subjects who ranked second in preference.
N3: number of trees preferred by subjects who ranked third in preference/ha.
A3: number of subjects who ranked third in preference
ŌłæAN: total number of subjects who ranked first, second and third
Results and Discussion
Analysis of preferred spatial closure rate of understory vegetation
To analyze the preferred methods for managing the understory vegetation, forests were divided into five groups, and their photos were used in the questionnaire survey, and the results were as shown in Table 1. The preferred methods were surveyed as follows: Forest with flowering trees preserved, but 50% understory vegetation removed (41.5%) > forest with 40% of the understory vegetation removed (36.8%) > forest with 80% of the understory vegetation removed (12.1%) > forest with all the understory vegetation removed (4.8%) > forest with no understory vegetation removed (2.6%). There was no difference in opinion between workers in the forestry sector and ordinary people. Overall, over 78% of respondents were found to prefer forests with bad sub-trees and 40ŌĆō50% of the understory vegetation removed without removing flowering and landscape trees.
The understory vegetation in forests is significantly affected by the crown density of upper trees. In other words, since the shrub layer is highly related with upper trees, the species diversity of forests decreases over time, and the herbaceous layer is affected by the shrub layer (Cheon et al., 2014).
Based on the surveyed and analyzed results above, methods for managing the understory vegetation in healing forests can be suggested as follows. Since the density of standing trees significantly affects the understory vegetation, it is necessary to remove bad sub-trees and determine whether to leave flowering trees in the understory vegetation such as Rhododendron mucronulatum based on their conditions while controlling the density of the upper layer in healing forests. Meanwhile, when thinning or tendering forests, the understory vegetation is often damaged. For this reason, when removing damaged trees, fallen or broken trees, trees that block the landscape and bad trees, about 50ŌĆō60% of the understory vegetation naturally remains. When it is difficult to maintain the level, it is necessary to artificially remove some part of the underlying layer to leave 50ŌĆō60% only.
Analysis of preference depending on density of standing trees and crown density
Density of standing trees by species and diameter class
The density of standing trees in 29 standard lands for nine different species was surveyed, When the thinning rate was reduced by 10ŌĆō20%, the number of standing trees was as shown in Table 3. Based on the results, a total of 174 3D images for different species, diameter classes and residual rates were produced to survey subjectsŌĆÖ preference for the density of standing trees (Fig. 2).
Analysis of preference for density of standing trees by species and diameter class
A questionnaire survey was conducted with graphic images for individual standard lands and six items, and the number of respondents who ranked 1stŌĆō3rd in preference was multiplied by the number of trees to calculate their preferred number of standing trees as shown in Table 4. In the case of Pinus koraiensis of 18cm in diameter at breast height, workers in the forestry industry and ordinary people were found to prefer 575 and 580 trees per ha respectively, and thus 580 trees were applied. As shown in Table 4, there was no significant difference in opinion between them, and the applied number of trees was determined by rounding it off to the nearest integer.
As shown in Table 4, in the case of broadleaf trees such as Quercus acutissima, Liriodendron tulipifera and Betula platyphylla, respondents were found to prefer them within the same diameter group in the following order: Betula platyphylla > Liriodendron tulipifera > Quercus acutissima. The results can be attributed to the fact that Betula platyphylla that has white bark tends to look more beautiful when its density is high. In addition, the branch angle of Liriodendron tulipifera is smaller than that of Quercus acutissima, and thus its crown width is smaller and its trunk is straight. For this reason, respondents seemed to prefer the higher density for Liriodendron tulipifera compared to Quercus acutissima. In the case of Larix kaempferi, Cryptomeria japonica and Cryptomeria japonica among coniferous trees, respondents were found to prefer them within the same diameter group in the following order: Cryptomeria japonica > Cryptomeria japonica > Larix kaempferi. In the case of Chamaecyparis obtusa that has a similar shape, it was difficult to directly compare it with others as there was no species that has a similar diameter, but it was found that respondents preferred Chamaecyparis obtusa with the similar density to Cryptomeria japonica. Meanwhile, in the case of Pinus densiflora and Pinus koraiensis that have a wider crown width than the four coniferous trees above, respondents preferred a lower density, and the preferred density of Pinus koraiensis was smaller than that of Pinus densiflora.
Conclusion
The results of the questionnaire survey on the management of the understory vegetation in healing forests showed that over 78% of respondents preferred forests with bad sub-trees and 40ŌĆō50% of the understory vegetation removed without removing flowering and landscape trees. This was commonly observed between workers who directly managed forests or were involved in the forestry sector and ordinary people. Based on these results, it is recommended to leave flowering and landscape trees as much as possible and remove 40~50% of the understory vegetation when tending healing forests. As a method for managing the understory vegetation, this study suggests to leave flowering and landscape trees and ecological trees in the understory vegetation, and to remove or thin trees that damage forests, damaged, fallen or broken trees, trees that block the landscape and bad trees, leaving about 50ŌĆō60% of the understory vegetation.
In addition, the optimum density of standing trees of nine species was surveyed, and in the case of broadleaf trees, respondents were found to prefer them within the same diameter group in the following order: Betula platyphylla > Liriodendron tulipifera > Quercus acutissima. In the case of coniferous trees, Larix kaempferi, Cryptomeria japonica and Cryptomeria japonica that have a similar shape were surveyed, and respondents were found to prefer them within the same diameter group in the following order: Cryptomeria japonica > Cryptomeria japonica > Larix kaempferi. In the case of Pinus densiflora and Pinus koraiensis that have a wider crown width, respondents preferred a lower density than other needleleaf trees, and the preferred density of Pinus koraiensis was smaller than that of Pinus densiflora.
The optimum density for standing trees differed depending on the diameter and species of trees, and the wider the crown width of trees, the lower density people tended to prefer. Therefore, when tending healing forests, it seems to be effective to vary their density depending on their species and diameter class and to perform light thinning of 10ŌĆō20% regularly.
The optimum density of the nine species surveyed in this study was listed in Table 4. Since healing forests are composed of various tree species, it will be necessary to conduct more studies on the direction for creating the understory vegetation in healing forests and the optimum density of various tree species.