Development of Diameter Growth Models by Thinning Intensity of Planted Quercus glauca Thunb. Stands
Article information

Abstract
Background and objective
This study was conducted to develop diameter growth models for thinned Quercus glauca Thunb. (QGT) stands to inform production goals for treatment and provide the information necessary for the systematic management of this stands.
Methods
This study was conducted on QGT stands, of which initial thinning was completed in 2013 to develop a treatment system. To analyze the tree growth and trait response for each thinning treatment, forestry surveys were conducted in 2014 and 2021, and a one-way analysis of variance (ANOVA) was executed. In addition, non-linear least squares regression of the PROC NLIN procedure was used to develop an optimal diameter growth model.
Results
Based on growth and trait analyses, the height and height-to-diameter (H/D) ratio were not different according to treatment plot (p > .05). For the diameter of basal height (DBH), the heavy thinning (HT) treatment plot was significantly larger than the control plot (p < .05). As a result of the development of diameter growth models by treatment plot, the mean squared error (MSE) of the Gompertz polymorphic equation (control: 2.2381, light thinning: 0.8478, and heavy thinning: 0.8679) was the lowest in all treatment plots, and the Shapiro-Wilk statistic was found to follow a normal distribution (p > .95), so it was selected as an equation fit for the diameter growth model.
Conclusion
The findings of this study provide basic data for the systematic management of Quercus glauca Thunb. stands. It is necessary to construct permanent sample plots (PSP) that consider stand status, location conditions, and climatic environments.
Introduction
Last year, the South Korean government announced its strategy to respond to climate change by declaring its policy goal of “Carbon Neutrality by 2050.” However, when the temperature rises by 2°C or more due to climate change, it is expected that the distribution of coniferous forests in Korea will rapidly decrease, and those forests will be on the verge of extinction in the future. The impact of climate change will not only change the composition and structure of forest ecosystems, but also ultimately change their functions, thereby reducing the various public values and ecosystem service functions of forests. The selection of tree species for afforestation that can respond to such changes should be made carefully, and rational management should be carried out by setting a production goal that is suitable for the growth characteristics of various tree species.
Quercus glauca Thunb. (QGT), a broad-leaved evergreen distributed in the temperate forests of Korea, is a warm-temperate tree species that grows naturally at altitudes of 600 m or less in southern coastal regions, such as Jeju Island and the Jeollanam-do coastal region. The tree species is also known as one of economic tree species that can be used as materials for construction, ships, and musical instruments, and they are also planted in gardens and parks (Shin et al., 2006). According to Choi et al. (2016), the average above-ground biomass of QGT stands was 145.5 Mg ha−1, higher than that of Machilus thunbergii Siebold & Zucc. stands (123.7 Mg ha−1), a forest of broad-leaved evergreens of similar age group, which was investigated in Wando, Korea (Lee and Kim,1988), and the findings showed that the species is suitable as a carbon sink. In addition, QGT was found to serve as a better carbon sink than Cryptomeria japonica and Chamaecyparis obtusa, which are major coniferous species in Korea, based on the findings that the average biomass of the two species was 95.5 Mg ha−1and117.7 Mg ha−1, respectively (Kim et al., 2020).
Recently, as interest in warm-temperate tree species has increased due to climate change, various studies have been conducted on QGT, which has relatively high cold resistance compared to other warm-temperate broadleaf evergreen species (Jung et al., 2014). Park (2007) and Purohit et al. (2009) investigated the survival rate according to seed germination rate, transplantation period, and tree age. Cho et al. (2014) and Lee (2019) also conducted studies on the physiological characteristics and growth performances of container seedlings of QGT, based on different types of fertility treatments. In addition, Son et al. (2014), Jeong et al. (2014), and Choi et al. (2016) presented the basic wood density and biomass production of QGT, and Hong et al. (2016) provided information on the physical and mechanical properties of QGT. Most of the studies on systematic forest tending and management technology development, which were conducted to explore resource utilization for QGT stands, have been limited to natural forests. Conversely, experimental studies are in progress to explore the stages of reforestation and the tending of young growth in planted forests. There are few experimental studies that estimate growth functions in the thinning stage of planted forests of warm-temperate, broad-leaved evergreens in Korea. The estimation of growth functions including diameter, dominant tree height, and volume related to the thinning of planted forests can be made based on stand density management diagrams prepared for Pinus densiflora (Jung et al., 2015; Park et al., 2016) and Chamaecyparis obtusa (Park et al., 2018), for which large-scale afforestation has been carried out. In particular, it is difficult to find the results of growth model estimates for each level of treatment for the first thinning of planted QGT stands in Korea. Since the development of such growth models enables the prediction of both past and future growth patterns through growth curve estimations, they can be used as data for rational forest tending and management, based on the production goals of the targeted stands. Therefore, this study was conducted to develop a diameter growth model for those stands that were to be subjected to initial thinning treatment in the planted forests of QGT, which is a major species of warm-temperate, broad-leaved evergreens, to determine the production goals for each treatment plot and to provide the data necessary for systematic management.
Materials and Methods
Experimental Site Status
To determine the effect of diameter growth in planted forests of warm-temperate, broad-leaved evergreens, we tried to estimate an optimal diameter growth model for the permanent sample plot (PSP; 0.9 ha) of planted QGT stands to be subject to initial thinning. The PSP was located at San 133-2, Dongsan-ri, Sangni-myeon, Goseong-gun, Gyeongsangnam-do (N 34° 57′ 53.38″, E 128° 10′ 35.55″). The PSP is a national forest that falls under the jurisdiction of the western branch of the Korea Forest Service, where 0–2-year-old seedlings were planted at a density of 5,000 trees ha−1 in 1988, and those were adjusted to a density of 2,500 trees ha−1 by tending young grow thin1998. The PSP was subjected to initial thinning in 2013, and was subdivided into treatment plots (heavy thinning [HT] and light thinning [LT] treatment plots) and a control plot. For heavy and light thinning treatment plots, low thinning was performed by 30% and 15% of the volume, respectively, using quantitative methods. A buffer zone of more than the average tree height (10 m) was created between treatment plots.
Material Collection
To analyze the tree growth and trait response according to thinning treatments, in July 2014 and May 2021, the years after the treatment was implemented, three standard plots of 20 m×20 m (0.04 ha) were set for each treatment plot. For all individual trees in the standard plots, a tree survey was performed and included the diameter of basal height (DBH) and tree height. In addition, to develop a diameter growth model based on an annual ring analysis, six standard trees were selected for each treatment plot using the arithmetic mean diameter method; the cores were sampled and an analysis of the width of annual rings was performed.
Diameter Growth Model Development
For the development of a diameter growth model in this experiment, the measured annual ring widths of core samples analyzed for each treatment plot were used to estimate the diameter growth depending on increases in tree age, on which a model fitting process was performed using the algebraic difference equation. The growth model was developed using algebraic difference equations, such as various sigmoid forms of anamorphic and polymorphic projection equations, which included Schumacher (Schumacher, 1939; Woollons et al., 1988; Clutter and Jones, 1980), Chapman-Richards (Pienaar and Turnbull 1973), Gompertz (Whyte and Woollons, 1990), and Hossfeld (Table 1).
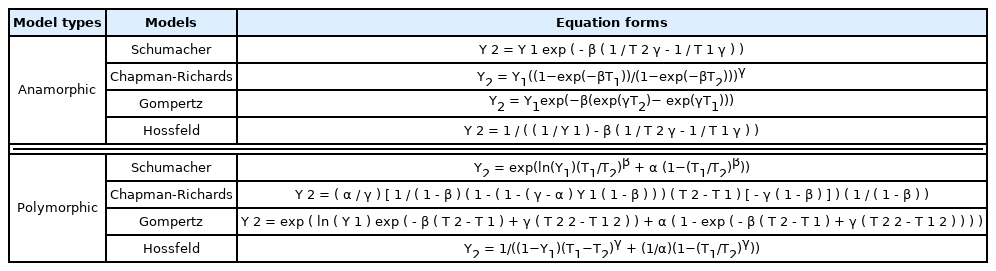
General forms of anamorphic and polymorphic projection equations
Statistical Analysis
One-way analysis of variance (ANOVA) was performed using SAS (Statistic Analysis System) 9.4 software to analyze the growth and traits for each first thinning treatment of the planted QGT stands. In addition, the non-linear least squares regression method of the PROC NLIN procedure was used to develop a diameter growth model of the PSP.
Results and Discussion
Growth Characteristics Before and After the First Thinning Treatment and Between Treatments
By analyzing changes in growth and traits before and after the first thinning treatment, for both the HT and LT treatment plots, respectively, the average DBH increased by 3.4 cm and 3.2 cm, the average tree height increased by 1.4 m and 0.9 m, and the height-to-diameter (H/D) ratio decreased by 14.0% and 11.5%, indicating that stability was improved. This is considered to be the result of removing recessive and overtopped trees through low thinning from below. Based on an analysis of growth and traits for each treatment plot in 2014, there was no significant difference in the average DBH, tree height, and H/D ratio between treatment plots (p > .05). The control plot had the highest stand density, basal area, and stand volume, followed by the LT treatment plot and the HT treatment plot (Table 2).
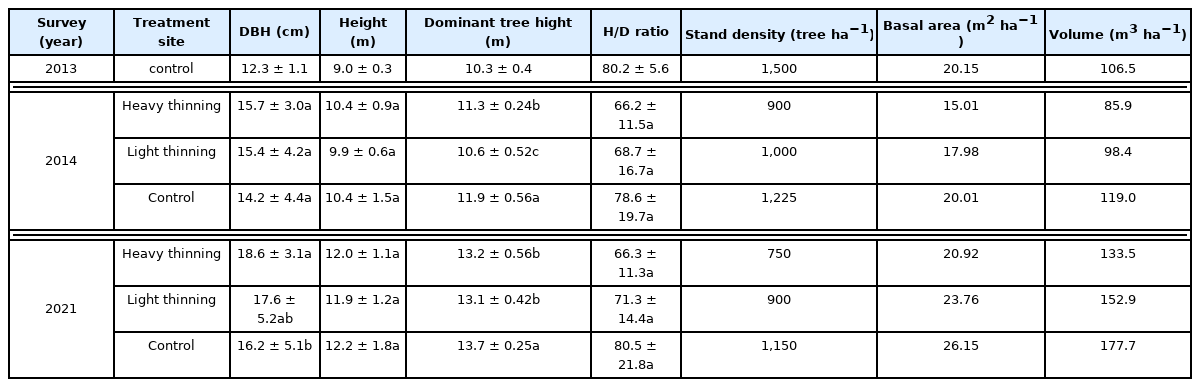
Comparisons of growth change based on thinning intensity at the individual tree level
According to an analysis of 2021 forestry survey data, the average DBH growth was found to be significantly greater in the LT treatment plot (2.9 cm) than in the control plot (2.0 cm; p < .05), showing the effects of thinning with time. These results (i.e., DBH growth ≥ 4 mm in the HT treatment plot and ≥ 3 mm in the control group) show trends similar to those reported by Jung et al. (2015), who described the thinning effects on the Quercus acuta stand. Jung et al. (2015) reported that the annual DBH growth after thinning was about 5 mm in the HT treatment plot and 2 mm in the control group. There was no significant difference in the average tree height between treatment plots (Table 2). The H/D ratio decreased with increases in DBH growth after thinning, but showed no significant difference (p > .05). For stand density, basal area, and stand volume, as in the 2014 survey results, the control group had the highest level, followed by the LT and HT treatment plots. This result was considered to be due to the fact that differences in the number of trees between the treatment plots resulted from thinning ratio had a greater effect than diameter growth according to thinning effect.
Diameter Growth Model Development
Control Plot
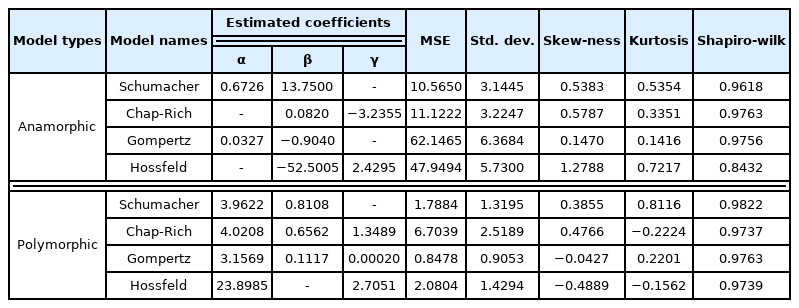
To develop a diameter growth model of the control group, the anamorphic and polymorphic equations were fitted to the annual ring analysis data, and the Shapiro–Wilk statistic, which is the criterion for determining normality, was 0.95 or higher for all equations excluding the Hossfeld anamorphic equation (0.9315), indicating that it followed a normal distribution. For the mean squared error (MSE), which is the criterion used to evaluate model fit, all polymorphic equations were analyzed as being lower than the anamorphic equations, indicating that the fit was high. The MSE for the polymorphic equations was low, and these were as follows: Gompertz (2.2381), Schumacher (3.5254), Hossfeld (3.6083), and Chapman-Richards (7.8950). Therefore, the Gompertz polymorphic equation, which demonstrated the best fit, was selected as the diameter growth model equation for the control plot (Table 3). According to Kim et al. (2011) diameter and basal area growth model for Larix leptolepis in Jeollabuk-do, Eastern Mountain Areas, the MSE for the polymorphic equations was found to be in the range of 2.855–6.366, showing similar error range characteristics to those of this study, although there were some limitations in the ability to make a direct comparison.

Residual statistics for the anamorphic and polymorphic equations fitted to the DBH of the control plot
Table 3 shows the statistics for the Gompertz polymorphic equation, which was selected as the most suitable equation for a diameter growth model for the control group. In addition, as the residual distribution of predicted values estimated from the equation demonstrated homoscedasticity, the equation was deemed to be appropriate for the model (Table 4, Fig. 1).
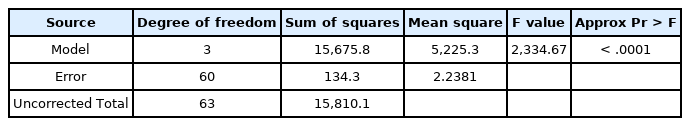
Non-linear squares summary statistics for the Gompertz polymorphic equation fitted to the DBH of the control plot
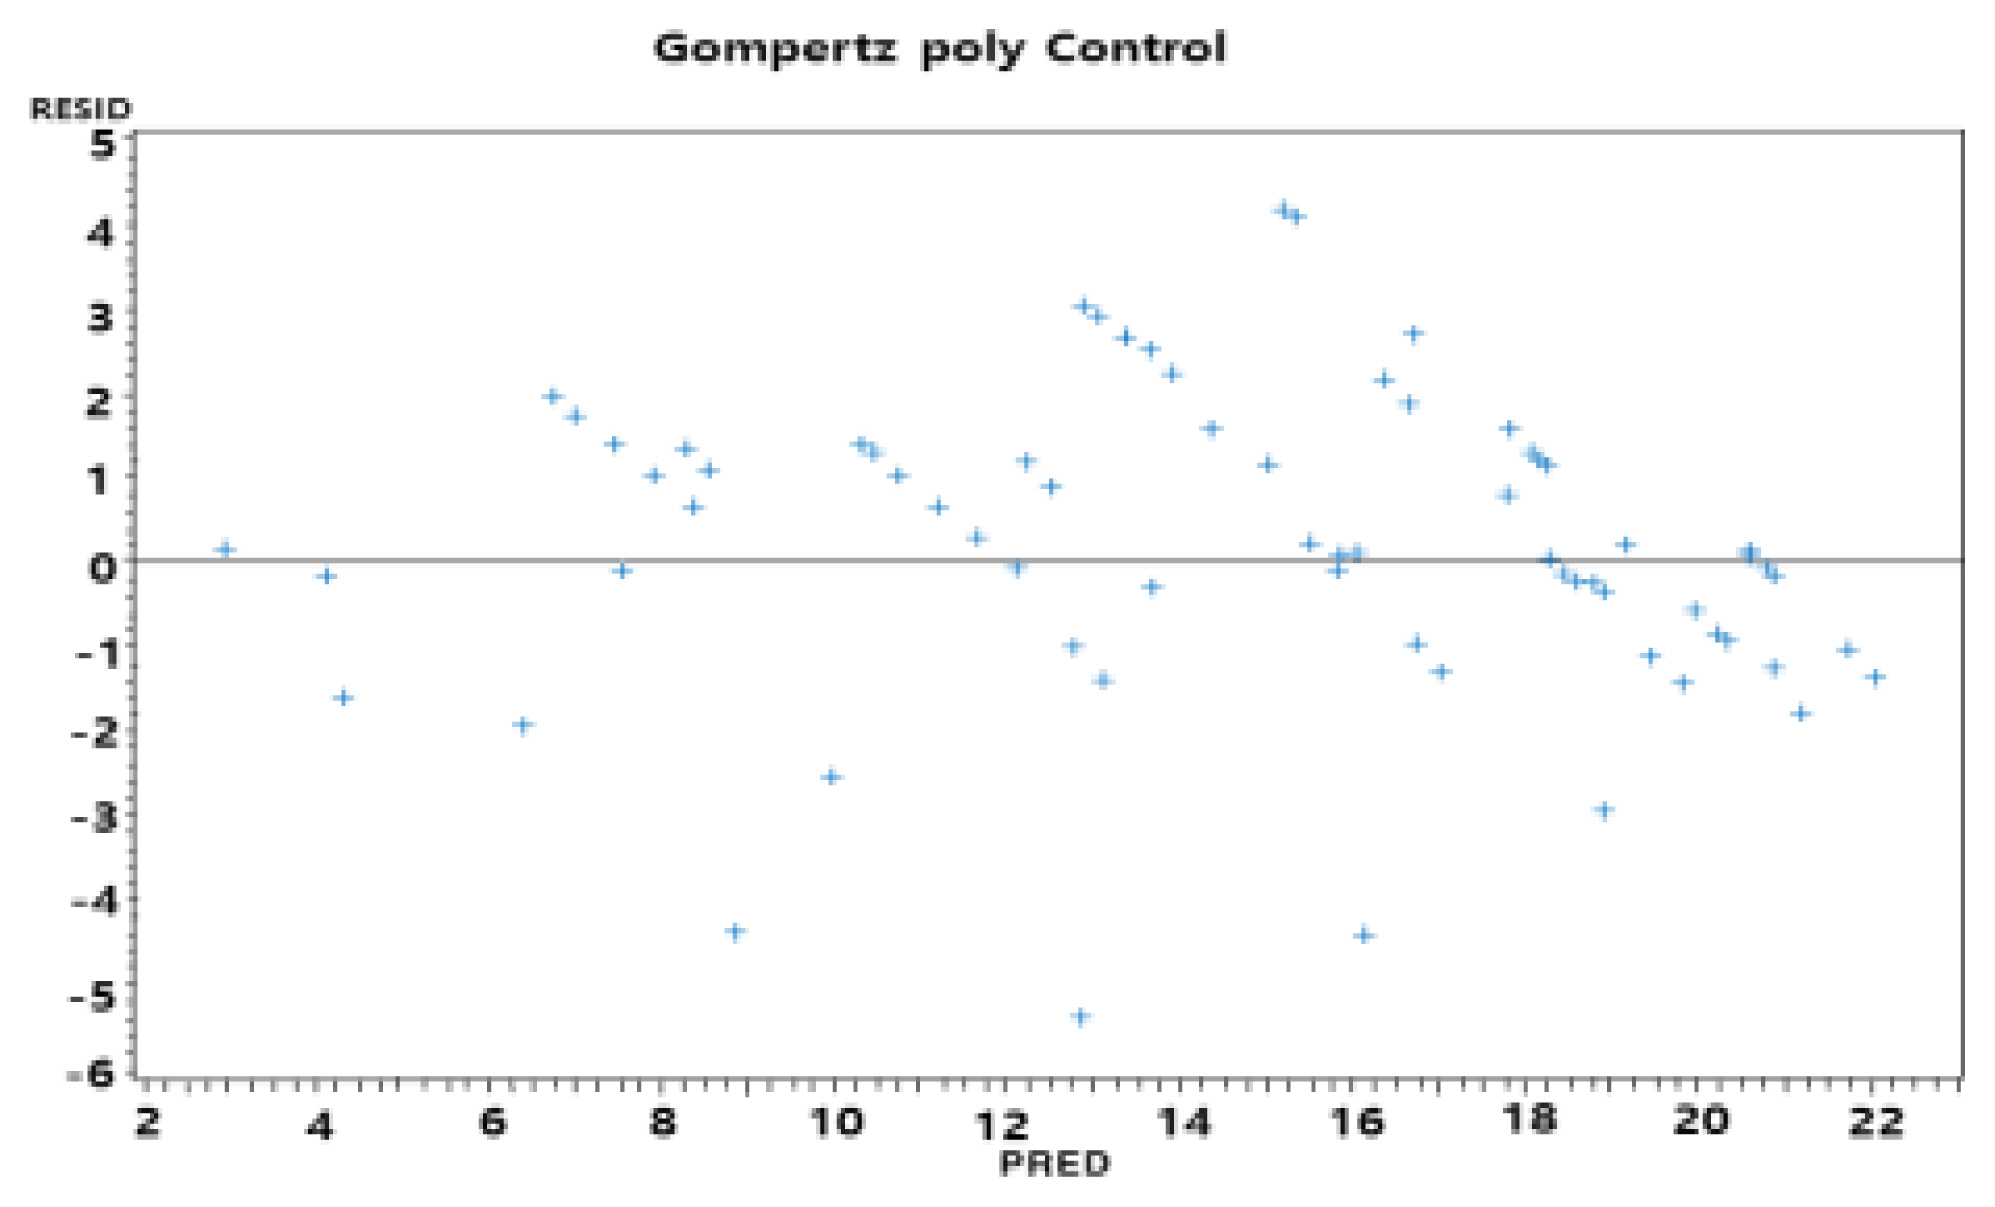
Plot of residuals versus predicted values for the Gompertz polymorphic equation fo the control plot.
LT Treatment Plot
To develop a diameter growth model of the LT treatment plot, the anamorphic and polymorphic equations were fitted to the annual ring analysis data, and the Shapiro–Wilk statistic, which is the criterion for normality, was ≥ 0.95 for all equations excluding the Hossfeld anamorphic equation (0.8432), indicating that it followed a normal distribution. For the MSE, which is the criterion for evaluating model fit, all polymorphic equations were analyzed as being lower than anamorphic equations, indicating a high degree of fit, and these results showed a similar trend to the fit results shown for the estimation model of the control group. The MSE for each of the polymorphic equations was found to be low and were reported as follows: Gompertz (0.8478), Schumacher (1.7884), Hossfeld (2.0804), and Chapman-Richards (6.7039). The MSE for the LT treatment plot was different from that for the estimated model of the control group, although they exhibited a similar tendency. As in the control group, the Gompertz polymorphic equation with the best fit was selected as a suitable equation for the diameter growth model of the LT treatment plot (Table 5). In particular, the MSE of the Gompertz model for the LT treatment plot was found to be lower than that for the control plot. Based on a comparative analysis of the model fit between treatment plots according to the size of the MSE, the LT treatment plot showed a similar trend to that of the control plot; as such, light thinning (15% of the total volume) might not have an effect on the growth amount or growth trends observed in this study.
Residual statistics the anamorphic and polymorphic equations fitted to the DBH of the LT treatment plot
Table 6 shows the test statistics for the Gompertz polymorphic equation, which was selected as having the best fit for a diameter growth model of the LT treatment plot. The estimated model demonstrated homoscedasticity of the residuals, which is characteristic of a normal distribution (Table 5, Fig. 2).

Non-linear squares summary statistics for the Gompertz polymorphic equation fitted to the DBH of the LT treatment plot

Plot of residuals vs predicted values for the Gompertz polymorphic equation of the LT treatment plot.
HT Treatment Plot
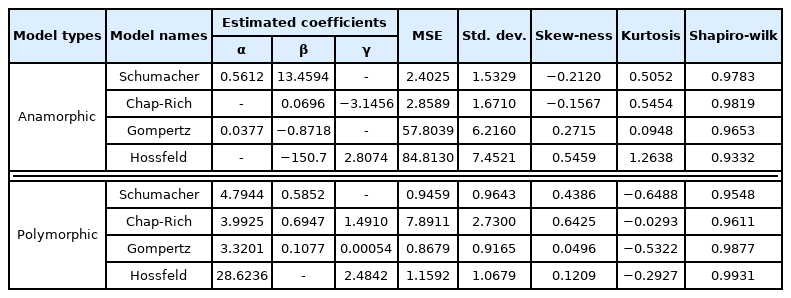
To develop a diameter growth model of the HT treatment plot, the anamorphic and polymorphic equations were fitted to the annual ring analysis data, and the Shapiro–Wilk statistic, which is the criterion for determining normality, was ≥ 0.95 for all equations, excluding the Hossfeld anamorphic equation (0.9315), indicating that it followed a normal distribution. For the MSE, which is the criterion for evaluating model fit, all polymorphic equations excluding the Chapman-Richards equation were analyzed as being lower than the anamorphic equations, indicating that the fit was high. The MSE for the polymorphic equations was found low in the following order: Gompertz (0.8679), Schumacher (0.9459), Hossfeld (1.1592), and Chapman-Richards (7.8911). The HT treatment plot also showed a similar trend in model fit to each estimated model of the control plot and LT treatment plot, respectively. The MSE for the Gompertz model, which had the best fit, was lower than that of the control plot, but it was slightly higher than the MSE of the LT treatment plot. Even for the HT treatment plot, the Gompertz polymorphic equation with the best fit was ultimately selected as the equation that was most suitable for the diameter growth model (Table 7). The statistics for the Gompertz polymorphic equation, which was determined to be the best fitting equation, are shown in Table 8. The residual distribution characteristics also reflect homoscedasticity, so it was judged as an appropriate formula for predicting diameter growth by QGT growth stage (Fig. 3).
Residual statistics with the anamorphic and polymorphic equations fitted to the DBH of HT treatment plot
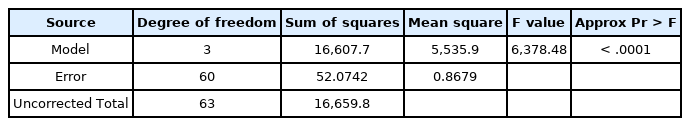
Non-linear squares summary statistics for the Gompertz polymorphic equation fitted to the DBH of the HT treatment plot
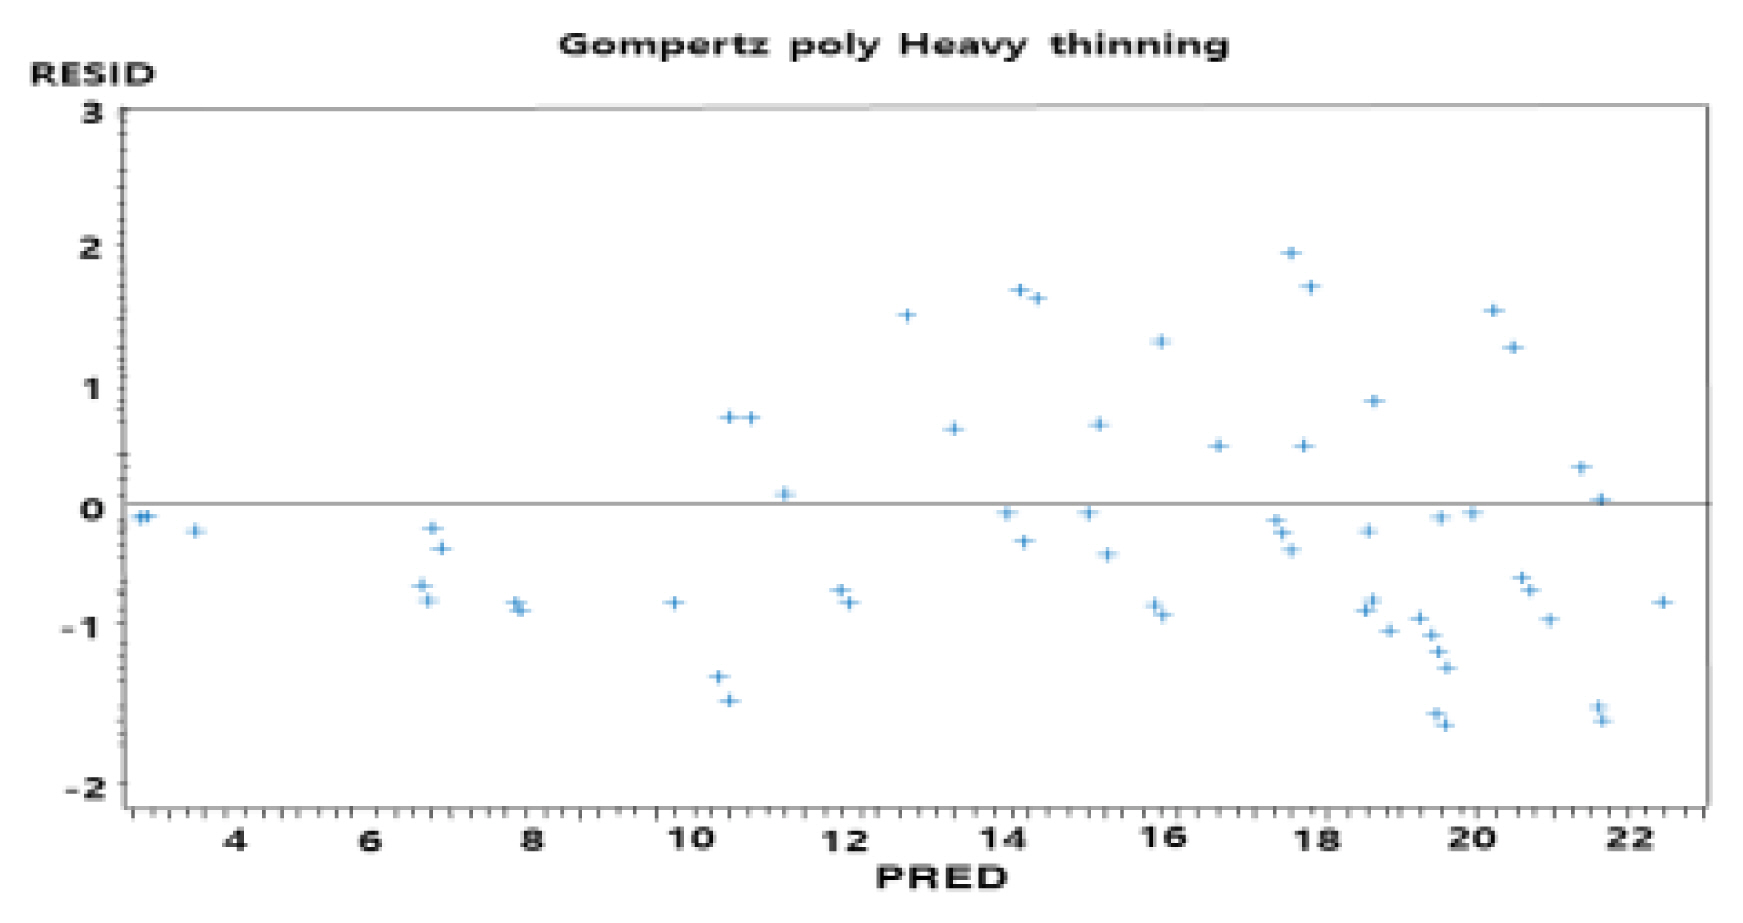
Plot of residuals vs predicted values for the Gompertz polymorphic equation for HT treatment plot.
Prediction of Diameter Growth for Each Treatment Plot
To examine the thinning effect of the planted QGT stands on DBH growth, the estimated growth curves were derived based on the selected equation for each treatment plot (Gompertz polymorphic equation). There was no difference in the initial growth before thinning for each treatment plot, but after thinning, it was confirmed that the HT treatment plot exhibited increased growth when compared to the LT treatment plot and the control plot (Fig. 4). However, in all treatment plots, the trees were approaching a constant value (HT treatment plot: 26 cm; LT treatment plot: 23.3 cm; control plot: 22.5 cm) around 50 years of age. Therefore, the estimated result showed that it was difficult to produce wood with more than a medium-diameter log (DBH ≥ 30 cm). Considering that the current stand age is 35 years, it is estimated that the production goal of a medium-diameter log or larger can be achieved if a second thinning is performed. The verification test for this estimation will reflect the effect of the secondary thinning treatment in the future, enabling us to determine whether the production goal is achieved to a higher degree through the advancement of the growth model. In response to the recent climate change, forestry plantations of warm-temperate, broad-leaved evergreen species are gradually expanding in South Korea (2021 KFS). Thus, it is expected that these results will be used to guide the development of a thinning treatment system for such plantations in the future, and they will also be used to inform rational forest management (e.g., determining viable production goals by providing information on higher-level growth of older stands through continuous monitoring).
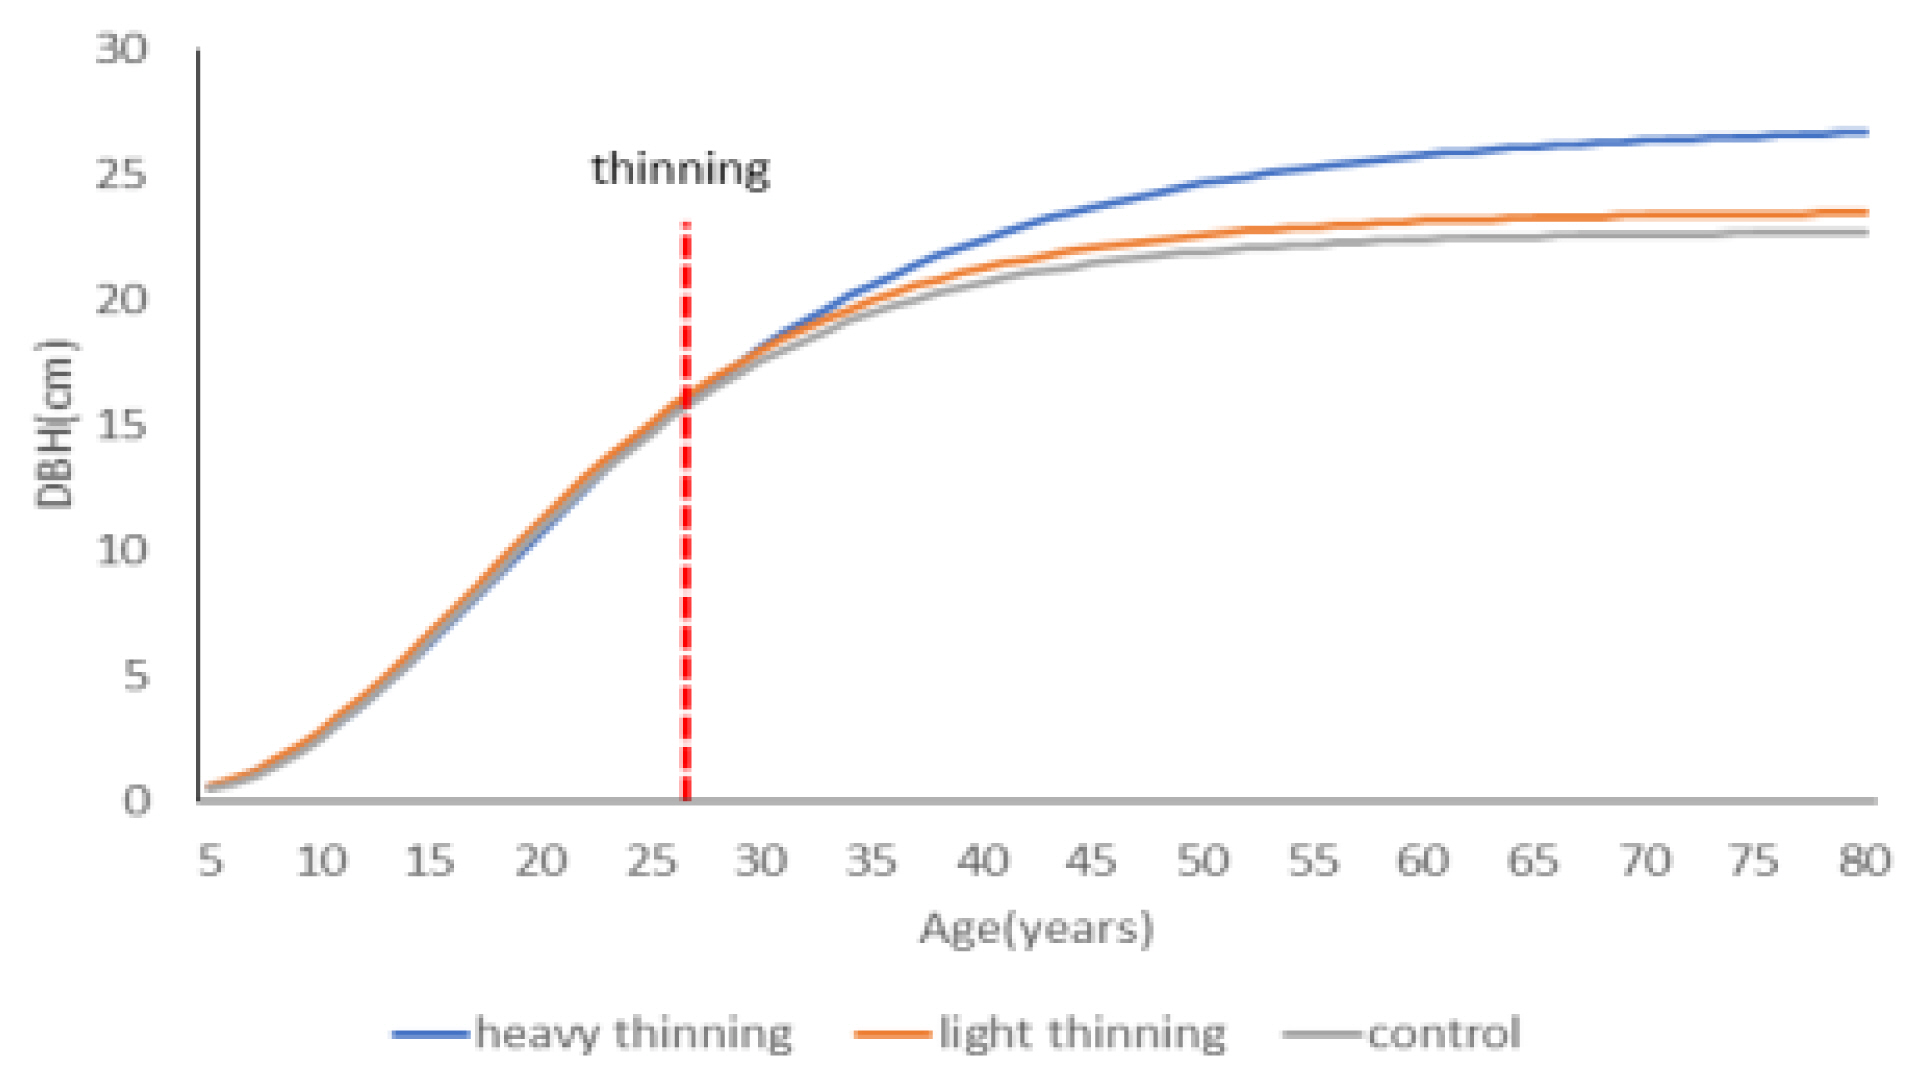
Estimated curves of DBH growth by treatment plot.
Conclusion
To develop a diameter growth model of plated QGT stands –a representative, warm-temperate, and broad-leaved evergreen species in Korea – based on the first thinning, this study was conducted on planted stands that had completed first thinning, based on thinning intensity. By analyzing the amount of growth by treatment plot to determine the growth effect of the first thinning of the current stands, it was found that for DBH, the HT treatment plot was significantly larger than the control plot (p < .05). However, in terms of tree height and the H/D ratio, there was no significant difference noted by treatment plot. Based on these results, the treatment intensity of the HT treatment plot (30%) was more suitable than that of the LT treatment plot (15%), as the first thinning had an impact on diameter growth.
By developing a diameter growth model for each treatment plot according to the first thinning intensity, the MSE for the Gompertz polymorphic equation was the lowest in all treatment plots (control plot: 2.2381; LT treatment plot: 0.8478; HT treatment plot: 0.8679). Further, the Shapiro– Wilk statistic was 0.95 or more, indicating that it followed a normal distribution. Accordingly, this equation was deemed most suitable for the model. Based on an analysis of the thinning effect and growth trends for each treatment plot, as derived from the estimated growth curves that were developed using the selected equation, it was found that the amount of growth and overall trends for all treatment plots were similar before the thinning treatment (stand age 27 years). After the treatment, the amount of growth for the HT treatment plot was larger than that of the control plot and LT treatment plot. The PSP in which this study was conducted had a stand structure that was characteristic of even-aged stands. The absence of information after the current stand age (35 years) made it difficult for us to determine the exact production goals that would enable us to ensure that constant diameters were achieved at around 50 years. Since this study was limited in terms of PSP stand age, and was conducted using stands for which only the first thinning was performed, the estimated growth trends may vary with diameter growth models developed for each treatment plot when the secondary and tertiary thinning procedures are conducted. Therefore, it is necessary to continuously monitor and analyze the results of the secondary and tertiary thinning. In addition, this study presented the findings of forest productivity in the planted stands of a limited, warm-temperate, broad-leaved evergreen species. In the future, it would be necessary to construct PSPs that consider variable stand status, location conditions, and climatic environments.