Analysis of the Correlation Between Ecological Status and Location Environment by Cultivated Land Restoration Type of Geumgang Riverine Ecobelt
Article information

Abstract
Background and objective
The purpose of this study is to investigate the ecological status of six areas around Geumgang River that used to be farmlands before they were restored as a riverine ecobelt. This study aims to analyze the correlation between the location environment and ecological status of the sites to identify the environmental factors affecting them.
Methods
The sites are classified into four types according to restoration: terraced paddy fields, flat paddy fields, artificial wetland, and landscape forest. The survey items were divided into land use status, plant ecology, and animal ecology.
Results
In terms of plant ecology, terraced paddy fields showed favorable naturality with the rate of native species above 90% and the naturalization index below 10%. In terms of animal ecology, the total number of species found in these areas was biggest in terraced paddy fields, followed by flat paddy fields, artificial wetland, and landscape forest. Regarding species diversity, terraced paddy fields also showed abundant species with an average of 1.05 to 1.09. The results of the correlation analysis showed that the forest area around the sites had the most significant effect on species diversity. The grassland and open water area showed a positive correlation with the total number of animal species and the number of dragonflies, confirming that the marshy grassland had a positive effect. As the cultivated land and urbanized area around the sites increased, it had a negative effect on the distribution of native species and the number of animal species that appeared, and a positive effect on the naturalization index.
Conclusion
It is necessary to establish preemption and restoration plans for sites such as grasslands adjacent to the forest and terraced paddy fields in order to promote resilience of the diverse species returning to the purchased lands.
Introduction
The Ministry of Environment established six strategies such as land purchase for riparian buffer zones, pollution control, effectiveness verification, community alignment measures, increased value of waterfront areas, and formation of natural ecology, thereby making substantial efforts to promote natural resilience of riverine ecobelts and use of ecosystem service. Accordingly, the River Basin Environmental Offices for Korea’s four major rivers are pursuing effective values by creating riverine ecobelts, such as cultivating waterheads, purifying water, absorbing carbon, creating biological habitats, providing ecological education, and improving landscape aesthetics (Ministry of Environment, 2020).
The Geum River Basin Environmental Office has been purchasing land of water supply source management areas such as riparian buffer zones and creating riverine ecobelts since 2003 to conserve and improve the quality of metropolitan water supply sources such as Daecheongho Lake. 15.658km2 out of 1,243 km2 of land was purchased as of December 2019, 93% (14.549 km2) of which is comprised of fields, paddies, and woodland (Geum River Basin Environmental Office, 2020). Cultivated land proves various services aside from the key functions of food production, such as reducing greenhouse gas, alleviating the urban heat island effect, purifying water, controlling floods, providing biological habitats, preserving soil, and creating landscapes (Son et al., 2015). Korea and Japan highly rated the value of rice paddies as habitats for various living things and jointly adopted ‘enhancing biodiversity in rice paddies as wetland systems’ as a resolution at the Ramsar Convention in 2008 (Kim et al., 2011). In particular, wetlands from abandoned paddy fields associated with the forest ecological axis are revalued as a potential habitat that provides biodiversity as well as a stable environment as a biological habitat and restores rare varieties or endangered species (Sagong et al., 2015; Rhee et al., 2009). Therefore, wetlands from abandoned paddy fields are regarded as the key space for promoting resilience, such as maintaining biological diversity and productivity, controlling disturbance including overflowing water storage, purifying water through sediment capture and denitrification, and providing habitats (Craft, 2016).
Aligned with idle farmlands, studies have been conducted on ecosystem service, ecological restoration, habitat function and assessment of cultivated lands, wetlands from abandoned paddy fields, and habitats for endangered species. As a study on ecosystem service related to idle farmlands, Bae et al. (2010) conducted a case analysis on idle farmlands in Korea and overseas and came up with the direction and management plan suitable for environmental characteristics such as agricultural use, creation of ecological landscape, and biodiversity restoration. Lee et al. (2009) emphasized the need for differentiated preservation and restoration of idle farmlands in Korea through ecosystem service valuation and setting of utilization zones. As a study on ecological restoration of idle farmlands, Kim et al. (2015) presented the ecology/landscape/forest type through landscape forest creation and the ecological environment type through wetland restoration. Kang (2020) reported the ecological excellence of wetlands from abandoned paddy fields with high naturality and biodiversity among the forest type, cultivated land type, and urban district type as ecological restoration areas of riparian buffer zones.
For habitat function and assessment of cultivated lands, Son et al. (2018) suggested ways to create and maintain feeding places when comparing the bird diversity of paddy field wetland and greenhouse complexes in design. Loesh and Kaminski (1989) reported that inhabitation of dabbling ducks in wetlands from paddy fields is affected significantly by the vegetation structure and surrounding land use. Inhabitation of amphibians and reptiles in cultivated lands or grasslands requires control and management of threats and wetlands customized for spawning and hibernation (Park et al., 2015). Dragonflies, which are dependent on wetlands from paddy fields, live underwater during immaturity and near the surface of the water after eclosion, which is why it is necessary to create alternative habitats such as puddles, waterways, and aquatic plant habitats (Triplehorn and Johnson, 2005; Lee, 2019). Many studies have been conducted on ways to preserve and manage fallow forest lands, artificial wetlands, and wetlands from abandoned paddy fields to stabilize inhabitation of endangered species sensitive to artificial environmental changes (Lee, 2018; Cho et al., 2012; Kim, 2011; Kim et al., 2010, Lee et al., 2020). Wetlands from abandoned paddy fields that are neglected without cultivating crops are acknowledged as a potential space to promote biodiversity and provide ecosystem service (Cramer et al., 2008). China and Japan are also restoring abandoned paddy fields into wetlands, emphasizing their functions of biodiversity recovery (Lu et al., 2007) and habitat for endangered species (Ikegami et al., 2011: Kang et al., 2003). Lee et al. (2009) also emphasized the need to establish preservation and restoration plans based on land environment potential to reinforce the habitat function of idle farmland/fields/paddies and abandoned paddy fields.
In particular, there is a high rate of civil complaints in residential areas, commercial districts, roads, and facilities areas when purchasing land for riverine ecobelts, which is why it has been formed as a green space focused on landscaping trees. Rice paddies or abandoned lands are to be preserved in their original state or restored into wetlands to strengthen the function as an ecological habitat (Geum River Basin Environmental Office, 2019). From this perspective, this study comparatively analyzes the ecological status of each type of cultivated land restoration of Geumgang Riverine Ecobelt, identifies the potential as a biological habitat, determines the locational and fundamental environmental factors that affect inhabitation of species, and provides actual ecological information to preserve riparian buffer zones and expand the value of recovering naturality in restoration projects.
Research Methods
Research sites
Geumgang Riverine Ecobelt can be divided into the Yongdam Dam basin that includes Jangsu-gun in Jeollabuk-do, Jinan-gun in Jeollabuk-do, and Muju-gun in Jeollabuk-do; and the Daecheong Dam basin that includes Geumsan-gun in Chungcheongnam-do, Yeongdong-gun in Chungcheongbuk-do, Okcheon-gun in Chungcheongbuk-do, Boeun-gun in Chungcheongbuk-do, Cheongju-si in Chungcheongbuk-do, and Daejeon Metropolitan City.
As of 2020, the land purchased for the riparian buffer zone and water source conservation area of the Daecheong Dam basin was approximately 7.092 million m2, 244.4m2 of which was green space. As a result of dividing the land coverage before purchase into urbanized area, agricultural area, and forest area, it was found that forest area took up the highest percentage at 48.8%, followed by agricultural area at 43.7% and urbanized area at 7.5% (Geum River Basin Environmental Office, 2020). After restoration of cultivated lands, most are in the form of drylands and wetlands or planting areas, while there are very few wetlands from abandoned paddy fields with favorable waterfront environment and open water exposure (Back, 2019). This study selected areas where open water is distributed inside among those restored from agricultural areas before purchase. Total 2,076 plots of land were purchased. We reviewed aerial orthoimagery taken in February 2018 provided by the National Geographic Information Service (2018) and conducted a field study on 1,225 plots turned into green space from agricultural land. As a result, we came up with five sites depending on the existence of open water. We added one site without open water as the control plot, thereby conducting the study on total six sites.
The sites in this study are areas created to promote biodiversity and reinforce the biological habitat as the areas for restoration of cultivated land wetlands and forests of riverine ecobelts presented by Oh (2014). More specifically, they are categorized into wetland forest zones, wetlands and grasslands, and landscape forests. But considering the former land use status, topographic characteristics, and restoration characteristics of the five wetland sites excluding the landscape forest, this study subdivided them into wetlands from abandoned paddy fields (flat and terraced) and artificial wetlands. This is based on the classification by Park et al. (2006) into flatland, river, mountain land (terraced), reservoir, and lake according to the location and topographic characteristics of abandoned paddy fields, and the standard by Lee (2019) classifying riverine ecobelt restoration types into shallow, medium, and deep wetlands and artificial wetlands as active restoration type.
Therefore, this study examined Jik-dong, Dong-gu in Daejeon Metropolitan City and Sangjang-ri, Munui-myeon, Cheongju-si in Chungcheongbuk-do as terraced wetlands from abandoned paddy fields close to the forest; Gutan-ri, Simcheon-myeon, Yeongdong-gun and Yongbang-ri, Iwon-myeon, Okcheon-gun in Chungcheongbuk-do as flat wetlands from abandoned paddy fields; Wondong-ri, Iwon-myeon, Okcheon-gun in Chungcheongbuk-do as artificial wetland; and Jangdong-ri, Simcheon-myeon, Yeongdong-gun in Chungcheongbuk-do as landscape forest. The areas of each site range from 1,695 m2 to 11,075 m2, and they were restored in 2006–2017 (Table 1).

Current status of research sites
Jangdong-ri, which had been fields and orchards, was formed into the landscape forest mostly with Cornus officinalis, and the five other sites that had been used as rice paddies and cultivated lands formed forest zones focused on wetlands from abandoned paddy fields, with partially planted grasslands such as Miscanthus sacchariflorus, Iris pseudacorus, and Lythrum anceps and plants such as Acer palmatum and Acer tataricum subsp. ginnala. In particular, in Wondong-ri, shallow and medium wetlands (Lee, 2019) with the water level of 20–50 cm were formed artificially (Fig. 1).

The location map and status of survey site.
Survey and analysis method
The research sites were areas used as cultivated lands in the past, 3–14 years after purchasing and restoring them as riverine ecobelts. We identified the internal and external land use status of the sites and surveyed the plant and animal ecology for comparative analysis of the ecological status.
The internal environment was divided into open water rate, arbor and herb distribution rate based on the sub-classes applied to cultivated land, grassland, and wetland among the biotope types of ecological planning (Lee, 2011). The external environment was based on the standard set by Kim (2003) and Park (2014), who categorized purchased lands into core area from river/lake boundary to 30 m and buffer zone from 100 m or more. This study calculated the distribution ratio of forest, cultivated land, and urbanized area based on the land coverage classification within 100m of the research sites.
We conducted a flora survey to calculate total number of species, ratio of native species, and naturalization index of plant ecology. For animal ecology, we examined wild birds, amphibians and reptiles, mammals, and indicator insects such as butterflies and dragonflies. Detailed survey items are as shown in Table 2. The survey was conducted three times in May, August, and October 2018, and a winter survey was additionally conducted on wild birds and mammals in December.
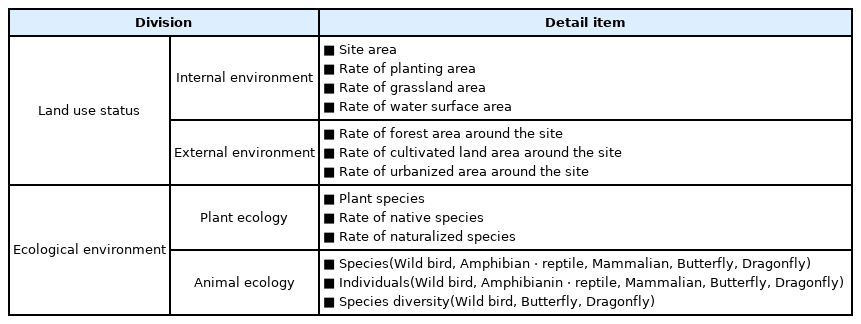
Survey items and measurements of the research site
Land use status
The lands were divided into forests, cultivated lands, and urbanized areas (artificial facilities areas such as roads, housing, and commercial districts) located around the 100m radius outside the sites. Inside, the lands were divided into planting areas, grasslands, and open water areas to calculate the ratio of area (Kang, 2020). This was calculated based on the 1/5,000 digital map, and the area of each type was calculated using ArcGIS 10.1.
Plant ecology status
Plant ecology was identified by surveying the florae and existing vegetation. The florae grown in each site were recorded based on the 1/5,000 digital map. For existing vegetation, planting areas, grasslands, and open water areas were marked, and the typical dominant species were investigated. For florae, plants that were difficult to identify on site were collected for indoor identification. The plant species were listed based on the Korean Plant Names Index, and naturalized species were classified with reference to Full Color Illustrated Book of Korean Naturalized Plants (Park, 2001). Based on the flora survey data, we calculated the ratio of native species and naturalization index (number of individual naturalized plants in the area/number of species of total plants).
Animal ecology status
Wild birds were surveyed using line transect and spot census. For line transect, we walked around the path determined in advance and observed wild birds appearing within 25 m on both sides with the naked eye or binoculars, and recorded bird sounds and the way they fly as well as their species and abundance. For spot census, we stayed in one place for 10 minutes and recorded birds observed nearby. The species found were classified and identified with reference to Birds of Korea (Lee et al., 2014). We examined amphibians and reptiles with focus on the wetlands within the sites and existing water system, surveying the appearing species, habitat status and appearance location, and number of individuals. For mammals, we directly observed them or examined excreta, footprints, hideouts, and traces of small mammals that can live within the sites, thereby estimating and recording the number of species and abundance. For butterflies, which are indicator insects, we used line transect to record the number of species and abundance of butterflies that can be checked within 2.5m on both sides of the survey path. The species were identified based on the method by Ju et al. (1997) and Kim (2002) and named with reference to The entomological society of Korea (1994). Butterflies are primary consumers serving as the food source of secondary consumers, pollinators, and food source of wild birds (Blair, 1999) and are closely related to biodiversity and thus selected as indicator insects. Dragonflies were selected because they are secondary consumers taking up an intermediate position of the food chain of the aquatic ecosystem as well as indicator species that can determine the qualitative change in the wetland ecosystem (Lee et al., 2020; Lee, 2019). We used line transect to record species name and abundance of dragonfly imagoes that can be identified within 2.5m on both sides of the survey path. The species that clearly distinguished were collected and identified using a net (40 cm diameter), and we referred to Jung (2007) for species identification and naming. We calculated Shannon's diversity index of wild birds, butterflies, and dragonflies that appeared in all sites. The diversity index represents the diversity of the species composition state that combined the number of species and evenness (Ludwig and Reynolds, 1988). Shannon’s diversity index is an index that emphasizes rarity and includes the number of species and homogeneity (Pielou, 1975), thereby representing species diversity.
-
Species diversity (H′) = — Σ(ni / N)(log ni / N)
N= Total number of individuals that appeared within the same area, ni= Number of individuals of a single species that appeared within the same area
We comparatively analyzed the number of biota species, number of individuals, and species diversity and identified statistical significance by analyzing the correlation between internal/external land use status and ecological status. We conducted Pearson's correlation analysis for internal/external environmental variables as the ratio scale, and SPSS 12.0 for Window Program was used for statistical analysis.
Results and Discussion
Land use status
The external environment of each site is mainly classified into forests and cultivated lands, and the internal environment into planting areas, grasslands, and open water areas. More specifically, the external environment of Jik-dong and Sangjang-ri, which are wetlands from abandoned terraced paddy fields, has the forest taking up 67.5% and 39.8% each. The other four areas have cultivated lands (48–64.4%) widely distributed around them.
For the internal environment, grasslands (average 45.4%) were most widely distributed, followed by planting areas (average 37.1%) and open water areas (17.7%). In Jik-dong, arbor vegetation area (23.9%) and open water area (9.8%) were distributed around wet grassland (66.3%). Sangjang-ri in restoration was comprised of arbor planting area (62.7%) at the top of the terraced cultivated land, as well as open water area (19.8%) and wet grassland (18.5%) dominated by Oenanthe javanica and Persicaria thunbergii. For Gutan-ri and Yongbang-ri, which are flat wetlands from abandoned paddy fields, wet grasslands accounted for 59.2% and 38.4% each, and open water areas accounted for 4.5% and 61.6% each. The Acer tataricum subsp. ginnala planting area (36.3%) that prefers the humid environment is distributed in Gutan-ri. Wondong-ri had broad arid, humid grasslands (72.3%), with open water area and arbor planting area taking up 10.7% and 17% respectively. In Jangdong-ri, the biggest area was the planting area (82.5%) focused on Cornus officinalis and Prunus mume, and then there was arid grassland (17.5%) (Table 3).
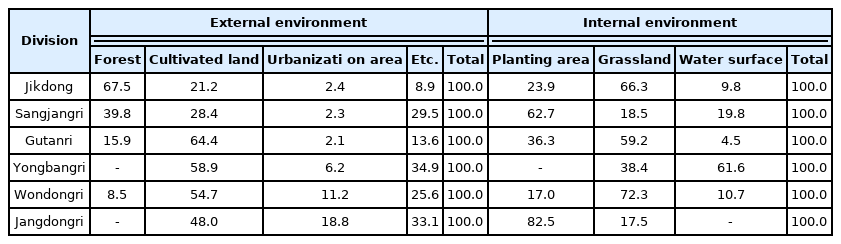
Ratio of land use status in the research sites Unit: %
Ecological status
Plant ecology
Through a flora survey on each site, we identified the total number of species, ratio of native species, and naturalization index that can determine the extent of naturality. There were total 108–262 species (average 206 species), and Jik-dong that is a terraced wetland from abandoned paddy fields and Jangdong-ri that is a landscape forest showed at least 260 species with the greatest variety (Fig. 2). The ratio of native species was 86.8% on average, which was highest in Jik-dong and Sangjang-ri that are terraced wetlands from abandoned paddy fields (89.9%–90.8%) and relatively lower in flat forms such as Gutan-ri and Yongbang-ri (83.6–86.0%) (Fig. 3). In other words, naturality was high in Jik-dong or Sangjang-ri located in lands adjacent to a forest. This is consistent with the result that the ratio of native species in areas near forests is higher than that of cultivated lands or lands adjacent to urbanized areas (Kang, 2020) or that the mountain type increases autogenous property and promotes habitat functionality (Son et al., 2014).

The number of plants species in survey sites.
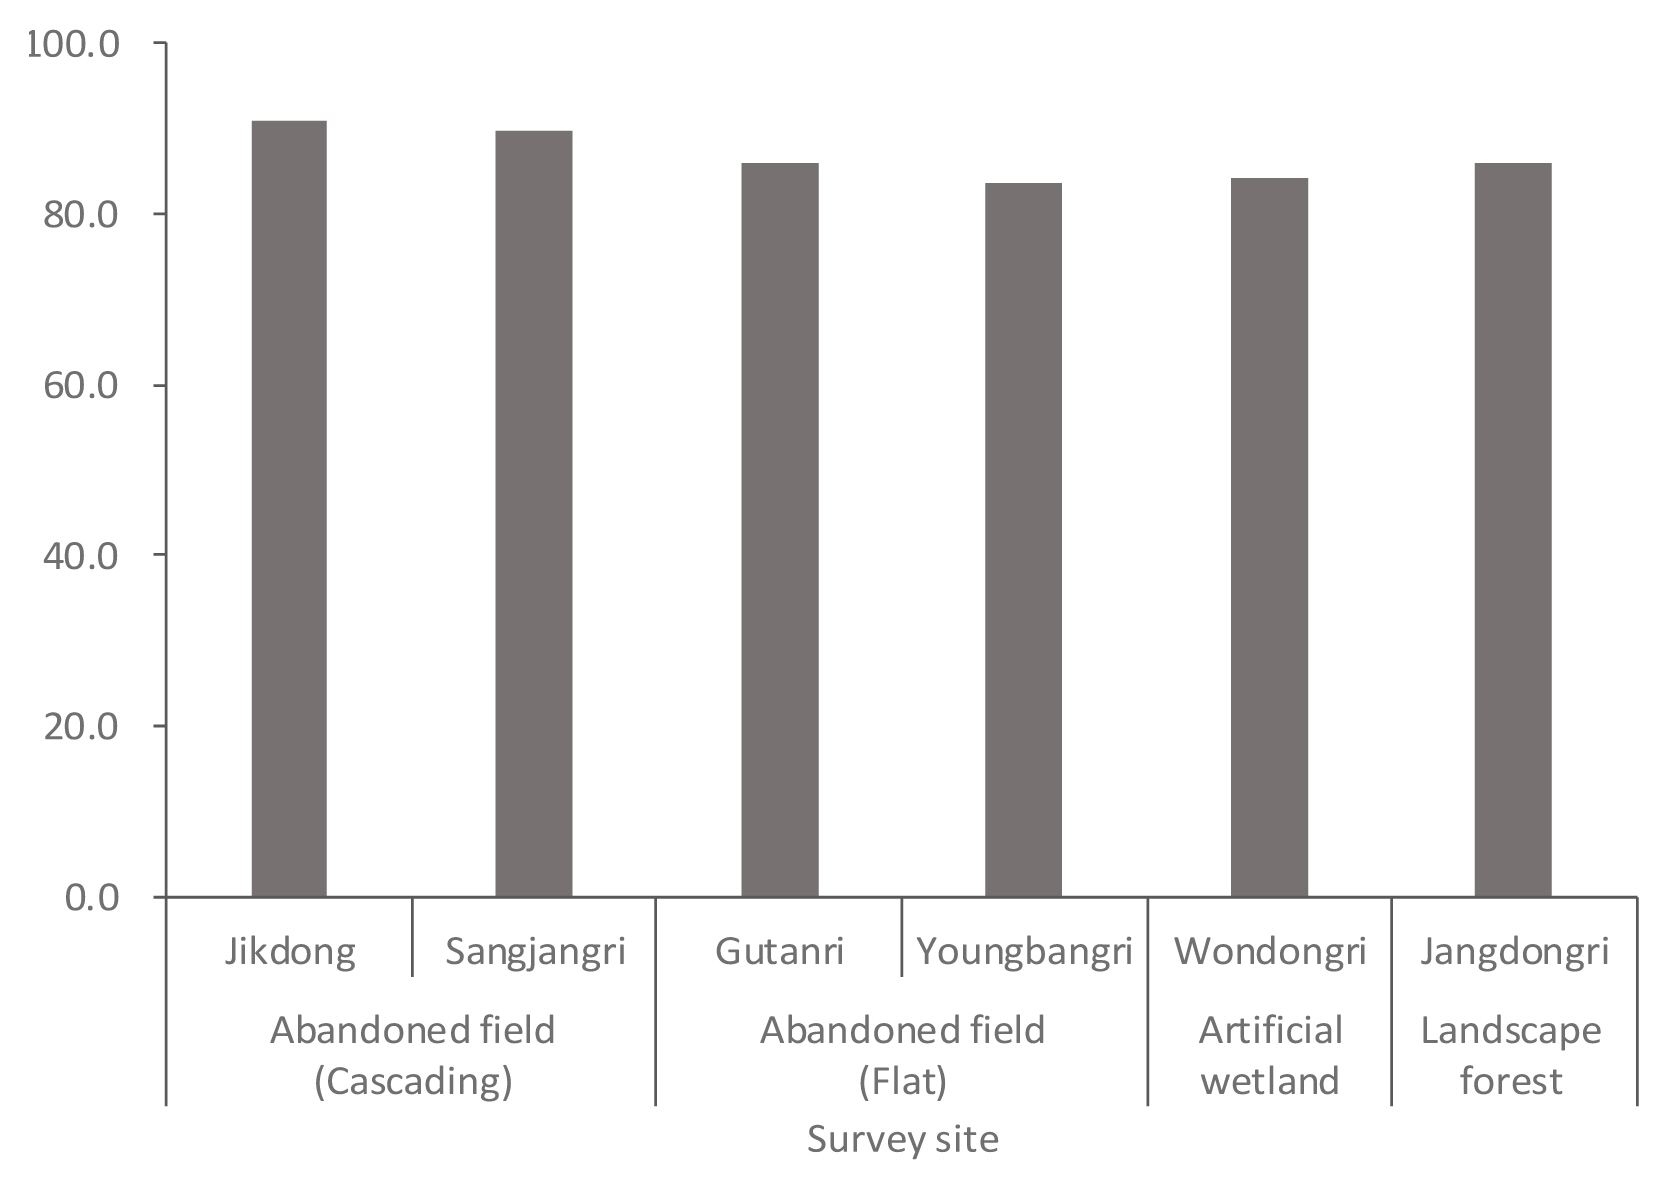
The rate of native species in survey site.
As for the naturalization index, Jik-dong and Sangjang-ri surrounded by forests showed favorable naturality under 10% on average. The sites surrounded by cultivated lands showed high rates at 13.9%–16.4% (Fig. 4). Lands around Yongbang-ri and Wondong-ri showed active cultivation activities and strong artificial interference, thereby showing high naturalization index. Jik-dong and Sangjang-ri that are wetlands from abandoned terraced paddy fields showed lower naturalization index than Jeonju’s biotope average at 10.3% according to Oh et al. (2010), thereby showing favorable naturality. As such, naturalization index is a scale that represents artificial interference, which reduces the number of native species and may cause qualitative deterioration of biological habitat and naturality (Park et al., 2018; Holmes et al., 2008).
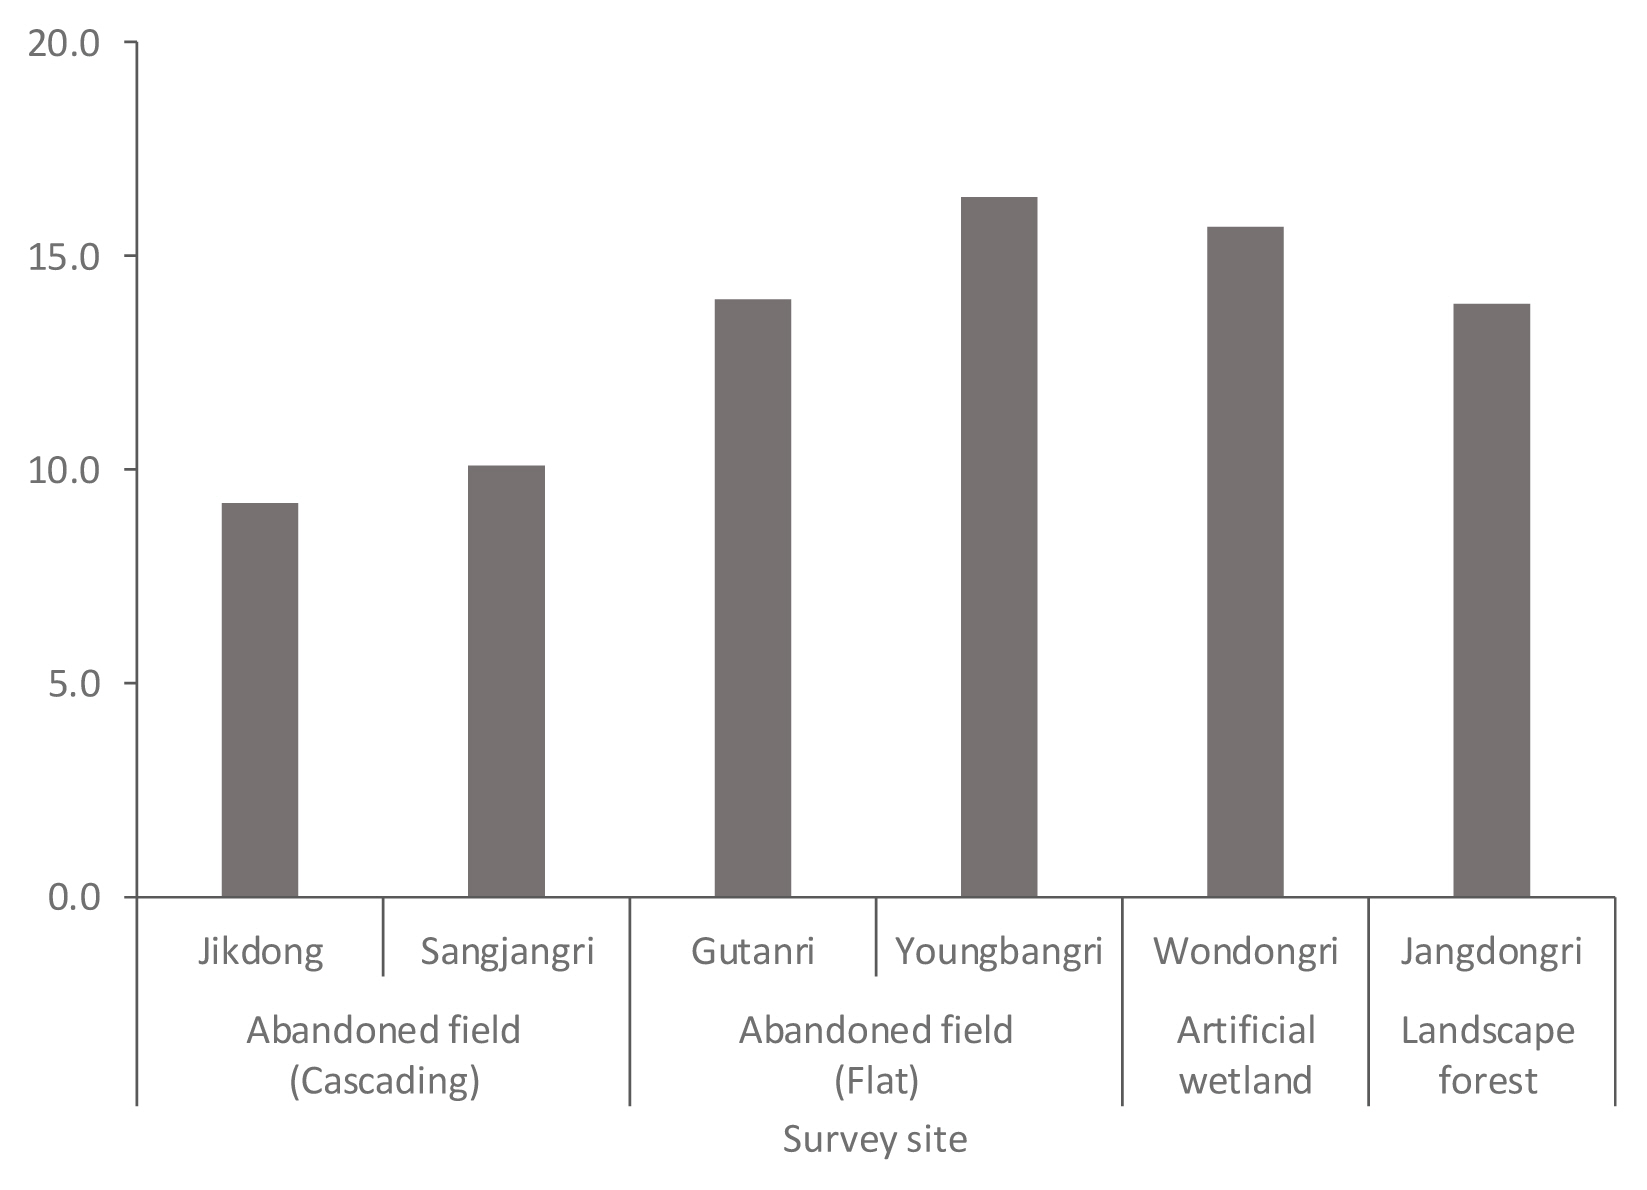
The rate of naturalized species in survey sites.
Animal ecology
(1) Number of species and number of individuals
Jik-dong and Sangjang-ri adjacent to forests showed the biggest number of species (66–78 species). In particular, Jik-dong showed the biggest number of butterflies and dragonflies as well as wild birds (20–27 species), followed by Gutan-ri and Yongbang-ri (44–49 species), Wondong-ri (40 species), and Jangdong-ri (36 species) near cultivated lands (Fig. 5).

The number of species in survey sites.
For the number of individuals, wetlands from abandoned terraced paddy fields showed an average of 371 individuals, and wetlands from abandoned flat paddy fields showed an average of 373 individuals with a similar tendency. In particular, Jik-dong and Yongbang-ri where grasslands and open water areas account for more than 70% showed many individuals of dragonflies (268 and 312 individuals each). This is due to the favorable effect of inhabitation conditions such as open water, optimum water level, and growth of aquatic plants in the sites (Kim et al., 2018). Wondong-ri, which is an artificial wetland, showed total 419 individuals, with dragonflies (323 individuals) showing a 77.1% frequency. This is because artificially formed puddles, open water, and wet grassland were widely distributed in the site. Jangdong-ri showed a high frequency of wild birds (98 individuals) as the landscape forest area located in an orchard (Fig. 6). This is due to the favorable environmental conditions for feeding wild birds, with food trees such as Cornus officinalis and Prunus mume planted extensively when restored (Lee, 2021). Amphibians and reptiles were not found since there were no puddles or water bodies.
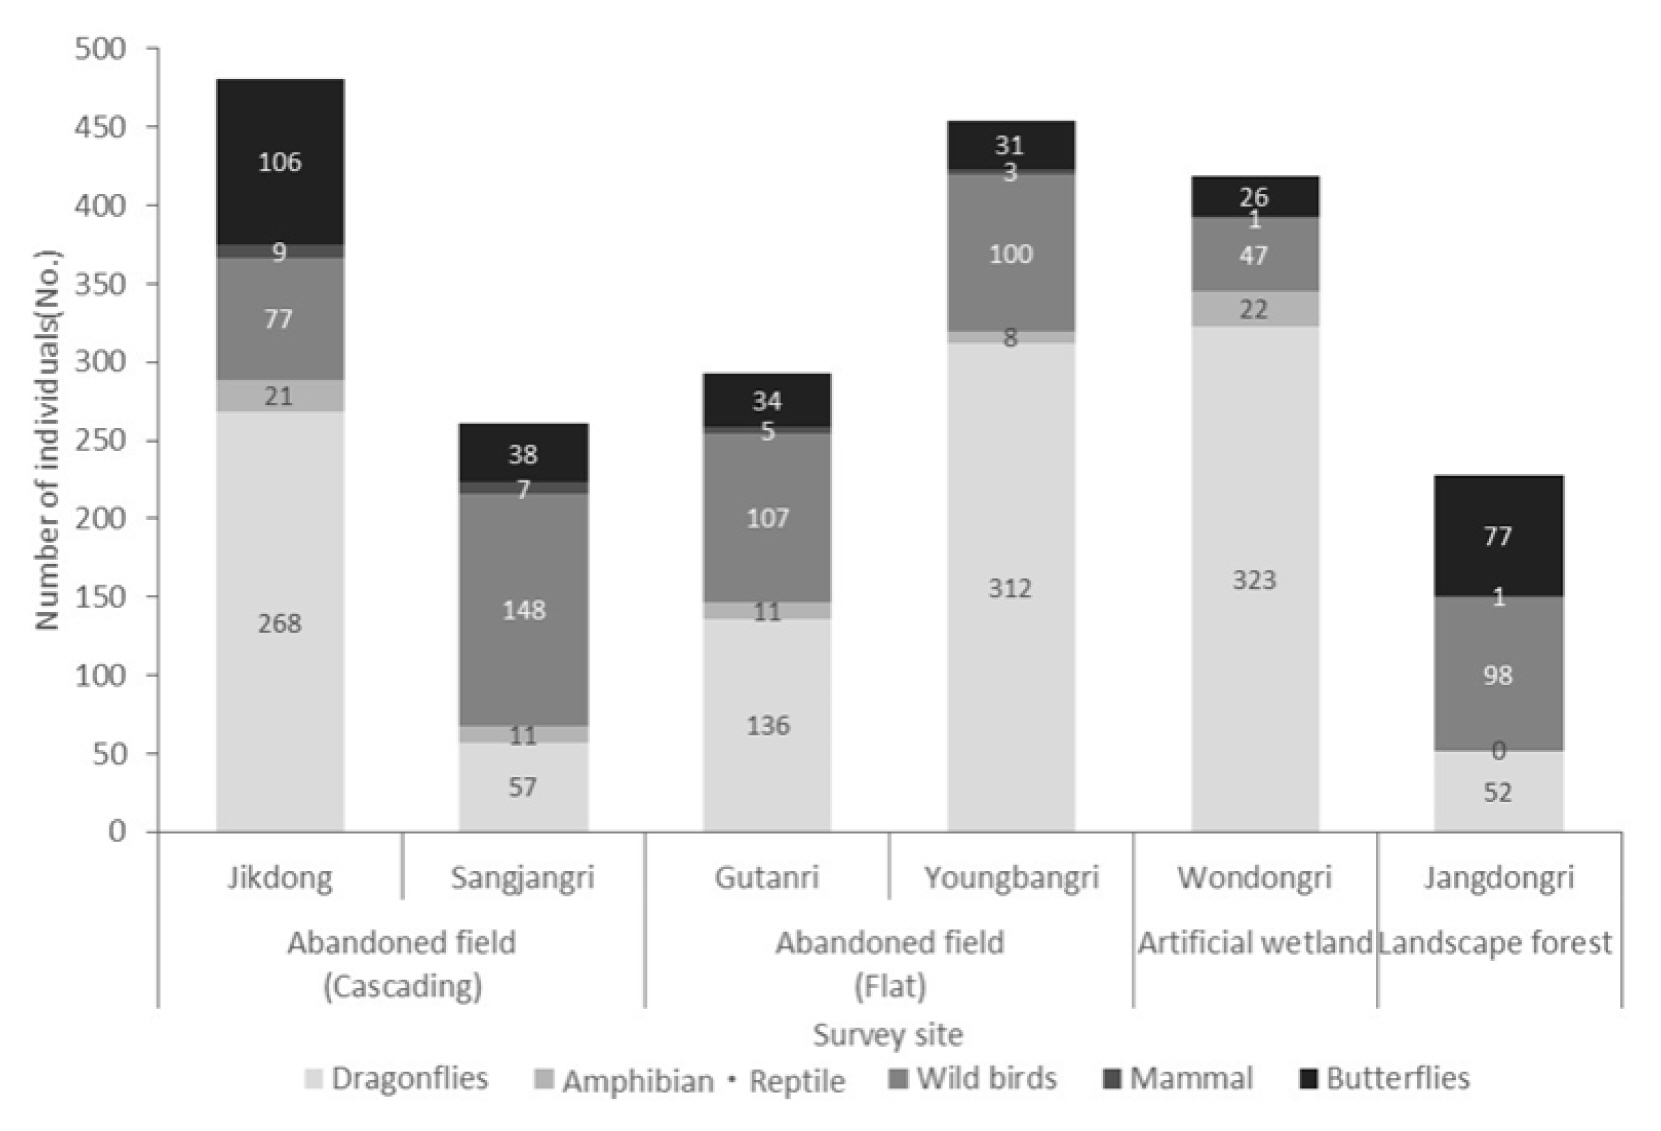
The number of individuals in survey sites.
(2) Species diversity
As a result of analyzing species diversity (Table 4), wild birds showed 0.5302–1.2286, and Jik-dong and Sangjang-ri located near forests showed highest species diversity over 1. On the other hand, Gutan-ri and Wondong-ri around cultivated lands with a wide distribution of orchards showed lowest species diversity below 0.6. This is consistent with the study result emphasizing that whether there is a remnant forest or not is a key element of wild bird inhabitation (Lee, 2021), showing that Jik-dong and Sangjang-ri have favorable ecological status as wetlands from abandoned paddy fields located on the forest boundary. The species diversity of indicator insects such as butterflies and dragonflies was 0.4573–1.2019. Jik-dong and Sangjang-ri as the borderland of forests with a distribution of open water areas and grasslands showed high species diversity at 0.9619–1.2019, whereas Wondong-ri and Jangdong-ri located near orchards with relatively high artificial interference showed low species diversity at 0.4573–0.8633. As proved by Kim et al. (2013) who studied the excellent biotope types in Wonju such as natural reservoirs, wetlands from abandoned paddy fields, natural rivers, and forest valleys and discovered that wetlands from abandoned paddy fields showed the highest species diversity of dragonflies, the marsh plants growing on the wetlands from abandoned paddy fields, mud, and open water areas in Jik-dong or Sangjang-ri were serving as the spawning ground. Moreover, Kim et al. (2014) revealed that the species diversity of dragonflies in wetlands formed more than 10 years ago was 8304–1.1186, showing a similar tendency with the species diversity in Jik-dong or Sangjang-ri with favorable environment of wetlands from abandoned paddy fields close to forests.

Species diversity index of types
Correlation between the location environment and ecological status of the research sites
As a result of analyzing the correlation between internal/ external environmental factors and ecological items of the sites (Table 5), it was found that the site area and planting area as the internal environment showed a negative correlation with the number of species of dragonfly species (r = −0.860, r = −0.922) and the number of amphibian and reptile individuals (r = −0.899, r = −0.939). This is similar to the result that planting areas like orchards have a more negative effect on inhabitation of dragonflies and amphibians than wetlands (Kim et al., 2018). The internal grassland and open water area showed a positive correlation with the total number of individuals (r = 0.875, r = 0.932), and the number of dragonfly individuals showed a positive correlation with grassland (r = 0.921) and open water area (r = 0.942). This shows the same pattern as the result by Kong et al. (2014) who analyzed that the mix with open water and vegetative cover serves as a key factor of biological habitat preservation. In other words, open water areas and wet grasslands dominated by Leersia japonica, Typha orientalis, and Juncus effuusus var. decipiens had a positive effect on inhabitation of various species.

The correlation between the location environment of the site and the ecological items
Forest area around the sites as the external environment showed a positive correlation (r = 0.920, r = 0.976) with the ratio of native species and total number of wild animal species, and a negative correlation (r = −0.920) with naturalization index. Moreover, forest area showed a positive correlation with the number of amphibian and reptile species (r = 0.853), number of butterfly species (r = 0.898), number of mammalian individuals (r = 0.924), and diversity of dragonfly species (r = 0.861), thereby showing that forest location around restored sites had a positive effect on inhabitation of wild animals. In other words, the results were similar to the studies by Son et al. (2014) and Kang (2020) who assessed that mountain location type most effectively contributed to habitat function in terms of biodiversity of rural areas or waterfront areas. Therefore, when purchasing land to promote and maintain biodiversity of riverine ecobelts, it is necessary to first restore abandoned paddy fields or lands near forests in order to have a positive effect. Items with significance with the cultivated land area around the sites (p < .05) were the ratio of native species (r = −0.912), number of wild animal species (r = −0.840), and diversity of wild bird species (r = −0.856) showing a negative correlation. There was a positive correlation (r = 0.912) with naturalization index, showing similar results with You et al. (2014) that, when there is a restored site located near the cultivated land, it may serve as the source of naturalized plants due to disturbance and interference by agriculture. The area of urbanized land near the sites showed a negative correlation with the number of amphibian and reptile species (r = −0.834), number of mammalian species (r = −0.922), and number of individuals (r = −0.818), thereby having a negative effect. In other words, areas with higher artificial use intensity had more negative effect on naturality, ecological property, and species diversity (Kang, 2020). As for the sites in this study, there was a negative effect on inhabitation of amphibians and reptiles as well as mammals. Therefore, to improve ecological resilience of cultivated land restoration in riverine ecobelts, it is necessary to first consider the forest location in terms of land attributes near the sites.
To improve resilience of riverine ecobelts, Back (2019) emphasized the need to consider the base environment and surrounding environment based on site characteristics. As a result of this study, there were significant results with the ratio of forest area, autogenous property, and the number of species in the external environment of the sites, thereby having a positive effect on naturality and biodiversity. In other words, we can seek ecological singularity, robustness, redundancy, and diversity by restoring vegetation focused on native species close to remnant forests (You et al., 2017). As the internal environment, open water areas and wet grasslands had a positive effect on the total number of individuals, and thus there must be preemption and ecological restoration plans for wetlands from abandoned paddy fields close to forests.
Conclusion
To promote biodiversity and ecological restoration of Geumgang Riverine Ecobelt, this study identified the ecological status of areas where cultivated lands are restored and analyzed the correlation with location environment, thereby determining the environmental factors that must be considered first. To this end, we conducted a correlation analysis between ecological status and location environment in six sites (wetlands from abandoned paddy fields, artificial wetlands, landscape forests).
The results showed that the share of native species was highest in wetlands from abandoned paddy fields near the forest, whereas the naturalization index was lowest. The number of species decreased in the order of wetlands from abandoned terraced paddy fields, wetlands from abandoned flat paddy fields, artificial wetlands, and landscape forests. The number of individuals showed high frequency in sites with a wide distribution of wet grasslands and open water areas (Jik-dong, Wondong-ri, Yongbang-ri). Species diversity was high in wetlands from abandoned terraced paddy fields (Jik-dong, Sangjang-ri) located near forests and have high distribution of wet grasslands.
In the correlation between location environment and ecological status, the surrounding forest distribution had a positive effect on the ratio of native species and inhabitation of species, and the cultivated land distribution turned out to be a threat that may promote the diffusion of naturalized species. As the base environment, wet grasslands and open water areas had a high correlation with the number of species, and thus biodiversity can be promoted by diversifying the moisture environment of abandoned paddy fields (puddles, waterways, artificial wetlands, etc.). Therefore, there is a need for preemption of abandoned and fallow lands located near forests with high autogenous property and favorable ecological properties. It is also necessary to restore them so that diverse populations can live there by creating wetlands aligned with open water areas and aquatic plant habitats. Currently, land purchase within riparian buffer zones is carried out based on the scoring criteria by use, regulated area, and pollution source (Geum River Basin Environmental Office, 2019). However, to promote biodiversity and ecological resilience, it is necessary to establish preemption and restoration plans for abandoned or fallow lands with favorable wetland source environment, river system axis, and forest location. Therefore, this must be accompanied by restoration plans to promote biodiversity by preserving wetlands and puddles while preserving the original state of abandoned paddy fields distributed in large areas.
This study identified the potential of wetlands from abandoned paddy fields as a biological habitat by comparatively analyzing the ecological status of each cultivated land restoration type of Geumgang Riverine Ecobelt and determined the location environment factors affecting inhabitation of species, and thus the results can be used to seek land purchase and ecological restoration plans. However, there are limitations in generalizing the specific restoration plans or spatial distribution of idle farmlands and fallow lands since there were only six research sites. Further research should add more various sites in each stage of purchase, restoration, and management by cultivated land restoration type. This study should be used as the basic data to identify the preservation value of wetlands from abandoned paddy fields by maintaining and managing biodiversity and establish a restoration assessment system.
Notes
This thesis was researched with support from the National Research Foundation of Korea's 2017 Individual Basic Research Support for Science and Engineering (Project No.: 2017R1D1A1B03036069).