The Effects of Visit Characteristics in Neighborhood Forest on Individual Life Satisfaction
Article information
Abstract
Recently, the importance and effectiveness of neighborhood forests have been increasing in relation to the quality of life of urban residents. However, there are very few domestic studies that analyzed the correlation between visit characteristics and life satisfaction. Therefore, the study aims to understand how people use the forest for recreation and determine how visit characteristics in neighborhood forests affect individual life satisfaction(ILS). A nationwide survey (N=2,624) was conducted on visit frequency, proximity to forest, means of transportation, forest activities, and life satisfaction. To measure ILS, we used the three factors (personal, relative, collective) of COMOSWB (Concise Measure of Subjective Well-being) developed by Seo et al.(2011). The analysis shows that people usually visit the forest located within the distance of 10–30 minutes from their homes 1–2 times a month on foot for hiking/walking (forest bathing). In particular, the older visitors(over 60s) tend to visit the forest more often than the younger ones (20s). Furthermore, more frequent visitors are more likely to live near the forest. As a result of analyzing the correlation between visit characteristics and ILS by controlling demographic variables, it was found that ‘visit frequency’ had a positive effect on ILS, and ‘proximity to the forest’ did not have a statistically significant effect on ILS. In other words, residents who live near the forests are more likely to be satisfied with their lives by visiting frequently. The significance of the study is that it statistically determined that visit frequency is a key factor for ILS. Future studies should take into account the various qualitative factors of forest visit such as vegetation, quantity and types of forest, which will contribute to setting the direction for urban forest development and management.
Introduction
Unlike the past when economic indicators like the GDP were considered important, the global attention is recently shifting toward quality of life and sustainability (Statistics Research Institute, 2017). The European Commission is having discussions how to measure the quality of life and how to reflect it, and various discussions are being conducted around the world to improve the quality of life of the people on the policies (National Well-being; Gross National Happiness [GNH]; Index of Well-being). Korea has also recently set the top-priority policy objective as to ‘improve the national quality of life’, thereby establishing and implementing policies by developing ‘Korean Quality of Life Index(Statistics Korea)’ and ‘Index of Well-being in Culture and Leisure (Ministry of Culture, Sports and Tourism)’.
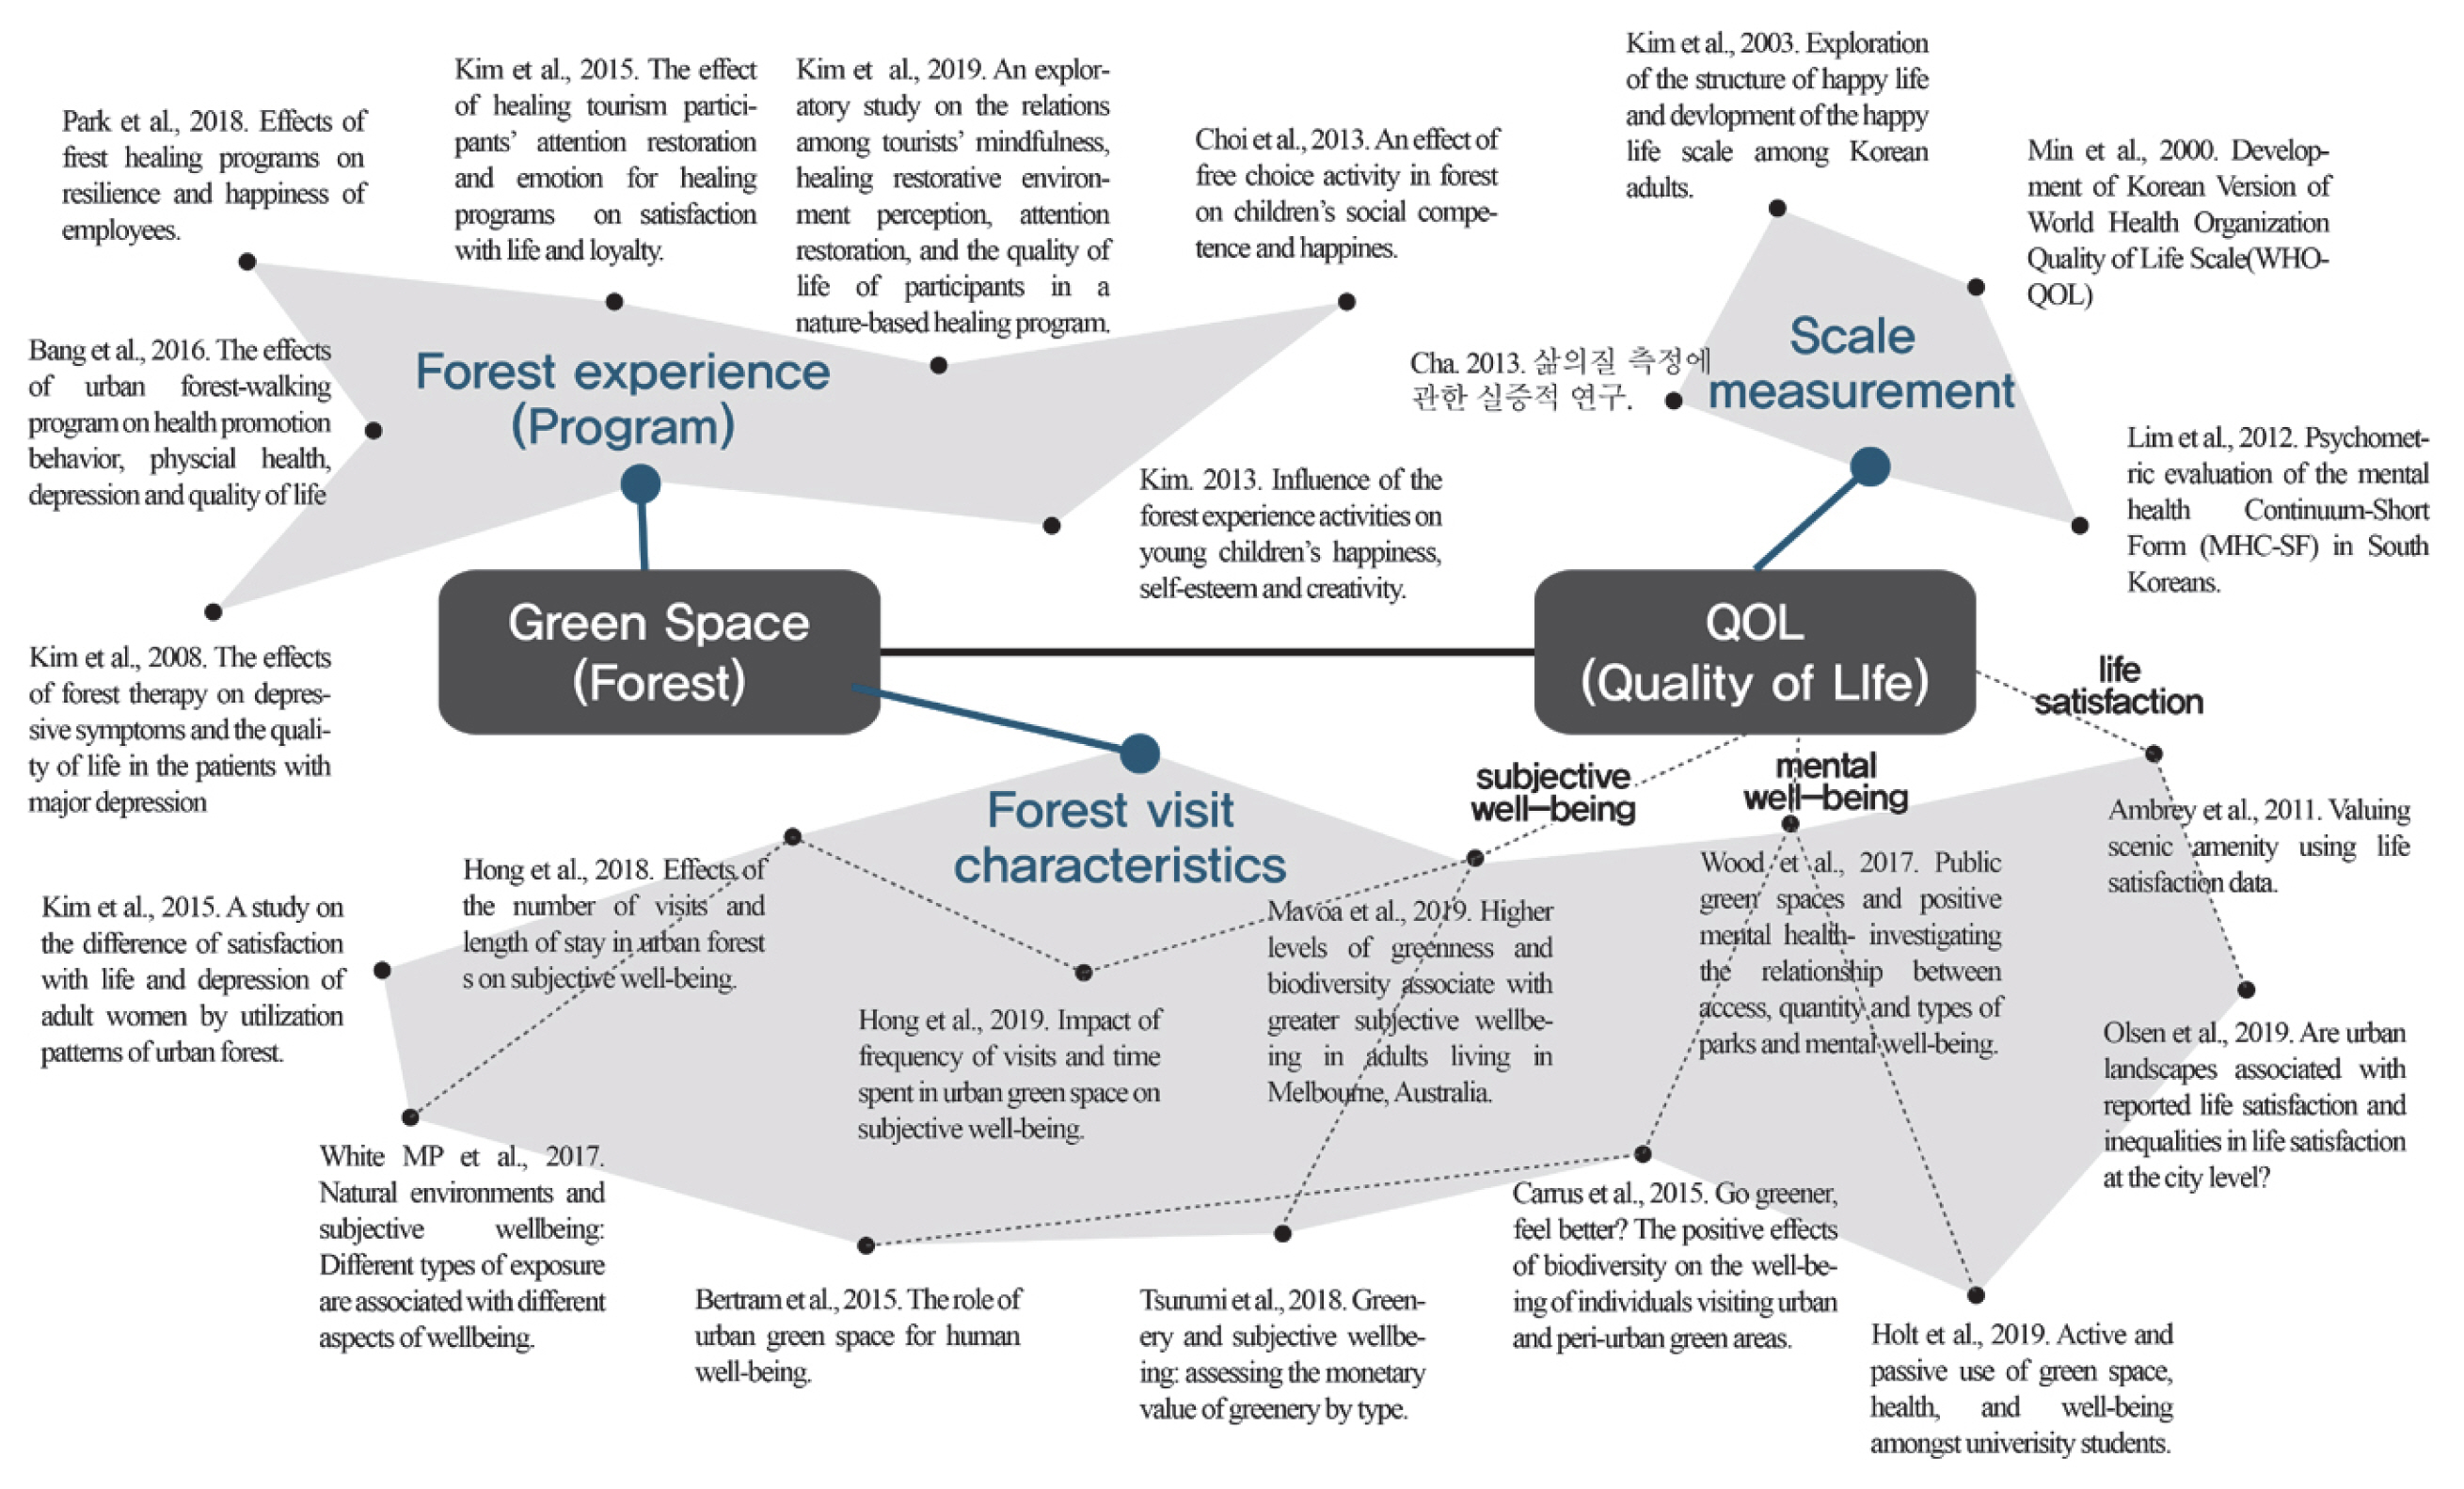
Many countries are using various indexes for quality of life based on the 11 dimensions of the OECD’s Better Life Index (BLI) (housing, income, jobs, community, education, environment, governance, health, life satisfaction, safety, work-life balance). Most countries are using indicators relevant to ‘health’ and ‘environment’, which shows their importance in rating the quality of life or well-being (Lee et al., 2016). In this trend, there is a growing interest in the function and value of forests that perform a key role in health and environment, and studies have been conducted actively all over the world on the relationship among forests, subjective well-being and quality of life (Ambrey and Fleming, 2011; Mackerron and Mourato, 2013; Tsurumi and Managi, 2015). There are various studies on the function and value of forests that contribute to improving the quality of human life, but in terms of cultural service, there are many research cases on ‘health’, such as participating in an urban forest walking program (Bang et al., 2016), amount and type of green area (Wood et al., 2017), green area user behavior (active, passive; Holt et al., 2019) and their relationship with quality of life. In Korea, there are many short-term studies that verify the effects of forest experience on individual quality of life by comparing subjects before and after participating in forest programs, such as effects of forest experience on middle-aged women’s happiness and positive psychology (Kim et al., 2013), effects of preschool children’s free play in the forest on their social competence and happiness (Choi et al., 2013), and effects of forest therapy programs on resilience and happiness of office workers (Park et al., 2018). On the other hand, many studies overseas analyzed the correlation between forest visit characteristics and individual quality of life, such as time spent in the forest (Hong et al., 2019), green area (White, 2017), and distance between residence and park (Ambrey and Fleming, 2011). In other words, unlike the domestic research trends, international studies show a pattern in which they rate overall individual quality of life in the mid- to long-term view. They also verified the effects of forest experience on individual quality of life in the short run and analyzed the correlation between forest visit characteristics and quality of life in the mid- to long-term view.
The result that there is a positive correlation between visit frequency and individual quality of life was consistent in many studies (Holt et al., 2019; Hong et al., 2019; van den Berg et al., 2016; White et al., 2017), but the relationship between time spent in the forest (Coldwell and Evans, 2018; Hong et al., 2019; van den Berg et al., 2016), proximity to forest and time (Ambrey and Fleming, 2011; Coldwell and Evans, 2018; Fan et al., 2011; Krekel et al., 2016; Wood et al., 2017), green area (Krekel et al., 2016), number of green spaces (Wood et al., 2017) and quality of life varies slightly among different studies. Since such research is very rare in Korea (Hong et al., 2019), there is a need for this kind of study (Fig. 1).
Meanwhile, in social science, researchers began to study happiness through objective indexes to take a scientific approach to the concept in the 1970s, and used the term ‘quality of life’ with focus on cognitive evaluation of life (Layard, 2006; Lim, 2012). The concept ‘quality of life’ is defined in various ways among researchers, such as quality of life (Bang et al., 2016; Kim and Kim, 2019), life satisfaction (Ambrey and Fleming, 2011; Olsen et al., 2019), subjective well-being (Hong et al., 2019; Mavoa et al., 2019), and happiness (Choi et al., 2013; Kim et al., 2013). This term has both diversity (or inclusiveness) and conceptual ambiguity at the same time (Yoo et al., 2018).
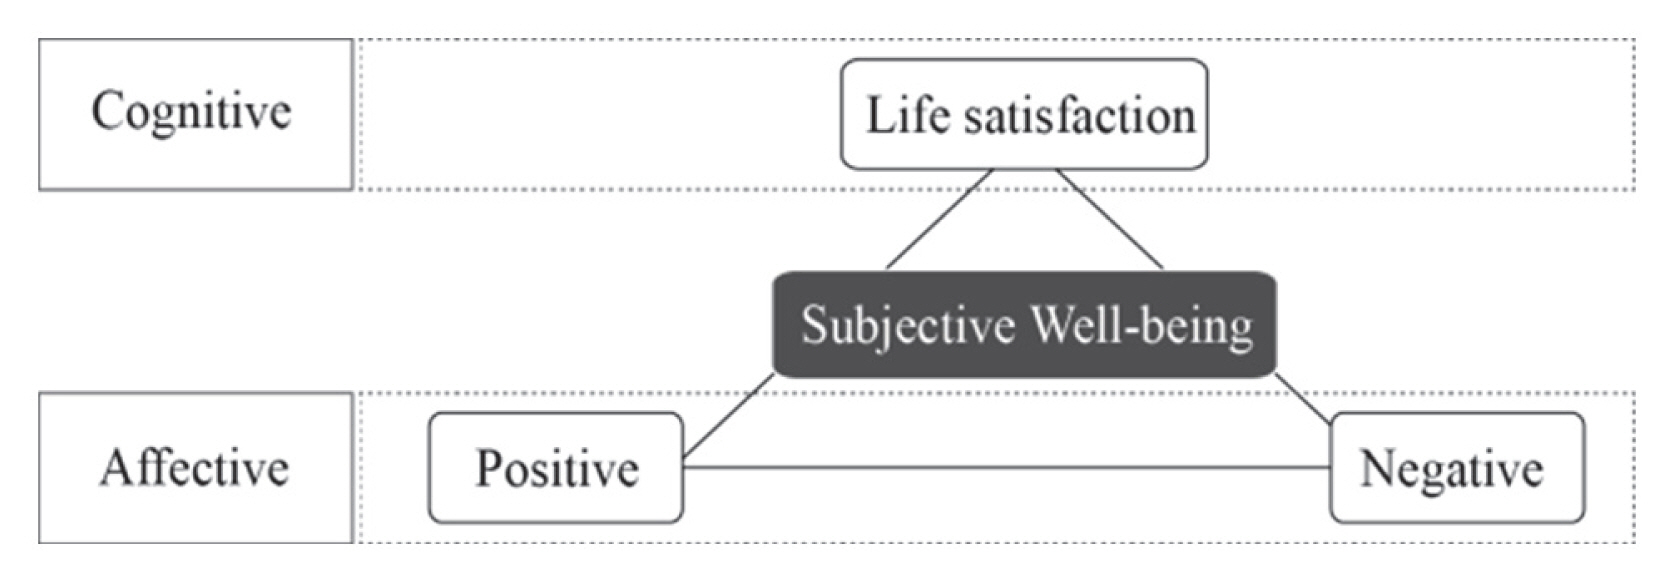
Diener conducted a study on ‘subjective well-being’ in 1984 to obtain universality and objectivity of the concept ‘quality of life’, and specified the key factors of this experience as cognitive factor of life satisfaction, and affective factors of positive and negative (Diener, 1984; Seo and Koo, 2011; Fig. 2).
Life satisfaction is a comprehensive evaluation of one’s life and one of the indicators of subjective well-being (Horley, 1984; Shin and Johnson, 1978), and it shows how satisfied individuals are with their lives. Moreover, quality of life can be measured in various aspects through basic life evaluation suitable for individual goals and performance (Diener et al., 2013). The most commonly used scale in the world in measuring life satisfaction is the Satisfaction with the Life Scale (SWLS; Diener et al., 1985), which has excellent reliability and validity and has its consistently verified multiple times. Furthermore, based on this scale, the Korean version of the Satisfaction with the Life Scale (K-SWLS; Cho and Cha, 1998) is also developed and used in Korea. In addition, Seo and Koo (2011) supplemented the SWLS and developed the Concise Measure of Subjective Well-being (COMOSWB) that is easy to use and can reflect the characteristics of individualist and collectivist culture (Table 1).
According to the results of ‘Measurement of National Quality of Life Through Forests (National Institute of Forest Science, 2018)’ by National Institute of Forest Science, most citizens claimed that ‘forests’ affect individual quality of life, especially in terms of health and environment. In other words, forests play a positive role in evaluating subjective quality of life that includes domains such as physical health, psychological health, social relations, and environment (Joo and Shin, 2008; Kim and Yoo, 2015). Korea Forest Service has established a policy to secure green areas in the neighborhood under the vision of “Korea in the Forest”. New words have been coined such as ‘forest sphere (close to forest)’ and ‘park sphere (close to park)’, and considering that some research findings prove that urban residents consider urban parks and hills near their homes as urban forests that they consider most important (Hong et al., 2018), neighborhood forests in daily life are becoming a key factor in the national quality of life. As such, the importance and utility of neighborhood forests are increasing as highly accessible SOC(Social Overhead Capital) in daily life in relation to the quality of life for urban residents. Yet there are very few research cases in Korea that analyzed the relationship between visit characteristics in neighborhood forests and life satisfaction. Therefore, the objective of this study is to determine how visitors use the forest in daily life and how these visit characteristics affect individual life satisfaction. The key hypotheses are: ‘Higher visit frequency will lead to higher individual life satisfaction’ and ‘Living closer to the forest will lead to higher individual life satisfaction’. This will provide the basic data to establish neighborhood forest policies and set the direction for planning.
Research Methods
Research model and hypotheses
The objective of this study is to determine how visitors use the forest in daily life and verify the causal relations between visit characteristics in neighborhood forests and individual life satisfaction, and thus we set up the research model as follows. In particular, we set up two research hypotheses to determine the relationship between visit characteristics in neighborhood forests and individual life satisfaction (Fig. 3). The first hypothesis (H1) was ‘Higher visit frequency will lead to higher individual life satisfaction’ and the second hypothesis (H2) was ‘Living closer to (or needing less time to arrive at) the forest will lead to higher individual life satisfaction’.
Survey and analysis method
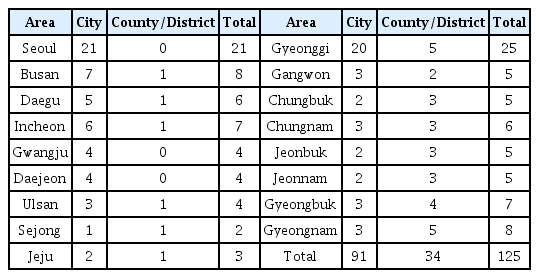
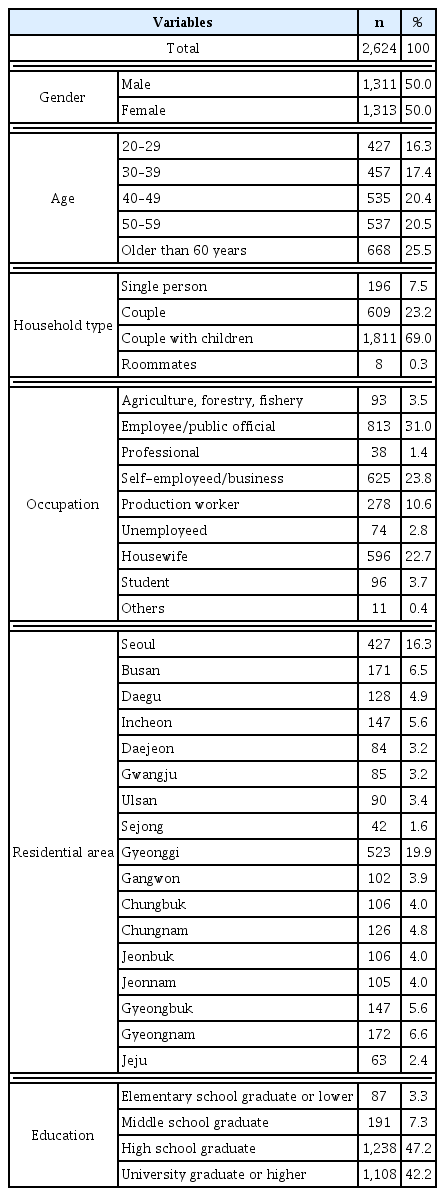
This study extracted 2,624 (male: 1,311, 50%, female: 1,313, 50%) subjects from the general public by proportionally allocating 42,099,186 citizens (Resident Registration Population Status, 2018) aged 19 and over living in 17 cities and provinces (Seoul, Busan, Daegu, Incheon, Gwangju, Daejeon, Ulsan, Sejong, Gyeonggi, Gangwon, Chungbuk, Chungnam, Jeonbuk, Jeonnam, Gyeongbuk, Gyeongnam, Jeju) by age and gender. Probability proportional to size (PPS) sampling was used to extract 125 areas for study from 17 cities and provinces, and 20–21 persons from each area were surveyed (Table 2). Data was collected from one-on-one interviews by an investigator of a specialized research agency for one month in May 2018, and data from total 2,624 subjects were ultimately analyzed.
To determine the visit characteristics in neighborhood forests, we conducted a survey on visiting forests within 4 hours considering the travel time back and forth and the time spent in the forest. The survey items are comprised of demographic characteristics (gender, age, residential area, occupation, education level, residential type) and forest visit characteristics (visit frequency, means of transportation, proximity to forest, activities). Park et al. (2005) claimed that different variables significantly affect quality of life. Based on the results of previous studies proving that various personal attributes affect quality of life (Chun and Kim, 2017; Kang and Moon, 2011), this study analyzed the intrinsic effects of forest visit characteristics (visit frequency, means of transportation, proximity to forest) on individual quality of life by controlling demographic variables (Table 3). To determine individual life satisfaction, we used items of Concise Measure of Subjective Well-being (COMOSWB) developed by Seo and Koo (2011) by supplementing the SWLS so that it is easy to use and can reflect the characteristics of individualist and collectivist culture. This is comprised of nine items rating life satisfaction, positive emotions and negative emotions based on Diener’s theory of subjective well-being (Diener, 1984), rated on a 7-point scale (1:strongly disagree ↔ 7: strongly agree). Three of the items were to rate life satisfaction, questioning satisfaction in terms of personal (personal achievement, personality, health, etc.), relational (relationship with family, colleagues, etc.), and collective (school, work, clubs, etc.) aspects. The other six items were items rating positive (joyful, happy, peaceful) and negative (irritated, negative, helpless) emotional experience that are relevant to emotional happiness on a 7-point scale (1 point: never ↔ 7 points: always). The final happiness score is the sum of satisfaction and positive emotions subtracted by negative emotions (Table 1). The COMOSWB is a verified scale that maintains the basic factor structure of happiness, shows high reliability and validity despite the few items, and well reflects cultural fairness and daily emotional experience (Seo and Koo, 2011). In this study, we conducted a survey rated on an 11-point scale (0 point: strongly disagree ↔10 points: strongly agree) according to the personal, relational and collective aspects. Moreover, since it is possible to use all or part of the items depending on the researcher’s need (Seo and Koo, 2011), we adopted only three items (personal, relational, collective) in terms of life satisfaction from the COMOSWB to meet the purpose of this study.
The data collected were analyzed using SPSS 23.0. We first reviewed data errors and conducted frequency analysis and descriptive statistics to determine the characteristics of each variable. Then we conducted cross-tabulations and chi-square analysis to examine the relationship among demographic characteristics, forest visit characteristics and the variables overall. Moreover, to examine how visit characteristics in neighborhood forests affect individual life satisfaction at the national level, we performed hierarchical regression and ANOVA with visit characteristics such as visit frequency, proximity to forest, and means of transportation as independent variables, and then conducted Scheffe test as a posteriori test. There were control variables (demographic characteristics) in level 1, and independent variables were added in level 2. Hierarchical regression is used to determine the size of relative effect of independent variables in order when multiple independent variables affect dependent variables, such as the independent variable that has the greatest effect over the dependent variables and the one that has the second-greatest effect, and so on (Song, 2008). In this study, we used this method to analyze the effect by controlling the variables.
Results and Discussion
Demographic characteristics and visit characteristics in neighborhood forests
Demographic characteristics
Since the samples were extracted by proportionate sampling based on gender and age, the gender ratio of respondents is the same (50%), and the age groups are evenly distributed among 20s (16.3%), 30s (17.4%), 40s (20.4%), 50s (20.5%), and 60s and over (25.4%). Most of them lived in Gyeonggi (19.9%) or Seoul (16.3%), and most had the residential type of ‘parent-children living together (69.0%)’. The highest percentage of respondents were employees/public officials (31.0%), followed by self-employed/business (23.8%), and homemakers (22.7%). Most of them were high school graduates (47.2%), followed by university graduates (42.2%; Table 4).
Visit characteristics in neighborhood forests
To determine the usage patterns in neighborhood forests, we surveyed the general public on forest visit frequency, means of transportation they use to get to the forest, and proximity to forest, and had the respondents choose multiple forest activities. The results of analysis showed that most of the respondents visited the forest 1–2 times a month (27.6%), followed by 1–2 times a week (18.4%), 3–4 times a year (15.9%), and 1–2 times a year (15.6%). Most of them visited the forest on foot (38.4%), followed by car (32.1%). For proximity to forest, many of them took 10–30 minutes (32.1%) to get to the forest, followed by 30 minutes–1 hour (27.7%). The most common activity was hiking/walking (forest bathing) (76.8%), followed by resting/meditating (46.6%), and appreciating nature (36.4%; Table 5). In sum, the respondents showed a pattern in which they visited the forest located within a distance of 10–30 minutes from their homes 1–2 times a month on foot to hike or take a walk (do forest bathing). In other words, neighborhood forests used in daily life were located near the residential area, accessible on foot, and used for hiking/walking (forest bathing).
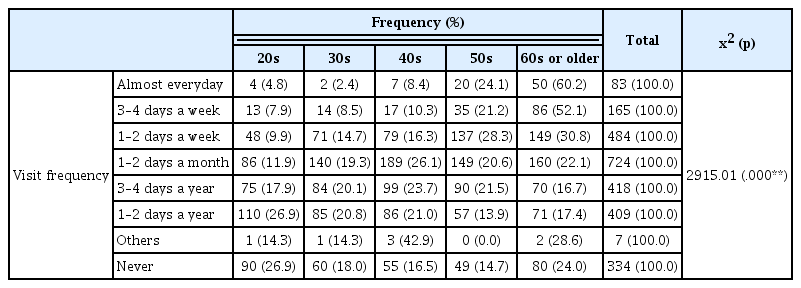
Furthermore, we conducted an in-depth analysis on visit characteristics in neighborhood forests through cross-tabulations and chi-square (x2) analysis with age, visit frequency, means of transportation, and proximity to forest. First, the chi-squared test for visit frequency by age showed that x2 was 2915.01(p<.001), and thus there was a difference in distribution of visit frequency by age. The respondents in their 60s or older frequently visited the forest, almost every day (60.2%) or weekly (52.1%, 30.8%), or did not visit at all (24.0%). The 40s visited the forest 1–2 times a month (26.1%) or 3–4 times a year (23.7%), while the 20s mostly visited 1–2 times a year (26.9%), and there was a high percentage that did not visit at all (26.9%). In other words, the forest visit frequency was generally higher among older age groups, but there were also many cases in which they did not visit at all. Moreover, younger age groups showed lower forest visit frequency and even did not visit at all (Table 6).
Second, the chi-squared test for means of transportation according to visit frequency showed that x2 was 3417.59 (p<.001), and thus there was a difference in distribution of means of transportation according to visit frequency. Most of the respondents that visited the forest almost every day or weekly went to the forest on foot, while those visiting monthly showed a similar ratio of going on foot (40.6%) and by car (37.4%). Those visiting yearly mostly went to the forest by car (58.1%, 59.4%). In other words, those with higher visit frequency tended to visit the forest on foot rather than by car (Table 7).
Third, the chi-squared test for means of transportation according to proximity to forest showed that x2 was 3296.274 (p<.001), and thus there was a significant difference in distribution of means of transportation according to proximity to forest. When the respondents lived within a 10-minute distance to the forest, most of them (78.8%) visited the forest on foot. Many respondents who lived within the distance of 10–30 minutes from the forest also visited on foot (51.5%). On the other hand, many of those living within the distance of 30 minutes–1 hour or more than 1 hour visited by car (44.8%, 53.7%). In other words, those living within a 30-minute distance from the forest mostly visited on foot, whereas those living more than 30 minutes away mostly visited by car (Table 7).
Fourth, the chi-squared test for proximity to forest according to visit frequency showed that x2 was 2915.014 (p<.001), and thus there was a significant difference in distribution of proximity to forest according to visit frequency (Table 8). Many of the respondents who visited the forest almost every day lived within the distance of 10–30 minutes (37.3%) or 10 minutes (32.5%) from the forest. Those visiting weekly mostly lived within the distance of 10–30 minutes. Many of those visiting monthly lived within the distance of 10–30 minutes (36.3%) or 30 minutes–1 hour (34.1%), while those visiting yearly mostly lived within the distance of 30 minutes–1 hour (38.3%, 37.7%). In sum, those with higher visit frequency tended to live closer to the forest.
Moreover, ANOVA was conducted to examine the relationship between visit frequency and proximity to forest, which are the two key independent variables of visit characteristics. The results showed that the p-value was less than 0.001, and thus there was a significant difference in visit frequency according to proximity to forest, and closer proximity to forest led to higher visit frequency (Table 9). In particular, as a result of conducting Scheffe analysis as a posteriori test to verify the significant differences among groups, visit frequency was higher among the proximity of ‘within 10 minutes’ than ’10–30 minutes’, and ‘10–30 minutes’ than ‘1 hour’, thereby showing a significant difference. In other words, those living within the distance of 1 hour or less tended to visit the forest more frequently if they lived close to the forest. Hong et al. (2019) also proved the negative correlation between the travel time from residential area to green space and visit frequency, which is consistent with the results of this study. When planning to create a forest in the neighborhood, the opportunities for users to visit forests can be increased by creating the forest closer to residential areas considering physical accessibility. However, there are limitations in failing to reflect proximity to forest according to means of transportation, which raises the need to conduct additional analysis accordingly.
Visit characteristics in neighborhood forests and individual life satisfaction (ILS)
Measurement of individual life satisfaction (ILS)
We conducted frequency analysis and correlation analysis to determine the direction and degree of relevance between forest visit characteristics and ILS variables before determining the effects of visit characteristics in neighborhood forests on individual life satisfaction (Table 10). Among the three variables of ILS (personal, relational, collective), the ‘relational’ factor (7.51) turned out to have the highest mean, followed by personal (7.39) and collective (7.31), but there was not much difference of means among the variables. The result of correlation analysis showed that the ‘personal’ factor had somewhat high correlation coefficients: .644 with ‘relational’ and .625 with ‘collective’. The ‘relational’ factor also had somewhat high correlation with ‘collective’ at .677. Therefore, we focused on analyzing the sum of personal, relational and collective scores as individual life satisfaction rather than dividing the three variables.
Relationship between visit characteristics in neighborhood forests and ILS
(1) Visit characteristics in neighborhood forests and ILS
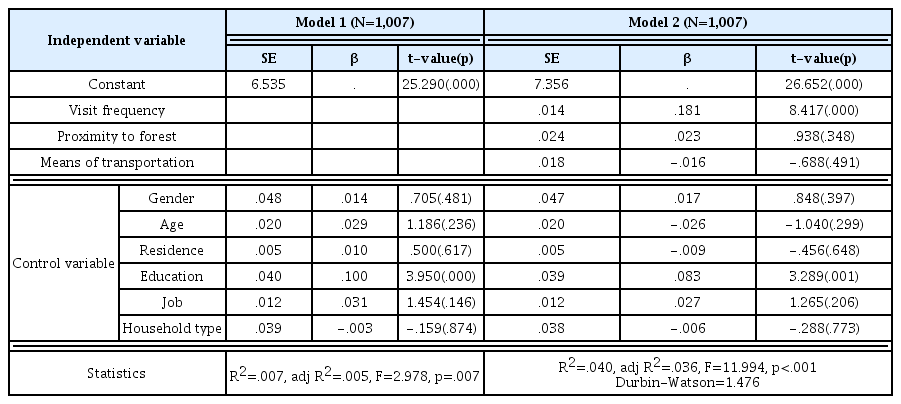
The results of analysis showed that when gender, age, residential area, education level, occupation, and residential type were equivalent, higher forest visit frequency led to higher individual life satisfaction. As shown in Table 11, as a result of conducting regression analysis with variables such as gender, age, residential area, education level, occupation, and residential type (model 1), only 0.7% (R2) of ILS variance was explained. After controlling the demographic variables above and putting three ILS variables such as visit frequency, proximity to forest and means of transportation, 4.0% of ILS variance was explained, thereby showing a 3.3% increase. The visit characteristic that had a significant effect on ILS was visit frequency (β=.181, p<.01). There was no problem with multicollinearity, and Durbin-Watson was 1.476 and thus the regression model was suitable. In this study, the correlation between proximity to forest and visit frequency turned out to be significant, but only visit frequency was significant when analyzing the relationship with individual life satisfaction. This may be due to the fact that the demographic variables were controlled in analyzing the relationship with individual life satisfaction, but these demographic variables affected the correlation between proximity to forest and visit frequency, thereby showing different results.
These findings are supported by many previous studies on forests and quality of life (Holt et al., 2019; Hong et al., 2019; van den Berg et al., 2016; White et al., 2017). Most studies proved that visit frequency had positive effects on quality of life. White et al. (2017) in particular analyzed the correlation between exposure to nature and subjective well-being, showing that visit frequency had a positive effect on subjective well-being but proximity to forest did not affect subjective well-being, thereby presenting consistent results with this study. Moreover, previous studies arguing that proximity to forest does not affect quality of life (Fan et al., 2011; White et al., 2017) also support this study. However, there are some studies claiming that living closer to green areas led to higher life satisfaction (Krekel et al., 2016; Wood et al., 2017). Thus, it is necessary to determine the relevance between proximity to forest and quality of life through various follow-up studies.
Meanwhile, among the visit characteristics, proximity to forest and means of transportation did not have a significant effect on ILS. Urban forest visitors obtain positive emotions in terms of personal, relational and collective aspects through trivial and pleasant experiences in daily life, and visit the forest again as a means to maintain their improved positive emotions, forming a virtuous cycle (Hong et al., 2018). On the other hand, unlike visit frequency, proximity to forest did not affect improvement of individual life satisfaction. Some previous studies discovered that closer proximity to forest led to improved quality of life (Hong et al., 2019; Krekel et al., 2016; Wood et al, 2017), but others argued that visiting a forest far away from home may rather have a positive effect on quality of life as it gives the feeling of ‘being away’ from everyday life (Bratman et al., 2012; Coldwell and Evans, 2018).
(2) Characteristics of visitors coming on foot and ILS
Since this study has limitations in that it failed to reflect proximity to forest according to means of transportation, we additionally analyzed the correlation among visit frequency, proximity to forest and ILS of only visitors coming to the forest on foot. The explanatory power increased by 0.7% after controlling the demographic variables (R2=.025) compared to not controlling them (R2=.018, model 1). Moreover, there was no problem with multicollinearity, and Durbin-Watson was 1.450 and thus the regression model was suitable (Table 12).
The results of analysis showed that, even in the group visiting the neighborhood forest on foot, only visit frequency (β=.082, p<.05) had effect on ILS, while proximity to forest was not significant. In other words, even those visiting on foot showed high individual life satisfaction only when they visited the forest frequently (visit frequency) rather than having to live in close proximity to forest. This clearly proved that visit frequency in using a neighborhood forest is an important factor of individual life satisfaction.
In sum, even if there is a forest near the residential area, life satisfaction of visitors increased only when they frequently visited the forest. According to the results of this study, even if there are many forests near the residential area, they contribute little to the improvement of individual life satisfaction unless the visitors visit the forests frequently to carry out forest activities. This result shows the policy implication that, while it is important to quantitatively expand and create neighborhood forests, it is rather necessary to develop contents that will attract visitors to more enthusiastically and frequently use the currently existing neighborhood forests.
Conclusion
In this trend where the global attention is shifting toward quality of life and sustainability, there is growing interest in the function and value of forests that perform a key role in health and environment. In particular, the importance and utility of neighborhood forests are increasing as highly accessible SOC in daily life in relation to the quality of life for urban residents, and yet there are very few research cases in Korea that analyzed the relationship between visit characteristics in neighborhood forests and life satisfaction. Therefore, this study was conducted to determine how Korean citizens use the forest in daily life and how these visit characteristics affect individual life satisfaction. The key results of analysis can be summarized as follows.
First, the respondents showed a pattern in which they visited the forest located within the distance of 10–30 minutes from their homes 1–2 times a month on foot for hiking/walking (forest bathing). Older groups generally showed higher forest visit frequency, while younger groups visited relatively less. Moreover, higher visit frequency indicated that the respondents lived closer to the forest, and they usually visited the forest on foot. As a result of analyzing the correlation between visit frequency and proximity to forest, it was found that those living within the distance of 1 hour or less from the forest tended to visit more frequently when they lived closer to the forest.
Second, as a result of analyzing the intrinsic correlation between visit characteristics and individual life satisfaction by controlling the demographic characteristics, it was found that forest visit frequency of users had a positive effect on individual life satisfaction. On the other hand, proximity to forest and means of transportation did not have a significant level of effect on individual life satisfaction.
This study has significance as it statistically determined that visit frequency is a key factor of individual life satisfaction among visit characteristics in neighborhood forests at the national level. However, it failed to consider the locational characteristics of forests in urban and non-urban areas due to the nature of the national-level study, and thus it is necessary to specifically design a survey considering the regional attributes in further research. By closely examining the relationship with life satisfaction considering the size, type and vegetation of neighborhood forests in addition to the variables such as visit frequency, proximity to forest, and means of transportation analyzed in this study, it would be possible to contribute to setting the direction for development and management of urban forests.

