Assessment of Plant Growth Stability on Vegetation Unit-based Bio-filter linked to AHU
Article information
Abstract
People today spend 80% of their time indoors and have been showing keen interests in air quality since 2015 due to harmful chemical issues such as humidifier disinfectants. Although plant-based air purification method is widely known to the public, its objective performance and air-conditioning efficiency have been limited. In particular, in the case of publicly used places frequented by many and unspecified persons, high air-conditioning wind volume is required and it is difficult to secure the required total wind volume with the current air purification method using plants. Therefore, in order to secure air-conditioning wind volume when linked with plants, this study aims to verify stability in using vegetation units that can be linked with building air-conditioning equipment. To this end, vegetation units and AHU were linked for 40 hours under no irrigation conditions and ecological environmental changes were monitored objectively. Pressure loss by total wind volume of vegetation units was verified, and soil moisture, Chlorophyll, and FVC were monitored. First, soil moisture was converged to 0% at a spot where wind volume is concentrated in vegetation units. In both of two types of tree species, chlorophyll showed a change of 1.2 - 2.9 SPAD and FVC showed a change of 4-29% after the experiment.
Introduction
Health risk issues associated with OIT (octylisothiazolinone) contained in antibacterial filters, and CMIT (Methylchloroisothiazolinone) and MIT (Methylisothiazolinone) used in humidifier disinfectants have been raised since 2015 (Ministry of Environment, 2016). This has made the general public who stay indoors for a long time more interested in the quality of indoor air. In terms of plant-based air purification methods widely known to the public, only limited objective data are available on their performance and air-conditional efficiency, and thus it has been difficult to expand the methods for industrial purposes. In particular, public facilities used by many unspecified individuals require a sufficient air-conditioning air volume, but with plant-based method, it is difficult to supply fresh outdoor air to the inside of buildings. In order to address these structural problems, vegetation bio-filters can be used by connecting them to an air handling unit (AHU) in a building. There are some earlier studies on the method. Kim et al. (2015) monitored and analyzed soil moisture and plant growth in a small-scale vegetation bio-filter using a wick-type humidifying method, and Choi et al. (2014) monitored changes in plant growth, humidity, soil moisture and pressure loss in a flat-type vegetation bio-filter depending on wind speed conditions, examined the performance of the bio-filter and identified proper wind speed levels for better plant growth. There are also studies on the air purification performance of bio-filters. Jung et al. (2015) examined the effects of a wall-mounted vegetation bio-filter on the improvement of the quality of indoor air, and the usability of bio-filters indoors depending on the level of plant growth, and Lee et al. (2015) monitored the stability of the air flow of a wall-mounted vegetation bio-filter depending on humidification cycle, and its removal rate of fine dusts and volatile organic compounds. These earlier studies quantified the performance of vegetation bio-filters, but they were conducted in an experimental environment at the filtration speed of 0.1 m・sec-1 or lower, which is different from the air-conditioning environment of bio-filters directly connected to an AHU. There was no study on a vegetation bio-filter that is directly connected to an AHU in order to secure a sufficient amount of the air-conditioning flow indoors.
This study aimed to examine the stability of a vegetation unit-type bio-filter system that is connected to a general AHU and uses artificial soil through the assessment of vegetation growth. To create an objective test environment, test standards provided by relevant organizations were referred to, and the performance of soil and plants were monitored quantitatively by determining an optimal total air volume and pressure loss.
Theoretical Discussion
Quantification of vegetation cover
Indicators such as greenness index, fractional vegetation cover (FVC), etc are used to quantify vegetation cover. The greenness index is the coverage rate of plant leaves within the field of vision of an observer who is standing at a certain point, and there are several studies on this. Nam et al. (2012) conducted chromaticity analysis using a digital color comfort meter, and Park (2005) analyzed the greenness index of the photoshopped images taken on site using a weight measurement technique. Choi el al. (2016) analyzed the greenness index using an area calculating method and AutoCAD. Likewise, the greenness index is calculated by relying on the vision of a researcher, and thus it has been recognized that it is difficult to obtain objective data using the greenness index due to the different skill levels of individuals and errors. Whereas, fractional vegetation cover (FVC), used as basic data to predict plant growth, is a ratio of vegetation cover to a shaded area created by vegetation on the surface. FVC is an indicator of the total vegetation amount, and is calculated as an area ratio (range: 0~1) of the vegetation coverage of a vegetation canopy to the total space. FVC is used to monitor vegetation and soil in fields such as environment, agriculture, forestry and hydrology (Park et al., 2015). One of the methods used to calculate FVC is a digital hemispherical photography (DHP), and the physical vegetation indicator is calculated by measuring the void ratio of vegetation using a super wide lens (Jonckheere et al., 2004; Weiss et al., 2004). As it became possible to measure FVC using general optical instruments and to increase convenience, various analysis programs have been developed abroad. CAN EYE is one of them, developed by the Environnement Méditerranéen et Modélisation des Agro-Hydrosystèmes (EMMAH) under the French National Institute for Agricultural Research (INRA). This DHP-based FVC analysis software can analyze images taken using both general and fish-eye lenses, and calculate an area ratio of the vegetation coverage of a vegetated canopy based on true-color images. Here, f COVER is the cover fraction of vegetation or soil. The area ratio of soil covered with vegetation at a certain zenith angle can be calculated using the following equations, and the ratio is determined by variables including fractional cover, zenith angle range and fractional vegetation cover.
f Cover : Fractional Cover
P 0(0) : Zenith Angle Range (0-10°)
FVC : Fractional Vegetation Cover
f Cover : Fractional Cover
Standards for bio-filter performance tests
Prior to assessing the performance of a vegetation bio-filter in an objective way, it is required to review standards provided by relevant domestic and international organizations and to determine test methods and instruments based on them. National test standards that can be referred to when assessing the air purification performance of a vegetation bio-filter are as follows. According to the “Health-friendly Housing Construction Standards” issued by the Ministry of Land, Transport and Maritime Affairs, “KS I 16000-9: Indoor air — Part 9: Determination of the emission of volatile organic compounds from building products and furnishing — Emission test chamber method” and “KS I ISO 2007: Determination of the emission rate of formaldehyde and volatile organic compounds in building interior products – Large chamber method” can be considered. “SPS Standards” established by the Korea Air Cleaning Association, and the “Guidelines for Indoor Air Quality Management” issued by the Ministry of Environment (especially the indoor air quality section in the type approval and performance test methods for environment measurement equipment and indoor air quality measurement standards) can be also considered. It is necessary to conduct tests of various air pollutants on vegetation bio-filters to meet the criteria for the maintenance and recommendation of indoor air quality in public use facilities. In the case of CO2 included in the criteria, there are not many standards available that can be referred to when determining test instruments. Therefore, standards for volatile pollutants such as “KS I ISO 16000-9: Determination of the emission of volatile organic compounds from building products and furnishing - Emission test chamber” can be considered in designing instruments for tests of multiple air pollutants. For emission tests, chambers made of surface-treated stainless steel or glass are used mostly, and the chambers are sealed to prevent air exchange. In addition, it is necessary to create an experimental environment in which the frequency of ventilation can be controlled consistently with instruments with a high precision (±5%). It is also necessary to maintain a proper level of temperature and relative humidity when testing air pollutants, and according to “ISO 554,” tests should be conducted at the temperature of 23±2°C, and the relative humidity of 50±5%RH within their error tolerance. In terms of the air velocity of test specimens, it is recommended to maintain 0.1~0.3 m・sec-1 according to “KS I ISO 16000-9,” and to ventilate the inside of the chamber regularly and to conduct a regular inspection at least once 12 months (KSSN, 2014).
Types of vegetation bio-filter systems
Vegetation bio-filter systems can be divided depending on the type of base materials into “soil-based unit type,” “vertical aquaculture type,” and “waterway unit type.” This technology classification is also related to the air-conditioning air volume and filtering wind speed of each system. One of the commercialized soil-based unit-type products is “Naava” developed by NatureVention. a Finnish company. This is an OS-based automated system for real-time monitoring and maintenance using IoT technology. The bio-filter used within the system is a soil-based unit-type filter, and the filtering wind speed is maintained within the range of 1~3 cm・sec-1 in order to secure biological purification through biodegrading microorganisms in soil (Naturvention, 2017). “Living Wall Bio-filters” developed by Nedlaw, a Canadian company, is a commercialized vertical aquaculture system. This system can be connected to an AHU, and uses chemical fiber. With its vertical aquaculture structure, structural issues found in existing soil-based systems such as subsidence and corrosion caused by the self-load of soil can be addressed. This also can be directly connected to an AHU in a building, and secure a sufficient indoor air-conditioning volume by maintaining its filtering wind speed at 1~2 m・sec-1 (Nedlaw, 2017). One of the commercialized waterway unit-type products is “AMPS.” This unit-type system was developed by SOM, an American architecture company, in collaboration with Rensselaer Polytechnic Institute, and integrates vertical aquaculture and waterway together. Here, modules are arranged to form a right angle in order to maximize the air purification performance of plants used in the system. In addition, as the system is designed to deal with a large air-conditioning volume, it can be directly connected to an AHU in a building (SOM, 2010). The systems discussed above show different characteristics in terms of removal efficiency and air-conditioning volume, and thus it is necessary to select a system suitable for the size and air-conditioning volume of a target space.
Materials and Methods
Test procedure
This study aimed to monitor the predictable stability of plant growth in a vegetation bio-filter system connected to an AHU in a general building, and the test procedure is as follows. First, based on relevant test standards, an AHU-connected test chamber was designed and produced. A monitoring scenario required to measure the air-conditioning performance of the chamber, such as total air volume, pressure loss, etc. and the stability of plant growth was designed to be integrated to the established test sample. A proper total air volume for the planned vegetation unit-type bio-filter was calculated, and the FVC of the vegetation unit that was watered and cured prior to the test was monitored. The bio-filter was connected to an AHU and the test chamber, and its air-conditioning air volume, soil moisture, temperature and humidity were monitored for 40 hours. After completing the test, the stability of the growth of the applied plants was monitored (Kim et al., 2015).
Establishment of test infrastructure
The test infrastructure was created as shown in Fig. 1 in order to assess the objective air-conditioning performance of a vegetation unit-type bio-filter connected to an AHU, and the stability of plant growth. The infrastructure was composed of a test chamber (IAQ Chamber), an AHU and a flow nozzle chamber. The test chamber was produced using aluminium profile (40 mm) and PC (t = 5 mm) according to “ISO 16000-9: Determination of the emission of volatile organic compounds from building products and furnishing - Emission test chamber,” and its unit volume was designed to be 1,000 mm × 1,000 mm × 1,000 mm in order to increase convenience for different types of tests. The AHU used in this study is a system used in a general building and is composed of a supply fan, a return fan and a 3,425 rpm motor. In order to secure a sufficient monitoring range to meet the rated output of the AHU, a flow nozzle chamber was designed to have 2 different nozzles (3 inch and 7 inch) that can be selectively used. The wind speed of each nozzle was maintained at 35 m・sec-1 or lower and differential pressure and pressure difference were measured to secure the reliability of data.
AHU Integrated IAQ Chamber System.
Monitoring design
In this study, the operation of the developed system was monitored using the devices listed in Table 1 in order to assess the air-conditioning performance of the vegetation unit-type bio-filter and the stability of plant growth. Monitoring was conducted inside and outside the test chamber respectively. First, outside the chamber, the stability of the growth of plants applied to the vegetation units was assessed by measuring chlorophyll and FVC before and after the test. Inside the chamber, the differential pressure of the test infrastructure to which the vegetation units were applied was measured, and the total air volume and filtering wind speed were calculated according to “KS b 6311: Testing methods for industrial fans.” In addition, soil moisture was monitored using time series analysis and regression analysis was conducted on the stability of plant growth.

Specification of Monitoring System.
Modeling of test sample
The vegetation unit-type bio-filter used in this study is an access floor system designed for outdoor purposes (Fig. 2). The bio-filter is composed of vegetation units, coal ash-based artificial lightweight aggregate and vegetation models. Vegetation units were molded with H.D.P.E (high density poly ethylene) added with a sunscreen agent, and the main body (550 mm × 333 mm × 80 mm) was attached with a plus corn (500 mm × 333 mm × 50 mm). Since there is a protrusion on the inner bottom of the unit used to insert the plus corn, they can be arranged in a lattice structure. This module structure ensures such unit-type bio-filters can be installed in different shapes of sites in a convenient and flexible manner.
Access floor type plant unit.
Coal ash-based artificial lightweight aggregate is a high-functional artificial ceramic soil produced by processing the waste of coal-fired power generation at a high temperature. It shows the characteristics of lightweight soil, contains moisture and minerals that are required for the growth of plants, and thus has physical properties that can optimize functions such as supplying and draining water, supplying oxygen, etc. The size of particles was ∅20 mm, and its void ratio was about 75%. Vegetation models applied to the system were 2 species (Epipremnum aureum and Fatsia japonica), and 3 units were created for each species, a total of 6 vegetation units. The average length of Epipremnum aureum and Fatsia japonica was 14.6 cm and 11.9 cm respectively, and 9~10 plants were planted in each unit. After watering plants for 10 minutes and curing them for 24 hours, the FVC of the units was measured, and after that they were installed in the test chamber.
Test design and methods
Fig. 3 shows the stability of plant growth and the test environment for the vegetation unit-type bio-filter connected to the AHU. First, in consideration of the operating conditions of the AHU and pressure loss, the standard total air volume was determined, and, it was decided to operate a return fan solely based on the monitoring results of the sensitivity of pressure loss. To monitor the stability of plant growth, the units planted with Epipremnum aureum were placed in the lower part of the test chamber, and those planted with Fatsia japonica were placed in the upper part. Here, a soil moisture sensor was installed at a point near the air vent in the Epipremnum aureum section, and the other soil moisture sensor was installed at a point where the wind tunnel was shaded in the Fatsia japonica section. In addition, chlorophyll was measured 5 times (repeating 5 times for each measurement) before and after the test respectively. Photos of each vegetation model were taken 6 times using a DSLR and fish-eye lens, and FVC was calculated.

Test setting of AHU connected IAQ chamber.
Determination of standard total air volume and pressure loss conditions
Air-conditioning conditions need to be optimized to create a test environment suitable for the vegetation unit-type bio-filter connected to the AHU. To do so, the total air volume conditions that showed evenly-distributed pressure loss were selected first, and the filtering wind speed was decided to be maintained within the range of 0.1~0.3 m・sec-1 . Fig. 4 and Table 2 show pressure loss under each total air volume condition. Pressure loss was evenly distributed (standard deviation=lower than 1) when the total air volume was 400 or 600 CMH. Out of them, 600 CMH was selected as the standard total air volume since it meets the condition of filtering wind speed per unit area (1 m2) of the bio-filter. Based on the standard total air volume, the average wind speed of the three air vents created in the test chamber was maintained at 2.36 m・sec-1 , and the average filtering wind speed per unit area, 0.16 m・sec-1 . The chamber was continuously monitored for 40 hours.
Pressure Loss of Access Floor Type Plant Unit (unit: Pa).
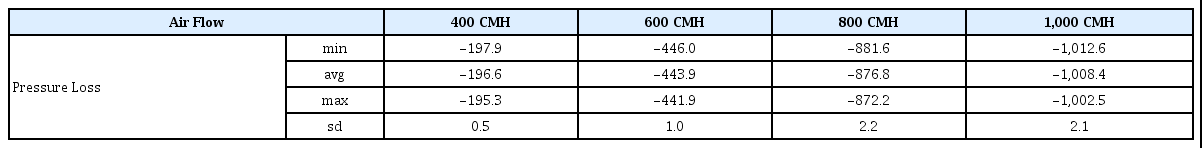
Pressure loss of access floor type plant unit (unit: Pa).
Results and Discussion
Analysis of the stability of plant growth: Soil moisture
The soil moisture of coal ash-based artificial lightweight aggregate was measured under the determined filtering wind speed conditions using time series analysis, and Fig. 5 shows the results of quadratic regression analysis. Based on the results of the assessment of stability, changes in soil moisture depending on the filtering wind speed can be objectified, and a regression equation that can be applied to the watering cycle algorithm can be obtained. First, the monitoring results of the front side-A of the units planted with Epipremnum aureum are as follows. The average filtering wind speed of the bottom of the air vent was 2.36 m・sec-1 , and its quadratic regression equation (y=10.239x2 -880547x+2E+10, R2 =0.9846) showed that soil moisture rapidly decreased right after beginning the test. Soil moisture continued to decrease, and reached 0% after 40 hours.
Soil Moisture Monitoring of Access Floor Type Plant Unit in AHU Connected IAQ Chamber (unit: %).
Meanwhile, the monitoring results of the back side-B of the units planted with Fatsia japonica are as follows. A soil moisture sensor was installed at a shaded point away from the 3 air vents, and its average filtering wind speed was 0.16 m・sec-1 . Its quadratic regression equation (y=5.9266x2 -509664x+1E+10, R2 =0.9841) shows that soil moisture gradually decreased after beginning the test. Soil moisture continued to decrease, and reached 3~4% after 26 hours.
Analysis of the stability of plant growth: FVC
The FVC of the vegetation units of Epipremnum aureum and Fatsia japonica before and after the test was analyzed using DHP images. First, the FVC of the units of Epipremnum aureum before and after the test was as shown in Fig. 6. The FVC of the units of Epipremnum aureum after the test was reduced by 10.6% on average, and the standard deviation was 3.7, up by 0.5. The FVC of the units of Fatsia japonica before and after the test was as shown in Fig. 6. The FVC of the units of Fatsia japonica after the test was reduced by 19.7% on average, and the standard deviation was 9.8 up by 6.2. Under the test environment created in this study, Epipremnum aureum showed relatively a little change in FVC compared to Fatsia japonica. In addition, the growth of Epipremnum aureum was relatively stable even at a high filtering wind speed in air vents. In the units planted with Fatsia japonica, however, creeping was observed in some parts even before the test ended, which resulted in a relatively higher decrease in the average FVC. Here, the high increase in standard deviation can be attributable to the less homogeneous growth environment after the test than that before the test.

FVC Evaluation of Access Floor Type Plant Unit (unit: %).
Analysis of the stability of plant growth: Chlorophyll
The chlorophyll content of Epipremnum aureum and Fatsia japonica applied to the vegetation units before and after the test was measured using SPAD-502. The measured results of Epipremnum aureum before and after the test are shown in Fig. 7 and Table 3. The chlorophyll content of Epipremnum aureum before the test was 42.9 SPAD on average, and the standard deviation was 2.1~2.8. That of Epipremnum aureum after the test was 43.3 SPAD on average, and the standard deviation was 3.2~4.3.
Chlorophyll Monitoring of Access Floor Type Plant Unit: Epipremnum aureum (unit: SPAD).

Chlorophyll Monitoring of Access Floor Type Plant Unit: Epipremnum aureum (unit: SPAD).
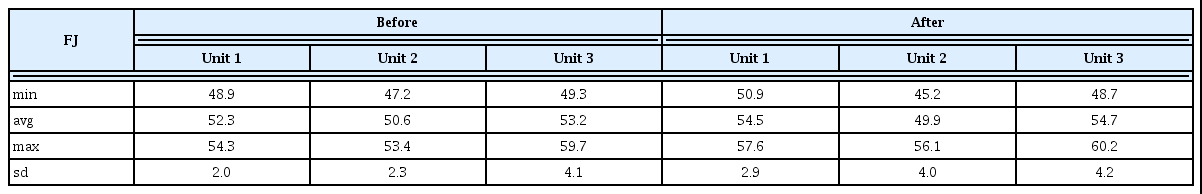
The chlorophyll content of Fatsia japonica before and after the test are shown in Fig. 8 and Table 4. The chlorophyll content of Fatsia japonica before the test was 52.0 SPAD on average, and the standard deviation was 2.0~4.1. That of Fatsia japonica after the test was 53.0 SPAD on average, and the standard deviation was 2.9~4.2. Here, it was difficult to identify significant changes in the total chlorophyll content of both the Epipremnum aureum and Fatsia japonica units within the filtering wind speed range of the AHU (0.16~2.36 m・sec-1 ).
Chlorophyll Monitoring of Access Floor Type Plant Unit: Fatsia japonica (unit: SPAD).
Chlorophyll Monitoring of Access Floor Type Plant Unit: Fatsia japonica (unit: SPAD).
Conclusions
This study was conducted to analyze change in the stability of plant growth in a vegetation unit-type bio-filter connected to an AHU by monitoring air-conditioning performance and plant growth, and the results of this study are as follows. First, a test environment that meets relevant test standards in Korea was created. The total air volume of the AHU was maintained at 600 CMH. The average filtering wind speed of each air vent was 2.36 m・sec-1 , and average filtering wind speed was 0.16 m・sec-1 . The difference between the zonal patterns of soil moisture in the lower part of air vents and the shaded area was approximately 1.5 times, and the total soil moisture in the shaded area was higher by 3~4% than that in the lower part of air vents. The amount of changes in the FVC of Fatsia japonica before and after the test was approximately two times higher than that of changes in the FVC of Epipremnum aureum, and some creeping plants were observed. Therefore, in order to maintain the ornamental value of Fatsia japonica, it will be necessary to water Fatsia japonica in shorter intervals than Epipremnum aureum. Lastly, it was difficult to identify significant changes in the total chlorophyll concent of both Epipremnum aureum and Fatsia japonica before and after the test, and it seemed that the duration of the test was not long enough to observe changes in the stability of plant growth.
These results are expected to provide basic data on the stability of plant growth for vegetation bio-filters, connected to AHUs in general buildings, of which filtering wind speed can be 20 times higher than that of existing vegetation bio-filters (lower than 0.1 m・sec-1 ). They are expected to be utilized as objective indicators of ecological performance in improving the air-conditioning efficiency of plants and soil-based bio-filters, and to contribute to enhancing the understanding of technologies related to air-conditioning in buildings. Still, there were some limitations in this study. The number of vegetation models and soil moisture sensors applied to this study was limited, and a sufficient length of time for disturbing the environment of plant growth was not secured in this study, which needs to be reflected in follow-up studies.


