J. Korean Soc. People Plants Environ Search

CLOSE


J. People Plants Environ > Volume 19(6); 2016 > Article
Kim, Huh, and Huh: Characteristics Analysis of Visitors Satisfaction and Revisit Intention on Horticulture Exhibition at a University Campus

ABSTRACT

As the interest in and demand for urban agriculture have recently increased, more and more people want to be engaged in urban agriculture. In this respect, horticultural exhibitions held on university campuses can be utilized as a space to share knowledge on and experience urban agriculture. Against this backdrop, this study was conducted to evaluate the satisfaction of visitors with horticultural exhibitions, and to develop strategies to plan a horticultural exhibition based on the results of the evaluation. A survey was conducted in an horticultural exhibition held on the campus of G University in J city in South Gyeongsang Province for three days (May 2-4, 2016). In this survey, a self-administered questionnaire was used, and statistical analysis was performed on a total of 275 collected questionnaires. The satisfaction of visitors with the exhibition was analyzed by content sections and items of information and services. As a result, the level of satisfaction with the section of flower plants (83.7%) and the level of satisfaction with the docent service (78.2%) were the highest respectively. A correlation analysis was conducted between the satisfaction of visitors and their intention to revisit, which can affect the action of the visitors. The correlation of all of the content, information and services of the exhibition with the overall satisfaction and the intention to revisit were positive (+). In particular, among the items of information and services, the satisfaction with activity experience showed the highest correlation with the overall satisfaction (0.659, p<.001) and the intention to revisit (0.519, p<.001). This indicates that activity experience is a very important factor in promoting the overall satisfaction of visitors and their intention to revisit. Therefore, if the demand for the experience and instructive benefits is met by horticultural exhibitions, they can be utilized not just as an event held on a university campus, but also as a means to promote urban agriculture by providing basic information and knowledge about it for local residents. By doing so, it will be also possible to encourage the participation of local residents as well as university students.

Introduction

Urban agriculture is an area of agriculture that started with the development of populous cities as part of urban life. It has already been supported and promoted in foreign countries on a governmental level as a platform to provide urban dwellers with vegetables that may be lacking in their diet and to enjoy their spare time since the onset of industrialization. In South Korea, urban agriculture has recently been actively researched and developed as a new trend of agriculture in which many people are becoming interested and has been recognized as an area of agriculture that is being focused on (Geum, 2010; Heo and Kim, 2013). In addition, Han and Chang (2014) reported that urban agriculture is expected to contribute to securing a lot of green spaces by creating new spaces for urban agriculture as a new lifestyle trend. As the citizens can participate in agriculture in the form of urban agriculture in a convenient manner, there are growing needs for providing information on users' preference of crop or crops and cultivation education (Hwang et al., 2013). Horticulture exhibitions may be used as a very active means to meet the needs of the users for providing information and cultivation education.
Recently, as society rapidly changes into a knowledge-based society, many prefer exhibitions as a way to effectively exchange knowledge and information. Therefore the number of exhibitions is increasing and exhibition visitors have diverse expectations (Han and Noh, 2012). Such exhibitions refer to the events that are held at certain locations for certain periods of time for the purpose of stimulating the interest and curiosity of visitors and providing information under special themes (Yeo and Oh, 2004). The increase in income level and subsequent rise in leisure time has led to the increase in people’s interest in culture, commercializing culture all around the world. Under these circumstances, the exhibition industry is rapidly developing to use the commercialized culture as resources, and satisfaction with the services of the exhibition industry has been researched in many aspects (Jeong and Kim, 2010; Jung 2011).
University campuses, where such exhibitions are held, have been recently developed as part of the living space of many local residents thanks to the active opening of campuses by universities and their proximity to local communities. A university campus was originally designed for academic research and value creation. However, recently university campuses are being utilized as places of relaxation and cultural life for local residents beyond students, who are the actual owners of the sites, rather than being limited to education and research activities (Kim and Moon, 2008). Such public values that a university campus has for local residents are hugely influential on local development. Therefore, the exhibitions held on a university campus can be considered important events to get local residents interested and involved and they can provide relevant information to local residents.
Therefore, this study aimed to analyze the characteristics of satisfaction of visitors to horticulture exhibitions held on a university campus for those items related to the exhibitions by conducting surveys on the exhibitions, and discover what needs to be improved in the future for the continued development of horticulture exhibitions as university campus events as a forum for education on urban agriculture and providing information.

Research methods

1. The horticulture exhibition on a university campus

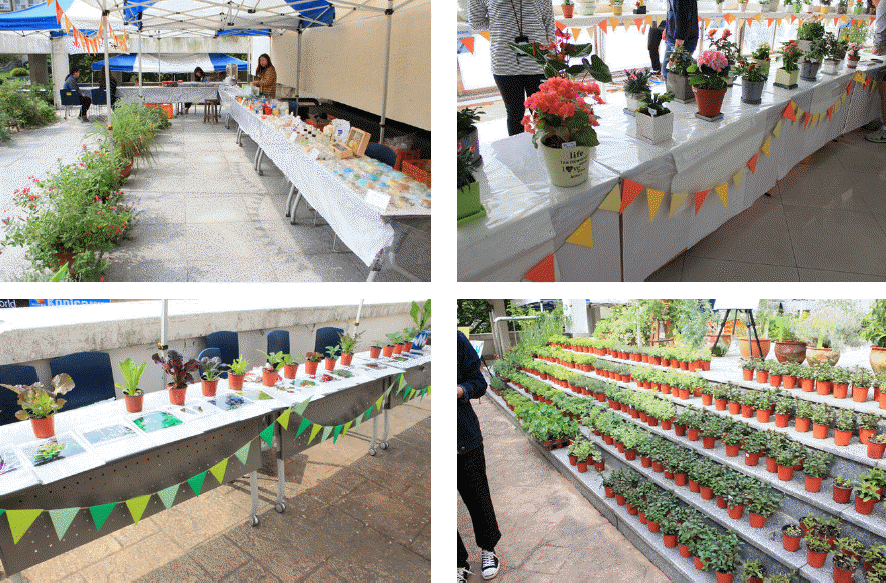
The horticulture exhibition of G University in J city in South Gyeongsang Province is an annual campus exhibition that provides information on plants to many people by displaying various garden plants. This horticulture exhibition was divided into 6 sections including flowering plants, succulent plants, foliage plants, vegetables and herbs depending on plant classification and handicrafts of the gardening club using various horticultural products including herb tea, soaps and candles (Fig. 1).
Fig. 1
The display of horticulture exhibition.
KSPPE-19-623_F1.gif

2. Questionnaire design and survey

1) Questionnaire design

The study conducted a survey that includes questions on satisfaction about the exhibition by section and about the diversity of the exhibits. Shin and Chun (2013) and Min and Ha (2010) identified the relationship between visitor satisfaction about the exhibition by content and their revisit intention and mentioned that it is necessary to research the exhibition content to provide entertainment features for the visitors when planning the exhibition.
In terms of the survey items related to information and services, the study conducted a survey on visitor satisfaction regarding the information and experience activities provided by the exhibition, services such as explanations or the kindness of the docents and the exhibition information leaflet. In particular, as a lot of previous studies found that providing information and services has a huge influence on visitor satisfaction regarding exhibitions, the study adopted this element as one of the survey items.
Table 1
Survey items by previous research.
Factors Number of items Citation
Contents of exhibition 7 Shin and Chun (2013), Min and Ha (2010)
Information & services 5 Kwon and Park (2012), Han and Noh (2012), Park et al. (2012), Min and Ha (2010), Lee (2009), Kim (2008)
Visitors’ overall satisfaction 4 Kwon and Park (2012), Park et al. (2012), Min and Ha (2010), Hong (2009), Kim (2008), Lee and Jee (2008), Jang (2007)

2) Survey and statistical analysis

This study was conducted on the visitors of the horticulture exhibition held in G University campus in J city in South Gyeongsang Province for three days from May 2-4, 2015. It distributed a total of 290 questionnaires and collected 275 answer sheets. The study encouraged the visitors to participate in the survey within the horticulture exhibition venue and voluntarily go to the survey location. The survey staff requested the visitors who came to participate in the survey to write down their socio-demographic characteristics after introducing the survey items. They encouraged the visitors to answer to the applicable items while viewing the exhibits after announcing the purpose of the survey. The study collected data by requiring the subjects to visit the survey location once again at the end of the viewing and a final interview was conducted with the subjects on the survey items.
The subjects were required to answer the survey items on a Likert Scale of 5 points. The measurement point was set at 5 for the answer of ‘very satisfied’ and 1 for the answer of ‘very dissatisfied’. The data collected from the questionnaire was analyzed using statistical software, IBM SPSS Statistics 23, with frequency analysis and correlation analysis.

Results and consideration

1. Analysis of the socio-demographic characteristics

The statistics of the collected personal characteristics of 275 subjects are shown in Table 2. According to the analysis on frequency by gender, the number of women, which was 167 (60.7%), was higher than the number of men, which was 108 (39.3%), by 59. This was similar to the results of previous studies (Ahn, 2014; Ahn and Yoo, 2016; Jeong et al., 2008) on festivals or exhibitions related to horticulture or agriculture, which are regarded as similar to the target exhibition in this study, and the results of the research (Choi and Jeon, 2012) on satisfaction of the visitors. The study analyzed the age group of the visitors into those between 20-29 and those at 30 or over, and found out that most of the visitors were in their 20s as the number of those in their 20s was 255 (92.7%) and those at 30 or over was 19 (6.9%). It also analyzed the occupation of the visitors into students and non-student local residents. The number of students was 241(87.6%) while the number of non-student local residents was 34 (12.4%). The results of the age group and occupation of the visitors are thought to be related to the characteristics of the exhibition holding place, and it is considered necessary to attract more local residents by conducting the marketing activities outside the school as well as inside the school to attract more diverse kinds of visitors. In terms of the number of those visiting, the study divided the visitors into the new visitors and return visitors, and found that the number of the return visitors was slightly higher at 143 (52.0%) than that of the new visitors at 132 (48.0%) but there was not a significant difference.
Table 2
The respondent’s demographic and social characteristics.
Variance Frequency %

Gender Male 108 39.3
Female 167 60.7

Age 20~29 256 93.1
Over 30 19 6.9

Job Student 241 87.6
Resident 34 12.4

Visiting experience First 132 48.0
Re-visit 143 52.0

2. Comparison and analysis of visitor satisfaction for the exhibition content by section

According to the frequency analysis on visitor satisfaction for the exhibition sections, no one answered ‘very dissatisfied’ to all survey items or ‘dissatisfied’ to the items on the diversity of the exhibit plants (Table 3). In addition, it was reported that the visitors were satisfied about most of the exhibition sections to the extent higher than ‘satisfied’. After comparing the answers, it was identified that the item that received the most answers to the extent higher than ‘satisfied’ for the exhibition sections was the flowering plants section as 235 people (85.5%) answered higher than satisfied for this section. Following the flowering plants section, 230 people (83.7%) were satisfied with the herbs section, followed by the succulent plants section with 218 people (79.3%), the club handicrafts section with 215 people (78.1%), the vegetables section with 207 people (75.2%) and the foliage plants section with 206 people (74.9%). In addition, according to the analysis on the diversity of the exhibits of this horticulture exhibition, 229 people (83.3%) were satisfied regarding the exhibits to the extent higher than ‘satisfied’.
Table 3
The visitors’ satisfaction regarding exhibition items in the selected horticulture exhibition.
Item Scalez

1 2 3 4 5


Frequency Percentage (%) Frequency Percentage (%) Frequency Percentage (%) Frequency Percentage (%) Frequency Percentage (%)

Flower 0 0 2 0.7 38 13.8 155 56.4 80 29.1
Succulent 0 0 5 1.8 52 18.9 133 48.4 85 30.9
Foliage 0 0 6 2.2 63 22.9 130 47.3 76 27.6
Vegetable 0 0 4 1.5 64 23.3 128 46.5 79 28.7
Herb 0 0 3 1.1 42 15.3 133 48.4 97 35.3
Group activity 0 0 2 0.7 58 21.1 106 38.5 109 39.6
Diversity 0 0 0 0 46 16.7 121 44.0 108 39.3

z 1,Very dissatisfied; 2,Dissatisfied; 3,Neither dissatisfied nor satisfied; 4,Satisfied; 5,Very satisfied.

3. Comparison and analysis of visitor satisfaction for information and services of the exhibition

The results of the frequency analysis on the survey items on information and services regarding visitor satisfaction for the exhibition are shown in Table 4. No one answered ‘very dissatisfied’ to the items on visitor circulation, information leaflet and experience activity, except for the items of the docent services and information provision by the exhibition. In addition, it was identified that the visitors were satisfied more than ‘neither dissatisfied nor satisfied’ for most of the items regarding information and services of the exhibition. In this regard, according to the analysis of the items with the answers of satisfaction to the extent higher than ‘satisfied’, the area with many items that included answers of higher than ‘satisfied’ was the services by the docents as 215 people (78.2%) answered so. It was followed by the item of experience with 207 people (75.3%), just slightly lower, the item of visitor circulation with 206 people (74.9%), the item of provision of information on the exhibits with 198 people (72.0%) and the item of information leaflet with 184 people (66.9%). The visitors were highly satisfied about the information and services of the exhibition. This was similar to the result of the research by Kwon and Park (2012) that reported that providing experiences on various products and services and professional knowledge by assigning docents can improve overall visitor satisfaction with exhibitions.
Table 4
The visitors’ satisfaction regarding information & docent services in the selected horticulture exhibition.
Item Scalez

1 2 3 4 5


Frequency Percentage (%) Frequency Percentage (%) Frequency Percentage (%) Frequency Percentage (%) Frequency Percentage (%)

Docent Service 2 0.7 5 1.8 53 19.3 118 42.9 97 35.3
Visitor Circulation 0 0 6 2.2 63 22.9 123 44.7 83 30.2
Leaflet 0 0 15 5.5 76 27.6 111 40.4 73 26.5
Information 1 0.4 10 3.6 66 24.0 116 42.2 82 29.8
Experience Activity 0 0 5 1.8 63 22.9 115 41.8 92 33.5

z 1,Very dissatisfied; 2,Dissatisfied; 3,Neither dissatisfied nor satisfied; 4,Satisfied; 5,Very satisfied.

4. Frequency analysis on visitor satisfaction for the horticulture exhibition

The results of the survey on overall visitor satisfaction for the horticulture exhibition and visitor awareness about horticulture are shown in Table 5. No one answered ‘very dissatisfied’ or ‘dissatisfied’ to the item of overall satisfaction, while 46 people (16.7%) answered ‘neither dissatisfied nor satisfied’, 121 people (44.0%) answered ‘satisfied’ and 108 people (39.3%) answered ‘very satisfied’, indicating that the horticulture exhibition produced a high level of satisfaction among the visitors. In addition, visitor satisfaction for changes in their awareness of horticulture after viewing the exhibition was surveyed. The results showed that no one answered ‘very dissatisfied’ while a small number of 7 people (2.5%) answered ‘dissatisfied’, 62 people (22.5%) answered ‘neither dissatisfied nor satisfied’, 124 people (45.1%) answered ‘satisfied’ and 82 people (29.8%) answered ‘very satisfied’. This indicated that visitor satisfaction for this item was lower than for overall satisfaction but that a positive impact had been created regarding providing information on horticulture to the visitors and that their awareness about horticulture had been enhanced.
Table 5
The visitors’ total satisfaction & recognition in the selected horticulture exhibition
Item Scalez

1 2 3 4 5


Frequency Percentage (%) Frequency Percentage (%) Frequency Percentage (%) Frequency Percentage (%) Frequency Percentage (%)

Total satisfaction 0 0 0 0 46 16.7 121 44.0 108 39.3
Recognition 0 0 7 2.5 62 22.5 124 45.1 82 29.8

z 1,Very dissatisfied; 2,Dissatisfied; 3,Neither dissatisfied nor satisfied; 4,Satisfied; 5,Very satisfied.

5. Revisit intention and recommendation intention regarding the horticulture exhibition

The study conducted a survey on the revisit intention to the exhibition, which is determined by the behavioral factors of the visitors in accordance with their satisfaction with the exhibition, and the intention to recommend the exhibition to friends (Table 6). The results showed that the visitors had a very positive revisit intention towards the exhibition. To the question of ‘do you want to revisit the horticulture exhibition?’ it was found that 90% of the visitors were positive regarding their intention to revisit the horticulture exhibition as 114 people (41.5%) answered ‘yes’ and 132 people (48.5%) answered ‘very much.’ In addition, in terms of the intention to recommend the exhibition to friends, which is regarded as an indicative behavior of the visitors after viewing the exhibition as well as indicative of their intention to revisit the exhibition, 233 people (84.7%) answered ‘yes’ and ‘very much’, indicating the respondents were positive about making a recommendation.
Table 6
The visitors’ revisit intention & recommendation in the selected horticulture exhibition.
Item Scalez

1 2 3 4 5


Frequency Percentage (%) Frequency Percentage (%) Frequency Percentage (%) Frequency Percentage (%) Frequency Percentage (%)

Revisit intention 0 0 5 1.8 24 8.7 114 41.5 132 48.0
Recommendation 0 0 1 0.4 41 14.9 110 40.0 123 44.7

z 1,Very negative; 2,Negative; 3,Neither negative nor positive; 4,Positive; 5,Very positive.

6. Correlation analysis between the items on exhibition content and the items on satisfaction and revisit intention

The study conducted a correlation analysis between visitor satisfaction for each exhibition section, which is an item related to the exhibition, and overall satisfaction for the exhibition with the diversity of the exhibits and a correlation analysis between visitor satisfaction for each exhibition section and revisit intention to the exhibition (Table 7). The analysis found that overall satisfaction for the exhibition and the exhibitionrelated items had positive (+) correlations. The sections with the highest correlation coefficient were the succulent plants section (0.589) and the foliage plants section (0.588). The item with the lowest correlation coefficient was the diversity of the exhibits (0.453). The survey showed that the revisit intention to the exhibition and the exhibition-related items had positive (+) correlations. The item with the highest correlation coefficient with revisit intention was the diversity of the exhibits (0.511), unlike overall satisfaction, and the item with the lowest correlation coefficient was the vegetables section (0.364). According to the research by Choi and Jeon (2012), the correlation coefficient between the experience elements and satisfaction was high at 0.383~0.685. This indicated that the exhibitionrelated items and satisfaction in this research had a high correlation. In addition, it was indicated that the exhibition related items had positive impacts on overall satisfaction of the visitors for the exhibition and their revisit intention. This was similar to the results of Min and Ha (2010) that reported that the exhibition content has statistically significant impacts on the revisit intention of the visitors.
Table 7
Correlation of satisfaction, revisit and recommendation.
x1 x2 x3 x4 x5 x6 x7 x8 x9

x1 1.000
x2 .561** 1.000
x3 .542** .387** 1.000
x4 .589** .377** .605** 1.000
x5 .588** .400** .605** .647** 1.000
x6 .499** .364** .535** .614** .597** 1.000
x7 .503** .378** .551** .504** .557** .551** 1.000
x8 .565** .464** .511** .535** .532** .564** .620** 1.000
x9 .453** .511** .481** .507** .521** .485** .489** .525** 1.000

** Significant at P=0.01, respectively, by paired t-test.

x1, total satisfaction; x2, revisit; x3, satisfaction regarding flowers; x4, satisfaction regarding succulent plants; x5, satisfaction regarding foliage; x6, satisfaction regarding vegetables; x7, satisfaction regarding herbs; x8, satisfaction regarding group activity; x9, diversity.

7. Correlation analysis between the items related to exhibition information and services and the items of satisfaction and revisit intention

According to many previous studies, the internal factors of the exhibition that influence the visitors include the in-house information and docent services and experiences of the exhibition. They have impacts on visitor satisfaction for the exhibition and their revisit intention, which is a future behavioral intention (Han and Noh, 2012; Kim, 2008; Lee, 2009; Min and Ha, 2010; Park et al., 2012). Therefore, this study conducted a correlation analysis between the items related to the exhibition information and services and overall visitor satisfaction and their revisit intention (Table 8). The results showed that the items related to the exhibition information and services had positive (+) correlations with visitor satisfaction for the exhibition and revisit intention of the visitors. This is similar to the results of previous studies on visitor satisfaction for exhibitions and revisit intention. In particular, in terms of the experience of the exhibition activities, satisfaction for the exhibition (0.659) and revisit intention (0.519) both had the highest correlation coefficients. This was similar to the results of the research by Cheng (2013) that studied the influence of the experience element among the internal factors of the exhibition on the image, satisfaction and recommendation intention of the exhibition, the research by Min and Ha (2010) that identified the correlations by content type, and the research by Lee (2009) that researched the impacts of the experience programs of local festivals on visitor satisfaction and revisit intention.
Table 8
Correlation of satisfaction, revisit and recommendation.
x1 x2 x3 x4 x5 x6 x7

x1 1.000
x2 .561** 1.000
x3 .656** .501** 1.000
x4 .624** .460** .548** 1.000
x5 .534** .410** .453** .525** 1.000
x6 .612** .507** .564** .619** .688** 1.000
x7 .659** .519** .486** .573** .537** .668** 1.000

** Significant at P=0.01, respectively, by paired t-test.

x1,Satisfaction; x2, revisit; x3, docent service; x4, visitor circulation; x5, leaflet; x6, information; x7, experience activity.

Summary

This study was conducted to evaluate the satisfaction of the visitors regarding a horticulture exhibition held in a university campus. The exhibition was attended by more female visitors than male visitors. They were mostly students in their 20s. In addition, the percentage of the new visitors and return visitors was almost the same in terms of visiting experience of the exhibition. To figure out visitor satisfaction for the horticulture exhibition, the study divided the visitor satisfaction results into the items related to the exhibition content and the items related to providing information and services. The results showed that the visitors were most satisfied with the flowering plant section in terms of the exhibition content. Also, in the items related to providing information and services, the visitors were most satisfied with the docent services. The study also conducted a correlation analysis between satisfaction of the visitors and their revisit intention that may influence their future behaviors. The study found that the items related to the exhibition content and the items on providing information and services both had positive correlations with overall satisfaction for all exhibition events and revisit intention of the visitors. In particular, the item of satisfaction for experiences of the exhibition activities among the items on providing information and services had the highest correlation with overall satisfaction and revisit intention. This indicated that such an experience is a very important element to improve overall satisfaction and revisit intention of the visitors. However, as this study simply analyzed visitor satisfaction only, it is necessary to conduct more specific analyses by exhibition section to improve visitor satisfaction and attract more diverse visitors. If the exhibition is improved in this way, the exhibition can be used as a means to promote urban agriculture as well as providing basic information and knowledge about urban agriculture to the citizens rather than just being a simple event in a university campus.

References

Ahn HK. Event analysis and development strategy in Korea Agriculture Expo. PhD Diss. 2014. Mokpo National Univ; Mokpo, Korea.

Ahn HG, Yoo YK. The appraisal and analysis of visitors' program satisfaction in Korea Agriculture Exposition. J. Kor. Soc. People Plants and Environ 2016;19(2): 149–156.
crossref
Cheng Yan. An analysis of effect relationship among experience factors, exhibition image, satisfactory and recommendation intention. J. Tour. Manage. Res 2013;17(3): 427–446.

Choi SH, Jeon IO. Impact of physical environment of exhibition on the experiences and visitors' satisfaction. J. Kor. Contents Associ 2012;12(11): 313–337.
crossref
Geum SG. Topic urban agriculture of green growth. BDI Policy Focus 2010;74:1–12.

Han EJ, Noh JH. Determinants of demand for exhibition visitors - focusing on visitors of the “Seoul International Wine & Spirits EXPO”-. Tourism Study 2012;27(1): 397–413.

Han JH, Chang DM. A study on the sustainable development direction through theory, paradigm and typology of urban agriculture. J. Urban Des. Inst. Kor 2014;15(6): 33–46.

Heo JN, Kim TG. Valuation and preference of urban agriculture park using choice experiment. Kor. J. Organic Agri 2013;21(2): 125–137.
crossref
Hong JH. A comparative study of first-time visitors and repeated visitors to local festival: focused on Gwangalli Eobong Festival. Event & Convention Research 2009;5(2): 23–35.

Hwang JI, Jang YJ, Jang BG. Segmentation and preference analysis of urban farming patterns. Kor. J. Community Living Sci 2013;24(4): 553–565.
crossref
Jang YL. A comparative study of local festival motivation, satisfaction estimate, behavioral intention and local culture perception: the case of first time visitor and repeated visitor. J. Tourism Manage. Res 2007;11(1): 167–191.

Jeong BD, Kim MH. The effect of satisfaction with service quality in regional festivals on revisit and word-of mouth intention. Rev. Business & Economy 2010;23(1): 505–522.

Jeong GH, Roh YH, Lee SH. Cultural festival with maple: the case of Jangsung Bakyang Maple Festival. J. Korean Soc. People Plants Environ 2008;11(1): 35–44.

Jung YH. Effects of the perceived value of convention & exhibition visitors on their satisfaction, revisit and recommendation intention. J. Kor. Contents Associ 2011;11(11): 145–155.

Kim NS. Impacts of exhibition service quality on participants' satisfaction and intention to visit again. Korea Trade Review 2008;33(3): 123–157.

Kim SB, Moon HS. A way to make a eco-campus in a point of view of landscape architecture - the case of Keimyung Univ. (Seongseo Campus) in Daegu, Korea. Keimyung Korean Studies Journal 2008;36:139–169.

Kwon EW, Park WJ. The Effect of experiential marketing operation on exhibition satisfaction and behavioral intention. Event & Convention Res 2012;8(2): 23–40.

Lee JM, Jee JH. Impact of image of regional festival on satisfaction of tourists and their intention for revisit-with focus on Firefly Festival of Youngyang. J. Kor. Contents Associ 2008;8(12): 424–432.
crossref
Lee JM. Impact of sense of satisfaction with regional festival experience program upon intention for re-visit - with focus on Andong International Mask Dance Festival. J. Kor. Contents Associ 2009;9(9): 370–379.

Lee KH. Correlation analysis between viewing satisfaction and visitor’s behavior in art museum, PhD Diss. 2009. Hongik Univ; Seoul, Korea.

Min JH, Ha KS. Ecosystem configuration and its structure of cultural contents - focused on Busan International Motor Show. J. Kor. Contents Associ 2010;10(10): 197–208.
crossref
Park HJ, Park JH, Lee JS, Kim YH, Yoon JH. A Study on the tourist’s perceived quality, experience value, satisfaction and revisit: focused on exhibition. J. Tour. Leisure Res 2012;24(5): 7–25.

Shin H S, Jeon Y C. The effect that visitor’s emotional response for exhibition contents of local festivals has on satisfaction and continuous relationship in the festival. J. Tour. Manage. Res 2013;17(2): 147–163.

Yeo SH, Oh IK. Impact of tour expo visitors' participation motivations, perceived constraints and perceived facilitators on intention to revisit. J. Tour. Leisure Res 2004;16(2): 235–251.


ABOUT
BROWSE ARTICLES
EDITORIAL POLICY
AUTHOR INFORMATION
Editorial Office
100, Nongsaengmyeong-ro, Iseo-myeon, Wanju_Gun, Jeollabuk-do 55365, Republic of Korea
Tel: +82-63-238-6951    E-mail: jppe@ppe.or.kr                

Copyright © 2024 by The Society of People, Plants, and Environment.

Developed in M2PI

Close layer
prev next