


Introduction
Urbanization led to fundamental changes in structures, patterns, and functions which existing natural ecosystem maintains under indigenous environment for a long time (Hodson and Marvin, 2010). To enhance economic efficiency and prevent natural disasters including flood, natural objects such as forest, soil, lake, and stream almost disappeared and artifacts such as street, sidewalk, building, and straightened stream replaced them. These land use and land coverage made cities face serious environmental problems including air pollution, severe heat island, urban drought, and urban flood, therefore, the needs for solving the environmental problems are getting more important as the resilience depending on climate risk is getting a serious issue. It is learned that development way for growth has highly hindered maintaining sustainability of the cities as these urban environmental problems go with damage of human life and property.
It is important to restore urban ecosystem filled with artifacts as natural setting. However, there should be prerequisite that the nature can solve the urban environmental problems practically. Because that could enhance practicability. Cities in England, Finland, the U.S. (Los Angeles), and Canada (Vancouver) conduct specific plans for using urban green, nature of the city (TyrväTyrväinen, 2001;McPherson et al., 2008; City of Vancouver, 2011). These cities monitored how green areas were distributed in the cities based on the concept of UTC (Urban Tree Canopy) and found out which ecosystem service improving effects were (Killicoat et al., 2002; Sander et al., 2010). Also, they try to get positive impacts that urban green areas could enhance weakened urban environment, reduce respiratory diseases, stress, and improve productivity of workers and students by using effective UTC (Simpson and McPherson, 1996;Tallis et al., 2011; Loughner et al., 2012; Park, 2013).
Recently UTC of the city is quantified and the quality assessment of space planning and urban ecosystem service is conducted by using remote sensing (Walton et al., 2008). Even though the UTC classification using the remote sensing is a method which can relatively measure easily and has economic strength compared to field study, most classification using the remote sensing uses coarse or medium-resolution images (Irani and Galvin, 2003) or traditional classification method based pixel such as ISODATA or maximum-likelihood (Anderson and Cobb, 2004; Ferrato and Forsythe, 2013), therefore, it has limitation in exactly classifying UTC which still has continuous shape of boundary characteristic. This means that classifying UTC boundaries exactly is difficult as UTC is composed in the group of urban landscape which is heterogeneous patch and these groups have different spectral characteristic (Gong and Howarth, 1990).
Therefore, the objective of this study is to exactly classify the UTC which has the characteristic of continuous boundaries by applying OOC (object-oriented classification) to high resolution aerial images. As the UTC classification using this remote sensing can provide quantitatively spatial distribution, it can provide access to ecosystem service and the value of using it to the public, and help decision making for various interested parties.
Methods of the study
1. Study site
The study site for this study is targeted at about 2.5 km long two-lane road (100,000 m2) in Bangbae-ro, Seocho-gu, Seoul (Gyeongnam Apartment three-way intersection~the front of Seorae elementary school) like Fig. 1. Platanus occidentalis L and Ginkgo biloba are mainly planted on the both sidewalks based on the two-lane road. To use exact classification and methodology of UTC, Fig. 1 was selected as it can consider external factors such as shadows of building and various sizes of tree.

2. Data collection and accuracy assessment
The aerial photos used in this study is the data whose spatial resolution is 50 cm taken in May, 2009 as the image data provided by National Geographic Information Institute. The aerial photos whose resolution is 1m or less scale are needed in UTC analysis using aerial photos in general (Walton et al., 2008). In particular, it has been known that high resolution aerial photos are appropriate in distinguish various kinds of vegetation and small patches (Walton et al., 2008). This study also had 50 cm spatial resolution in order to enhance the classification accuracy of the obtained images and used aerial imagery data which has 8-bit radiometric resolution including Red, Green, and Blue band. The thematic map using remote sensing includes errors, therefore, accuracy assessment should be conducted in order for reliability (Stehman and Czaplewaski, 1998). The classification accuracy shows how the classified images match real ground cover in general.
The number of the reference data for the accuracy assessment was 260 through the data obtained on the spot by using high resolution images and at least 50 data was selected by item (Congalton and Green, 1999). Error Matrix was used for the accuracy assessment of the classification, and this method shows accurate classification result on specific item, so it shows quantitatively overall accuracy, user’s accuracy and producer’s accuracy by using Kappa coefficient (Congalton, 1991; Congalton et al., 2002;Jensen, 2005). The overall accuracy means that it divides all number of correct pixel by the total number of pixels in the error matrix. The user’s accuracy means the probability that a pixel classified on the map can match the item on the ground in reality, which is also called commission error (Story and Congalton, 1996). The producer’s accuracy is calculated by dividing the diagonal number from a class’s column by the sum of the entire column including the number found within the diagonal (Jensen, 2005). Kappa analysis is a discrete multivariate method which is used in the accuracy assessment (Congalton and Mead, 1983). This statistic represent that how well a classification map and the reference data agree with each other. Strong agreement is greater then 0.80. Moderate agreement fall between 0.40 and 0.80 and poor agreement occurs less then 0.40 (Jensen 2005). eCognition 8.7, 2011 (Trimble Geospatial Inc, France) supporting the algorithm of object oriented classification (OOC) was used as the software for data processing.
3. Classification of urban tree canopy
In this study, the OOC and the decision tree (DT) are applied in order to exactly classify UTC which has the characteristic of continuous boundaries. It is difficult to consider classifying UTC objects each by using high resolution image only with pixel size of the image and distribution of probability value of one pixel as traditional classification algorithm (Myeong et al., 2001; Zhang, 2001). Recently these problems are overcome by using OOC and decision tree (Zhou and Troy, 2008). The OOC groups adjacent objects which have homogeneous property not by pixel unit but by object unit on the basis of scale, shape/color, and compactness/smootheness (Baatz and Schäpe, 2000).
In the OOC, the process of the segmentation which groups the objects that has homogeneous property is the most important stage affecting classification accuracy and it decides the size of difference of each object. The shape/color and the compactness/ smootheness can weight value by using the value between 0 and 1, if the weighted value is high, the effect of the color will decrease in the segmentation, and if the weight value of compactness is high, the characteristic of the smootheness will be reflected in low, therefore, the boundary of the segmentation shows more complicated shape.
The decision tree is effective in improving classification accuracy by using various spatial variables and extracting small patches compared to traditional classification method (Bwangoy et al., 2010). In particular, it is known that the decision tree is effective way to enhance classification accuracy by using various variables (Laliberte et al., 2006). As Red, Green, and Blue band were only used in setting the standard for classifying the decision tree, this study set like Fig. 2 in order to extract the characteristic of the vegetation through band operation. Generally spectral characteristic of the vegetation has higher value in G band rather than R band, and the vegetation has the characteristic that has positive value (Motohka et al., 2010).

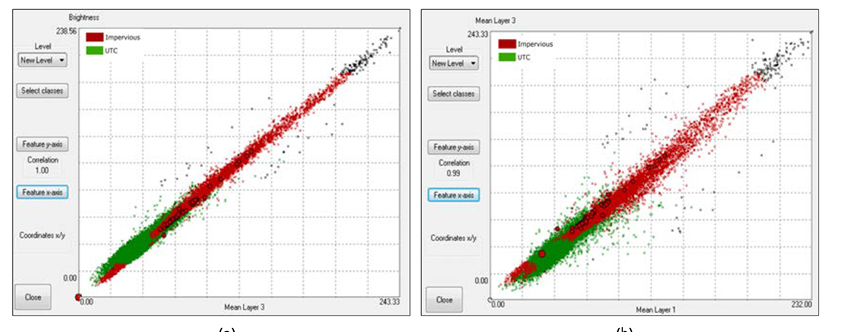
In this study, the classification standard for removing the shadow was set like Fig. 2 as the value of operation of Brightness value, Blue/Red, and Green/Red used distribution characteristic in dispersion like Fig. 3 in order to remove the shadow which could cause misclassification in the classification. As the vegetation has the property of high brightness value in general, it is effective removing the shadow when using Brightness value (Walton et al., 2008).
Fig. 3 shows the distribution of the value of impervious layer including UTC and the shadow in the 2D dispersion of brightness value and B band. In the result, the brightness value of UTC is higher than that of the shadow and lower than that of impervious layer like Fig. 3-a, and UTC has lower value than other elements in band corelation distribution in Fig. 3-b. This study set standard value of the classification like Fig. 2 by using this distribution characteristic of UTC.
Conclusions and considerations
1. Classification of UTC boundary by object-oriented classification (OOC)
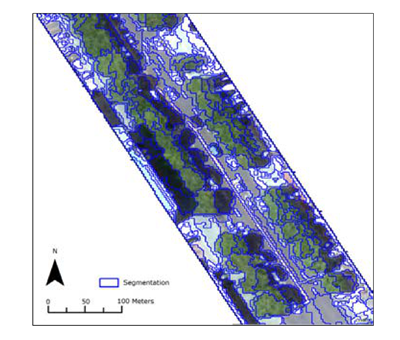
Fig. 4 shows the segmentation result of OOC. In the result, when the value 100 is applied to Scale parameter, it distinguished UTC boundaries well, and when weighted value of Compactness increased, it classified complicated property of UTC boundaries part. In the result of Fig. 4, it is found that UTC, the shadow on the road occurred by UTC, and impervious layer (buildings and roads) have different boundary value each. This shows that OOC is appropriate not only in complicated UTC type but also in reflecting the characteristic that has continuous boundary value.
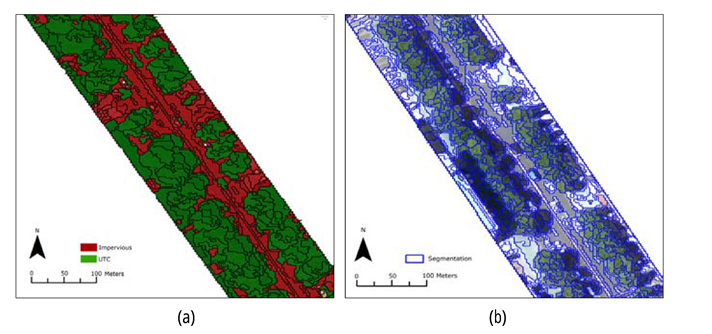
The result of UTC classification based on boundary value of segmentation shows in Fig. 5. When looking into the result, it was seen with the eye that the shadow on the roads and buildings around UTC was misclassified as UTC. It is thought that the result was misclassified as this result was simply based on spectral value of reference data. To reduce this misclassification, this study conducted the second segmentation process by applying the less boundary as scale parameter 50 to the result of the classification as the vegetation in order to separate the boundary value of the shadow. The result of the second segmentation, the boundary with the shadow becomes more distinct as the vegetation is more segmented like Fig. 5-b.
2. Conclusion on the classification using the decision tree
Fig. 6 is the result of classifying final UTC by using the second segmentation and decision tree. In the result, it was found that the trees and the shadows which were misclassified were almost removed in Fig. 6-a, in particular, the shadow in the study site is distributed on the road like Fig. 6-b, therefore, it could cause misclassification in UTC classification like (a) of Fig. 5. In this study, UTC and the shadow were easily divided by using the decision tree that Brightness value was under 40, and it was figured out when the value of buildings and roads were over 80, most of them had the value more than 1 in band corelation analysis (Blue/Red, Green/Red), therefore, they were easily separate with UTC. It was found that this method was effective in removing the shadow on the roads caused by UTC.
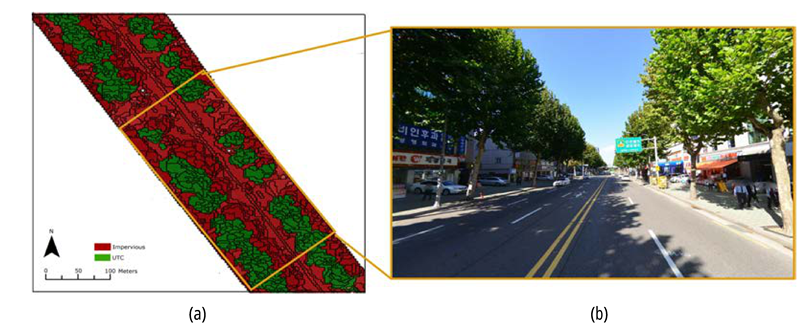
Fig. 7 and Table 2 are the result of UTC classification and accuracy assessment in site using decision tree. In the result Table 1, the overall accuracy was 90%, the producer’s accuracy was 86%~95%, and the user’s accuracy was 85%~97%. Some UTC showed misclassified result between buildings or roads, it is considered that brightness value of the vegetation or the property of the band calculation are not reflected well caused by the shadow of the building.
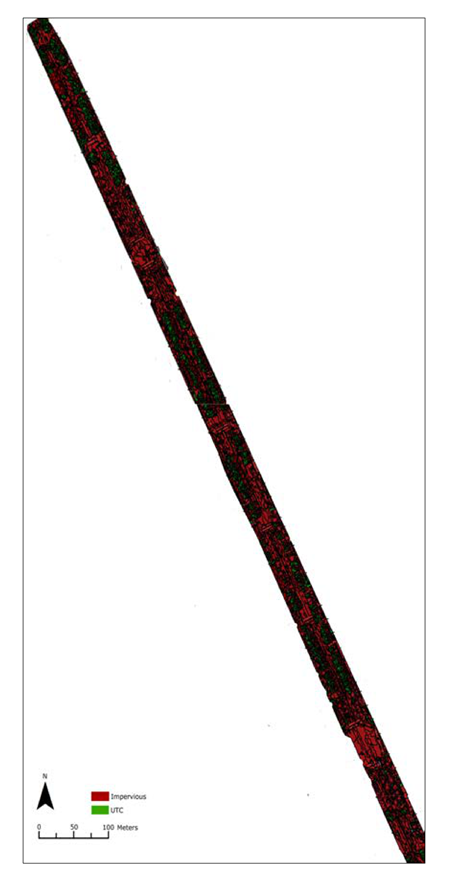
Table 1.
Accuracy assessment using error matrix.
| UTC | Impervious | Producer Accuracy | User Accuracy | Sum | |
|---|---|---|---|---|---|
| UTC | 68 | 2 | 86 | 95 | 70 |
| Impervious | 11 | 63 | 97 | 85 | 74 |
| Sum | 79 | 65 | |||
| Overall Accuracy 0.9 Kappa Coefficient 0.8 | |||||

Summary
This study aims to quantitatively classify the features of UTC by using high resolution aerial photos. UTC analysis is classified by applying the OOC to high resolution aerial photos and applying various environmental variables to the decision tree classification algorithm. The conclusions from this study are as follows: First, when applying the OOC to high resolution aerial photos, characteristic of UTC boundaries which have continuous type of boundary could be figured out well. Second, it was found that the shadows of the building and UTC itself can be effectively removed when using various environmental variables (Brightness value, Blue/Red and Red/Green) into the decision tree classification algorithm. Third, it showed the possibility of quick and easy classification only with natural color (R,G,B band) in UTC classification. The methodology of this study can be effective way of quantitatively quick and easy measurement in UTC analysis and classification.


