Development of the Site Index Curves for Quercus acuta Stands
Article information
Abstract
Background and objective
The purpose of this study is to develop a model for estimating the site index (SI), which is the criterion for determining the site productivity of the Quercus acuta stand as known as Evergreen broad-leaved tree (EBLT) species.
Methods
The materials used in the analysis were data from 63 sample plots, and the sample plots data were collected from the National Forest Inventory (NFI) and other sites. Since the site index is determined by the height and stand age of the dominant trees, the Schumacher model, the Chapman-Richards model, and the Weibull model were applied to derive the optimal equation for estimating the dominant tree height.
Results
The three models derived the parameters and went through a statistical test. Among the three models, the Chapman-Richards model was found to be optimal considering the fitness index, bias, and residuals. By transforming this model, site index estimation equations with the reference age of 30 years were created, and site index curves were derived. According to the analysis of the collected data, the site index of the Quercus acuta stand in Korea was found to be in the range of 10 to 16.
Conclusion
As the growth distribution of Quercus acuta is expected to move north due to climate change, the derivation of the site index representing site productivity will be helpful in making policy and management decisions for this species.
Introduction
Regarding the location or site where trees grow in the forest, Spurr (1952) stated that it can be used to express all environmental factors affecting the amount of timber production per unit area, and Lynch (1958) claimed that the factor that has the biggest effect on site quality can be determined by measuring the dominant tree height according to stand age. Most growth curves today are considered to have been derived from the method described by Bruce (1926). Researchers have long believed that for site index curves, inconsistent sampling or limited sampling from a specific region may cause errors in the cure (Spurr, 1952). According to the data collected while conducting this study, Spring (1917) was one of the first researchers to mention site index, claiming that the site index provides indicators that show the most primitive forest strength. The first study conducted on site index curves was by Beck (1962) who estimated the site index curve of tulip trees growing in the Appalachian Mountains and Piedmont Plateau of the United States. Later, site index curve estimations and curve equations for various tree species were developed mostly by research center under the United States Department of Agriculture (USDA) (Minor, 1964; Beck, 1971; Carmean et al., 1971; Cochran, 1979; Dolph, 1987). Recently, research in the United States, Europe, and Turkey stands out, although not as much as research conducted until the 1980s (Priest et al., 2016; Westfall et al. 2017; Őzcelik et al., 2019; Trim et al., 2019; Zobel et al., 2022). Moreover, reference stand age (basis age) is used when determining the site index, and the United States is mostly applying 50 years, although it varies by tree species and region (Beck, 1962), whereas South Korea applies 30 years in determining the site index (NIFoS, 2004). With regards to this, Goelz and Burk (1996) revealed that reference stand age must be determined by selecting the time when each tree species is the same as or younger than the final age, and that information on reference stand age must be provided so that tree height can be predicted reasonable at other stand ages.
Site index research in South Korea began in the early 1970s by starting to create yield tables for each major tree species. At the time, the reference stand age was 20 years, which was changed to 30 years in the early 2000s as the new yield tables began to be developed (Yim, 1970; Cho et al., 1985; NIFoS, 2004; Kim et al., 2022).
Quercus acuta in this study grows wild in colonies or individually in the southern region and Jeju, South Korea, and its distribution area is known to be approximately 1,238ha in Jeju and 800ha in Jeollanam-do (NIFos, 2014). Recently, artificial afforestation has been increasing to verify the possibility of northern growth distribution of warm temperate tree species due to climate change and to study adaptability to mountainous areas as timber, but this tree species has the highest cold resistance compared to evergreen thorn(Quercus gilva, Q. glauca. Q. myrsinifolia, etc.), silver magnolia(Machilus thunbergii), and Siebold’s chinquapin(Castanopsis sieboldii), thereby showing a relatively high potential for use as resources at the forest level. In South Korea, research on Quercus acuta addresses Suitable land for afforestation, diameter and height growth, carbon storage, thinning effect, and community structure, and recently the development of tree volume tables that serve as a standard for timber production and trade (Kim et al., 2000; Lee et al., 2005; Hwang et al., 2006; Park et al., 2015; Jung et al., 2015, 2023). Quercus acuta is a warm temperate Evergreen broad-leaved tree species that has high utility value as a future tree species that can respond to global warming and create secondary growth forests in large-scale areas damaged by pine wilt disease and forests disturbed by typhoons.
This species grows into tall trees and has sufficient value as timber, and its material is also dense and is expected to be useful as a high-quality material. However, there is no research in South Korea on the site index of this species, which indicates site productivity and environmental location grading, when this it grows in colonies. This site index is typically expressed as the average height of dominant and semi-dominant trees at the index age within a specific stand. This is because unlike the diameter, dominant height is relatively less affected by stand density and generally well expresses the production capacity of the stand. Thus, this study was conducted to present the optimal equation to estimate the site index that represents the potential productivity of forest land for Quercus acuta stands and use this to create site index curves and classification tables.
Research Methods
Testing materials
The materials used to develop the site index estimation equation for Quercus were total 63 sample plots: 14 sample plots in the National Forest Inventory (NFI) where Quercus acuta was found as the main tree species, 23 sample plots obtained from Quercus acuta colonies in Goseong-gun (Gyeongsangnam-do), Haenam-gun, Gangjin-gun, and Wando-gun (Jeollanam-do) by the Forest Biomaterials Research Center, and 26 Quercus acuta sample plots surveyed in parts of Jeju-si and Seogwipo-si by the Warm Temperate and Subtropical Forest Research Center.
Table 1 shows that the average diameter at breast height (DBH) of the sample plots was 16.6 cm, average height was 11.6 m, and average stand age was 36 years, and there was a sample plot with the maximum diameter of 55.8 cm and maximum stand age of 71 years.
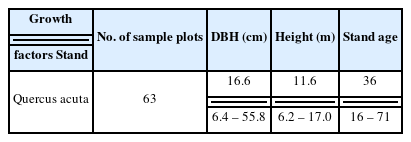
General characteristic of sample plots in Quercus acuta stands
Analysis method
The applied site index estimation model
It is necessary to derive the dominant height curve first to present the optimal site index curve for Quercus acuta stands. Thus, as shown in Table 2, three heigh estimation models were used such as the Schumacher model, Chapman-Richards model, and Weibull model, and the models are as shown in Table 2. Since the site index is determined by dominant height according to stand age, it is necessary to first determine the dominant height model and change parameter a to dominant height and then replace reference stand age (30 years) and actual stand age with each other to change into a site index estimation model (Clutter et al., 1983,) (Equation 1). The site index curve can be drawn immediately once this equation is determined. Meanwhile, the SAS statistical program was used to derive the parameters of each model and determine statistical fit (Kim, 2000).

Dominant trees height equations selected for this study
Statistical test of site index estimation models
To determine the statistical fit of the three site index estimation models, this study used the test statistics such as fitness index (FI), bias, and mean absolute deviation (MAD) of the models as shown in Table 3. In addition, residual analysis was conducted separately to determine the degree of variation between the actual measure of dominant height and the estimated value derived from the models.
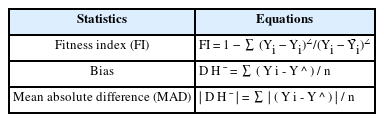
Statistics for evaluating performance of site index equations
The uses of various test statistics in Table 3 show that FI is the same concept as the coefficient of determination in regression analysis, bias refers to the degree to which the estimated value under- or over-represents the true value of the parameter on average, and mean absolute deviation (MAD) is the mean of the absolute value of residuals for each estimate that shows the average deviation size of each individual estimate (NIFoS, 2004).
Results and Discussion
Deriving site index estimation equations for the Quercus acuta stand
As a result of deriving the site index equations for Quercus acuta using three dominant height estimation models, the parameters and test statistics of each model could be calculated as shown in Table 4.

Parameter estimates for three site index equations in Quercus acuta stand
Among the models estimating the dominant height of the Quercus acuta stand in Table 4, the fit indices of the Chapman-Richards model and Weibull model (0.59773, 0.59770) were slightly higher than that of the Schumacher model (0.59376), and bias and MAD were slightly lower than those of the Schumacher model. It is difficult to determine which is more superior between the Chapman-Richards model and Weibull model, but since the National Institute of Forest Science used the Chapman-Richards model in estimating the site index of more than 10 major tree species, this study applied this model in deriving site index curves for comparative tests later.
Fig. 1 shows the diagram of three dominant height estimation models.
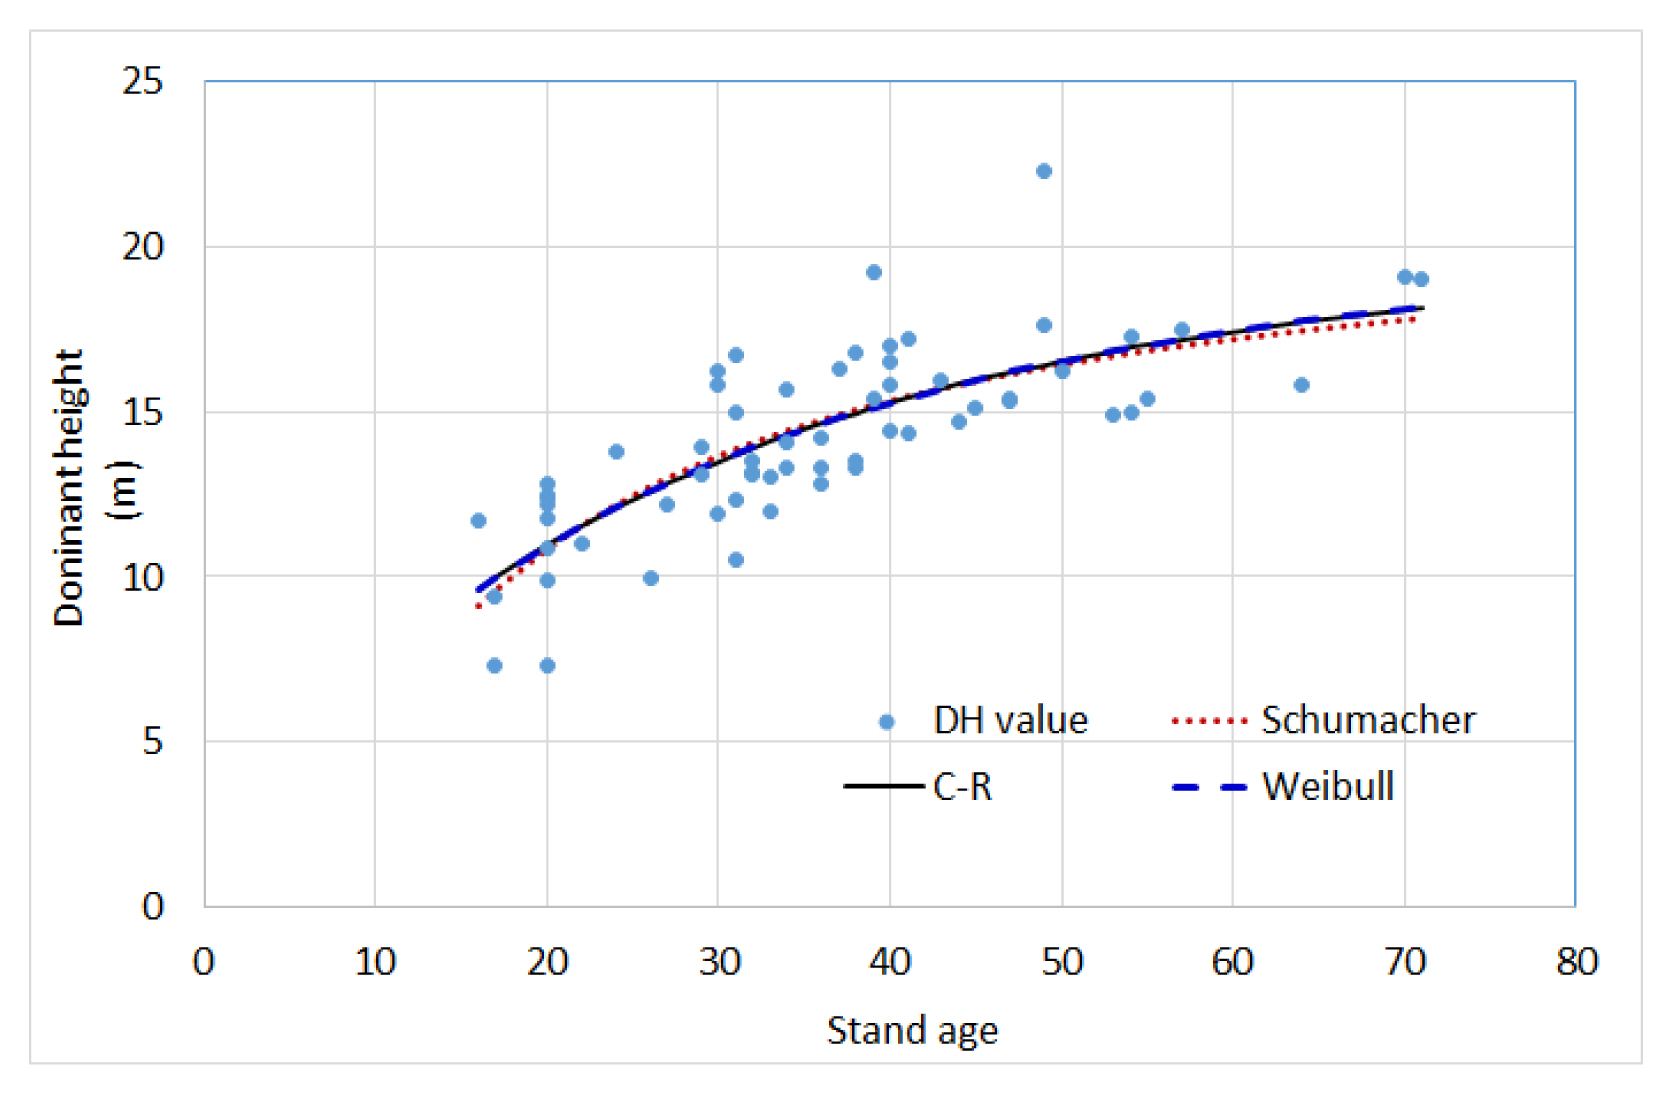
Dominant height (DH) equations pattern by three models.
In Fig. 1, the three curve models explain the actual dominant height values (DH values) in a similar pattern. The Chapman-Richards model and the Weibull model are almost overlapping in a curve, and the curve of the Schumacher model initially started at a slightly lower value than the other two curves, and the dominant height gradually becomes lower than the two curves as the age increases. Residuals were presented in diagrams as shown in Fig. 2 to determine the bias of the curves by these three models.
Site index curve distribution of Quercus acuta stand.
In Fig. 2, all three curve models turned out to have slight overvalues around the stand age of 20 years. While they were evenly distributed around the residual line “0” in other stand ages, there was one unusually undervalued plot around the stand age of 50 years, which is the result of the relatively high dominant height of the sample plot.
Creating the site index curves and classification table for the Quercus acuta stand
The dominant height curve for the Quercus acuta stand showed the highest FI of 0.59773 by the Chapman-Richards (C-R) model (Table 4). Thus, the C-R model was used to substitute parameter a of the C-R model presented in Table 2 by dominant height, and switched the reference stand age (30 years) and actual stand age to convert to the SI site estimation model (Equation 1) (Clutter et al., 1983; NIFos, 2004; Son et. al., 2006, Kim et al., 2022). Through this process, the final site index (SI) model for the Quercus acuta stand was developed.
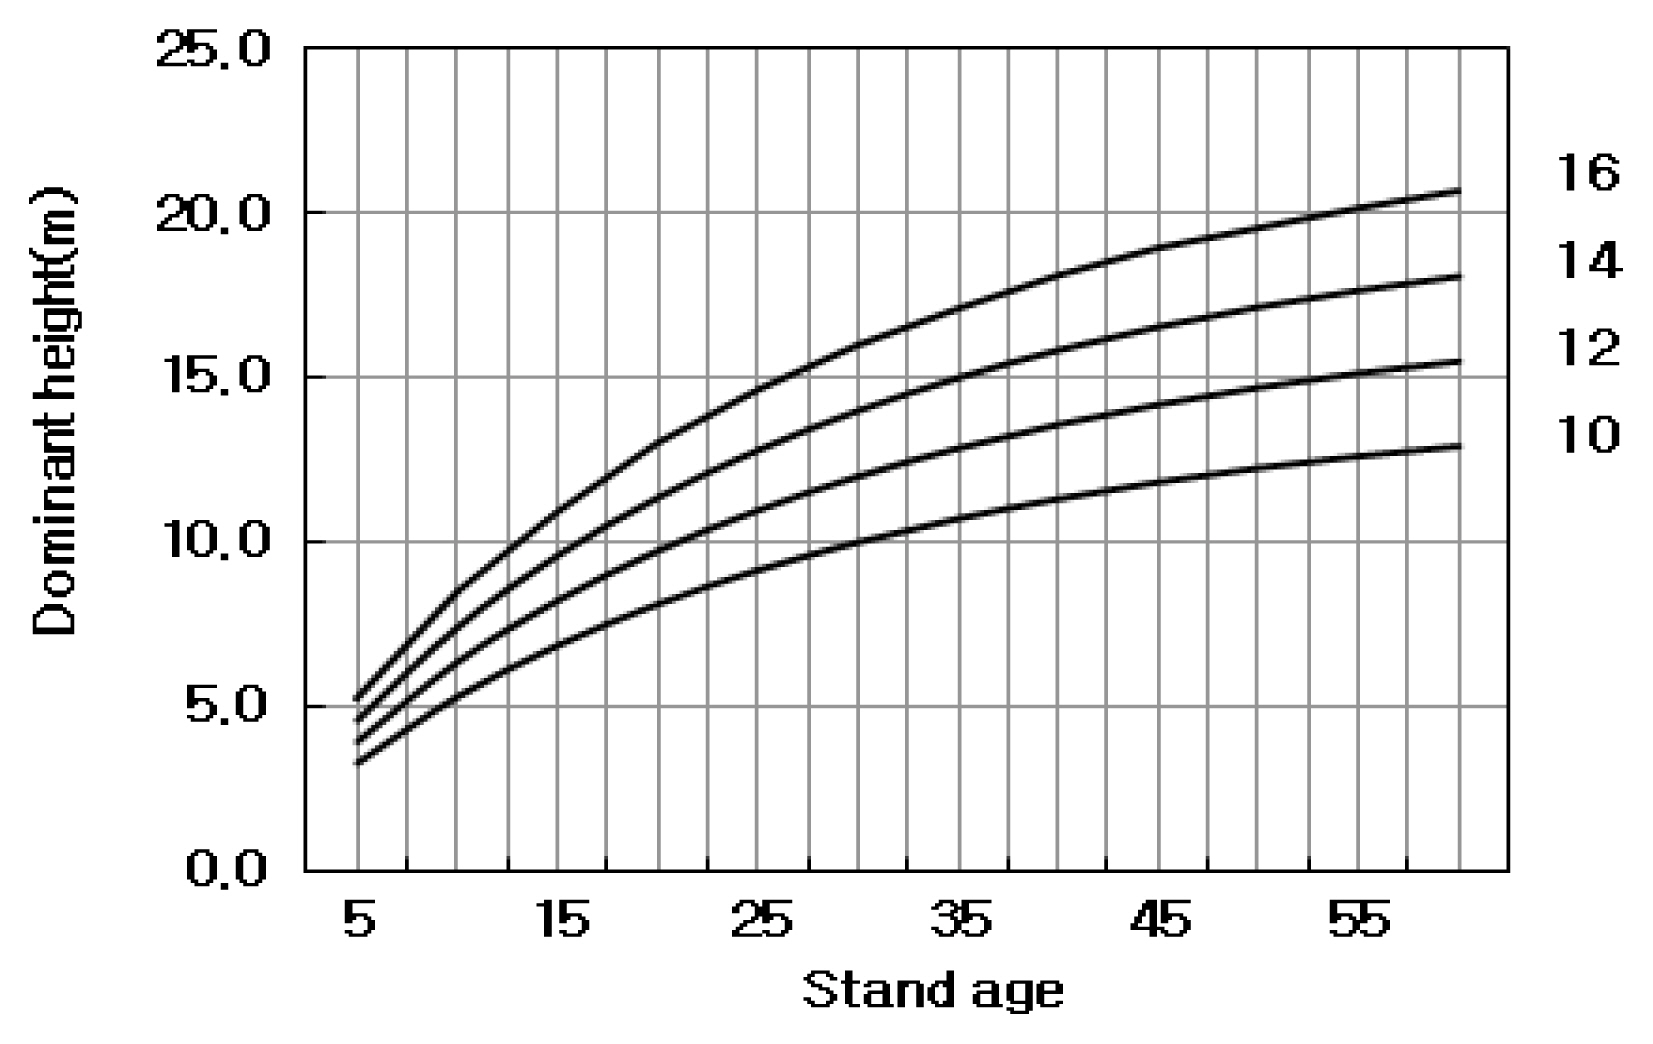
Fig. 3 shows the diagram of the site index curves for the Quercus acuta stand with Equation 2.
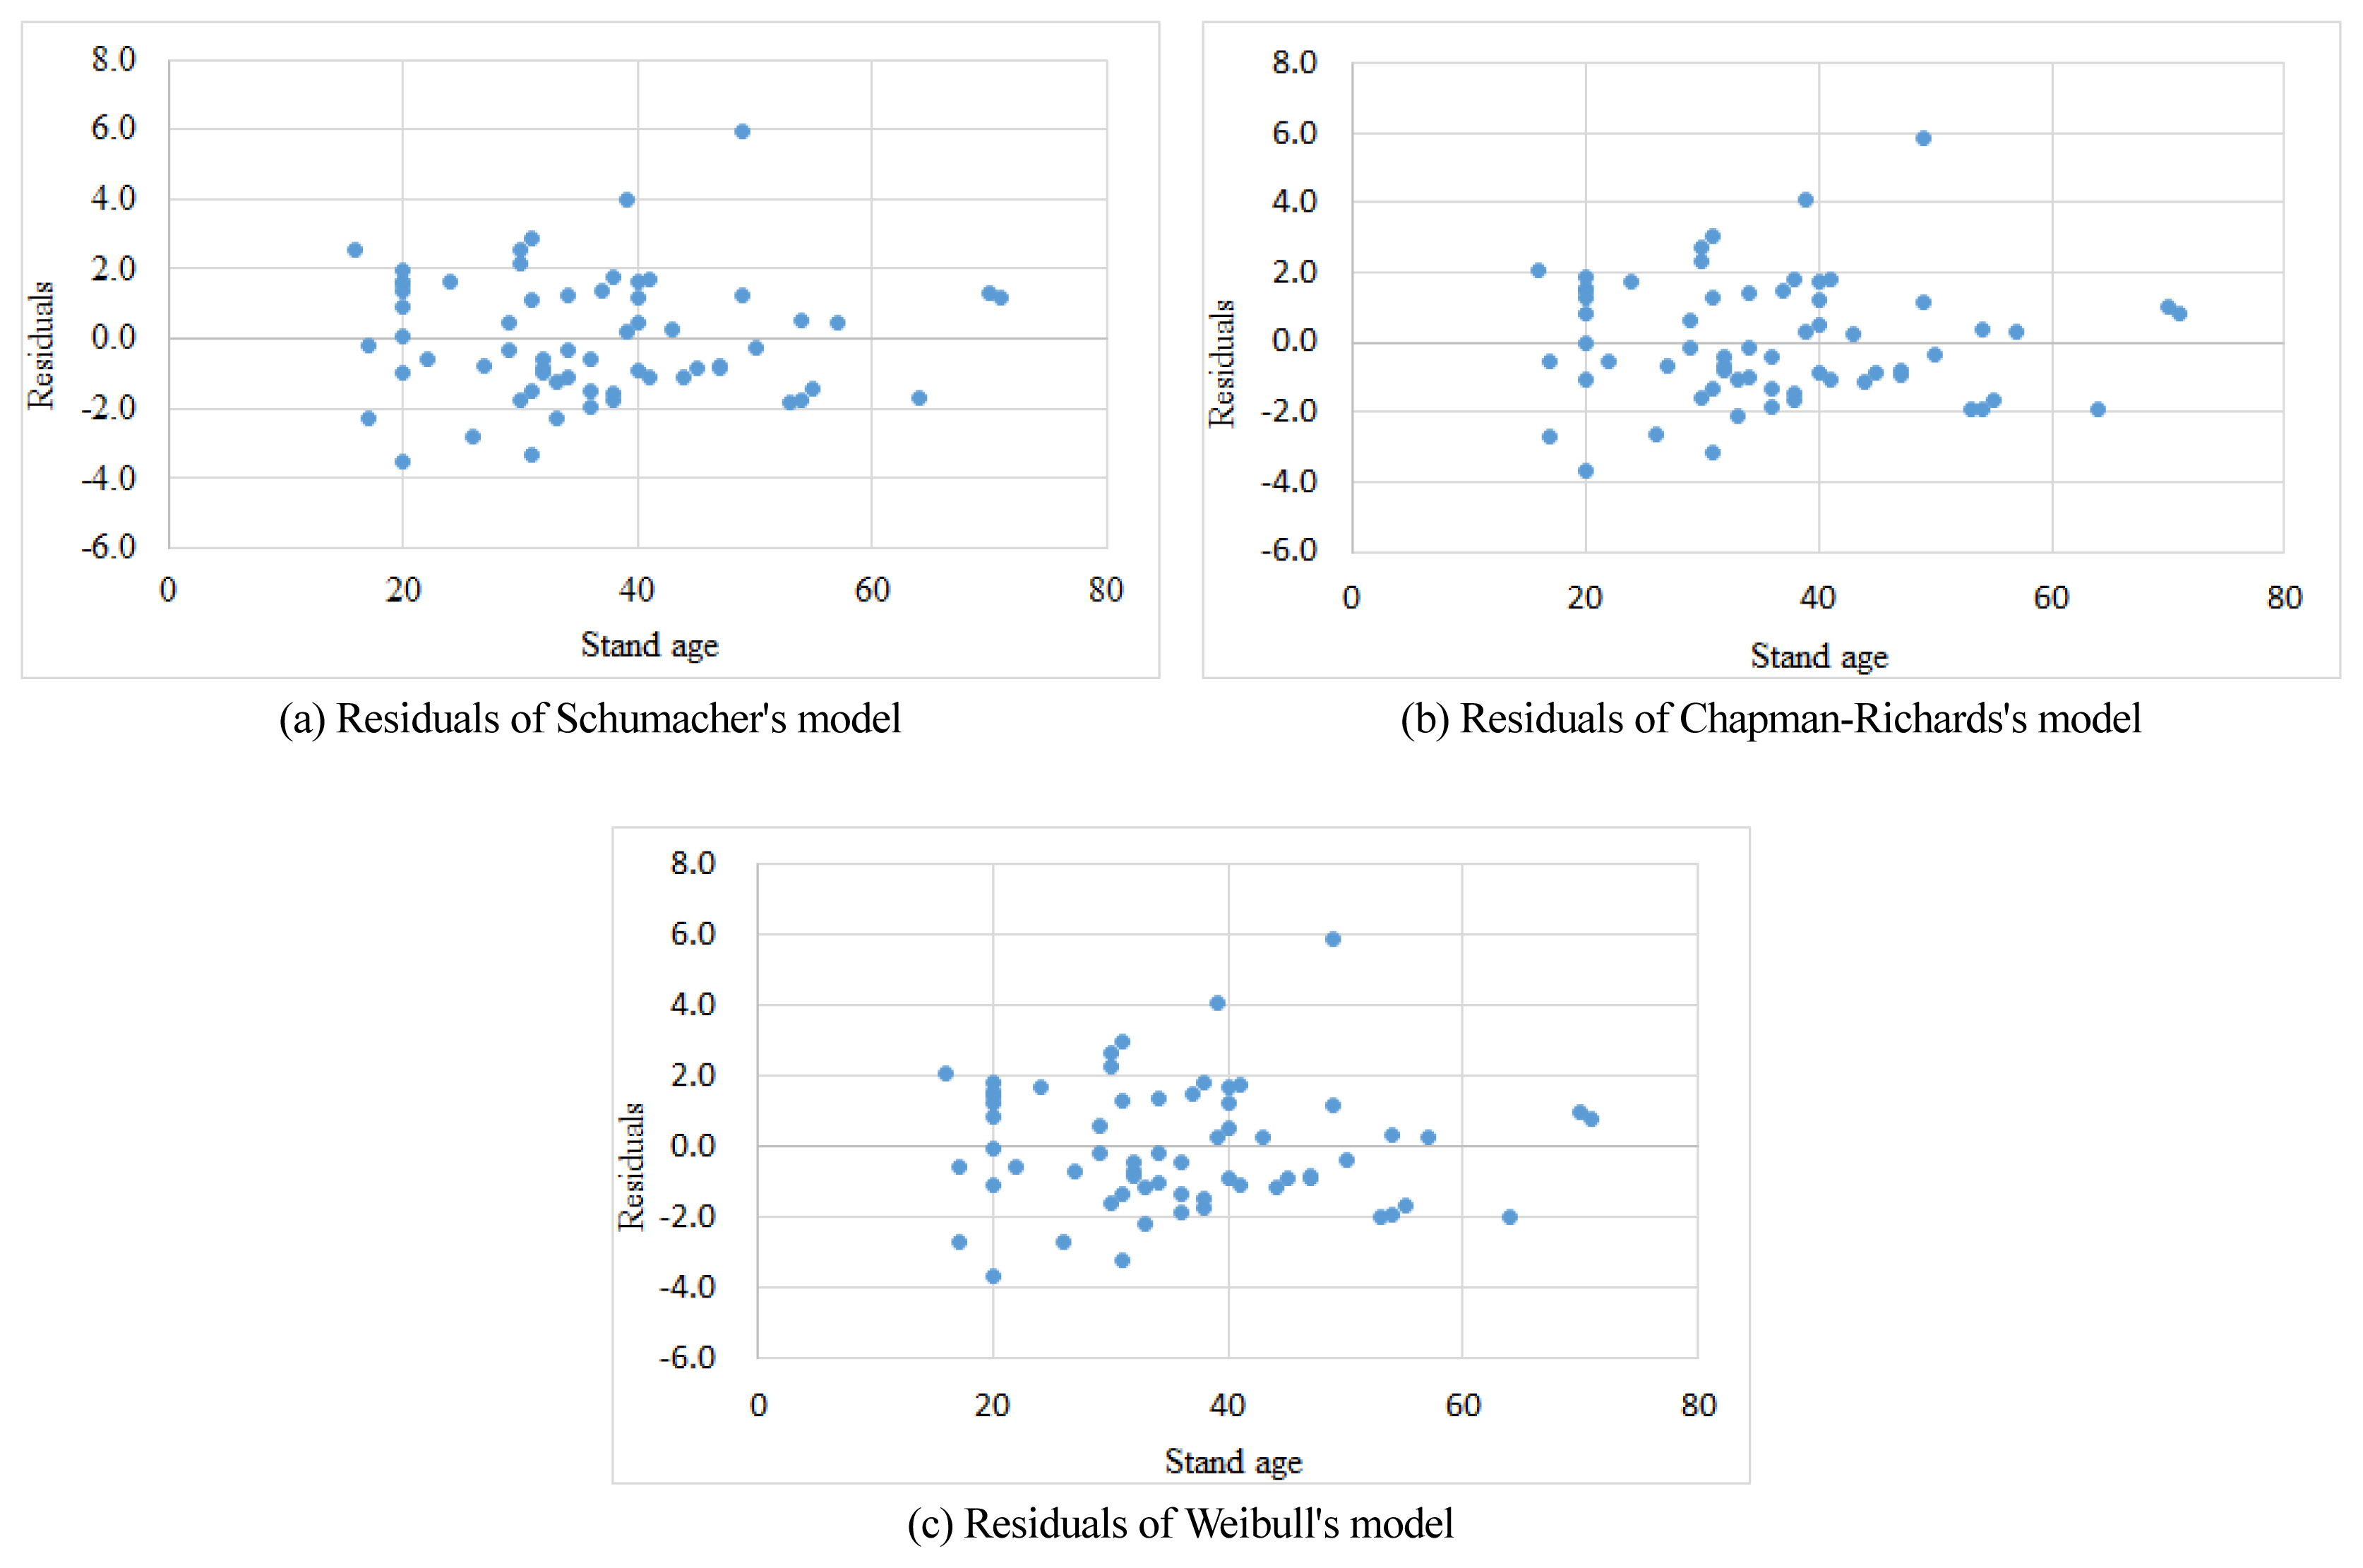
Residual error scattergram for the dominant height estimation by three models.
In Fig. 3, the range of the Quercus acuta site index was set from 10 to 16, which is because the range of dominant height in Fig. 1 was around this range. Site index curves may expand to a certain extent upward or downward when necessary. The site index curves for Quercus acuta based on existing data are showing an upward slope even after the stand age of 60 years. Comparing this with other Fagaceae trees on the stand yield table presented by the National Institute of Forest Science, such as oak, oriental oak, and Mongolian oak, it is somewhat similar to the site index curves for the oak stand, but the dominant height is slightly higher than oriental oak and Mongolian oak (NIFoS, 2021). Moreover, by overlaying the distribution of observed dominant height values by stand age for the real forest of Quercus acuta presented in Fig. 1 on the site index curves of Fig. 2, it was discovered that most observed values were adequately placed within the classification area by site index.
To increase user access to the site index curves in Fig. 2, the dominant height for each site index was quantified and the site index classification table was created as shown in Table 5.
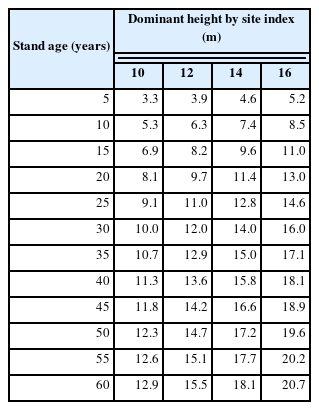
Site index classification table of Quercus acuta stand (Unit: m)
Table 5 shows dominant height for each stand age according to site index 10, 12, 14, and 16, and dominant height at stand age 30 has the same value as the site index, which is because the reference stand age is already set as 30 years when analyzing the estimation equations to derive the site index curves.
Conclusion
This study investigates the growth characteristics of each forest land in South Korea for Quercus acuta, which is known as a candidate species for responding to global warming due to its relatively high cold resistance and excellent carbon storage capacity among the warm temperate evergreen broad-leaved tree species growing naturally in the southern region of South Korea. To this end, this study derived dominant height curves by stand age to identify tree height growth and site productivity of the Quercus acuta stand and presented the site index (SI) that is the standard for determining site productivity. This study estimated the site index by deriving dominant tree heights using the non-linear Chapman-Richards model and classifying them by level into curves. The site index curves for Quercus acuta currently distributed in South Korea are in the range of 10 to 16, which shows that the average height of dominant trees is in the range of 10 m to 16 m based on the stand age of 30 years. Compared to the site index curves on the existing stand yield tables, this range is similar to that of oak, which is in the same Fagaceae family. The nationwide site index for the Quercus acuta stand is the first to be estimated in South Korea, and it is considered to be the most precise site index since it covers all stand survey data in existence, which is expected to contribute to managing forests and establishing afforestation policies for this species.
There are overflowing study results showing that subtropical plants will gradually expand their growth range toward the north due to temperature rise caused by climate change. The northward movement of broad-leaved evergreen trees currently distributed in the coastal islands and southern region of South Korea is also well expected, which is why researchers are already exploring the possibility of their growth in temperate regions. At this point, it seems timely to derive a nationwide site index that serves as the standard for determining site productivity of Quercus acuta that is a major species of afforestation among warm temperate broad-leaved evergreen trees. Future research must continuously monitor tree growth in various locations and growth environments in preparation for further changes in the current growth distribution of the tree species due to geographical, environmental, and climatic impacts. The results of this study can be used to determine the right tree on the right site of Quercus acuta plantations and also used in related research to improve the scale of forest resources using warm temperate tree species in response to global warming.