Street Tree Management Strategies for Different Special-Purpose Areas: Using Citizen Science Data
Article information
Abstract
Background and objective
This study investigated the occurrence characteristics of street tree management factors based on different special-purpose areas with emphasis on citizen participation in data collection.
Methods
We collected growth and management data of street tree sections and individual trees within sections using a monitoring form developed for street trees in four special-purpose areas in the urban area of Chuncheon. We used a binary logistic regression model to analyze the probability of occurrence for each management factor (pruning traces, sign blocking, disease and pest, felled trees, piled objects, and broken branches).
Results
The probability of occurrence of management factors varied by special-purpose area, which was related to the characteristics of each area.
Conclusion
This study suggests the need to develop efficient street tree management strategies by prioritizing management factors in consideration of differences in special-purpose areas
Introduction
Street trees play a critical role in improving the urban environment by cleaning pollutants out of air, reducing fine dust, improving microclimate, creating landscape diversity, and reducing urban noise (Bernatzky, 1982). Recently, the growing public interest in environmental problems that occur in cities such as the urban heat island and climate change is increasing the importance of various environmental functions that street trees have (Nowak et al., 2013).
Street tree management requires much manpower and budget. Street tree management in South Korea is currently based on the ordinance on the creation and management of street trees by each local government according to Article 21 of the Creation and Management of Forest Resources Act. Lee et al. (2022) conducted a survey on the current state of street tree management in 17 local governments and the perceptions of public servants in charge. According to the results, the costs incurred by creation and management of street trees as of 2020 were KRW 47 billion and KRW 80.5 billion each, adding up to total KRW 127.5 billion, which shows a 26.9% increase from the development cost of KRW 37.1 billion and a 268.5% increase from the management cost of KRW 21.8 billion in 2003. The budget for creation was higher in Gangwon-do, Chungcheongnam-do, and Jeollanam-do compared to other local governments. Moreover, as a result of interviews with public servants in charge of street tree management in the same study, it was found that the public servants in charge were facing difficulties in creation and management of street trees due to excessive workloads and insufficient budget. Thus, there is a need for efficient street tree management strategies to resolve issues such as the constantly increasing budget for work related to street trees as well as excessive workloads.
As a solution, the Korea Forest Service established a plan for creation and management of street trees in 2022 and emphasized the importance of promoting citizen participation in creation and management of street trees (Korea Forest Service, 2022). Street tree management that involves citizen participation is an effective way to manage street trees. A typical example of actual citizen participation in street tree management is the “2015–2016 Street Tree Census” project in New York City. With the participation of 2,200 volunteers, this project is known to be the biggest project related to parks carried out at the city level in the history of the U.S. (Johnson et al., 2018). Citizens collected information on street trees in New York, based on which they created a map of street trees, and integrated and computerized over 220 thousand out of total 660 thousand street trees as of 2015 on the street tree map. Moreover, Jang (2020) discussed ways to solve the problems regarding maintenance and management of street trees at the level of shared resource management by citizen science. Citizen science is a method in which citizens participate in scientific research activities in cooperation with professional scientists, and this has the potential to raise awareness of environmental problems, make research progress by producing scientific data, and inducing citizen-expert cooperation (Conrad and Hilchey, 2011; Haywood et al., 2016; Bae and Jang, 2006). With these benefits, citizen science is expected to be an alternative that can overcome the aforementioned limitations of street tree management in South Korea, but there is insufficient research in South Korea on establishing street tree management plans based on street tree data collected by general citizens.
Meanwhile, there is a need for a spatial strategic approach to efficiently maintain and manage work related to street trees that is constantly increasing due to tree planting projects with limited budget and manpower. In et al. (2010) investigated the differences in chlorophyll content and volumetric soil water content, which are physiological factors, in Ginkgo biloba and Platanus orientalis due to environmental factors in each special-purpose area. Jeong (2019) provided implications for establishing urban management policies by categorizing and quantifying human activity patterns and spatial characteristics that vary by region. These previous studies provide the grounds for assuming that land use characteristics and human activity patterns by special-purpose area may cause differences in the characteristics of street tree management.
Therefore, the purpose of this study is to present a street tree management plan that reflects citizen participation and regional characteristics, for which it analyzes the frequency of occurrence of management factors and street tree characteristics for 4 special-purpose areas in urban areas using street tree information collected by citizens and discusses street tree management strategies for each special-purpose area. The results of this study are expected to be used as basic data to derive tree species selection, management cycle, and key management factors based on the occurrence patterns of management factors in each special-purpose area, enabling more efficient street tree management with limited manpower and budget.
Research Methods
Status of research sites
Chuncheon is making constant efforts at the local government level to create a unique urban landscape and improve the environmental functions of street trees. For street tree management, Chuncheon divides the city into total 8 districts according to the administrative districts of eup/myeon/dong and topographical features (Chuncheon City, 2019). Landscape planting companies selected through restricted bidding and competitive bidding are pruning, weeding, and mowing street trees through the annual unit cost projects for each management district. As of 2022, pruning, weeding, mowing, watering, and digging account for the largest portion of the street tree management budget, taking up approximately half of the total budget (Chuncheon Green Park Department, 2020). The annual unit cost divided by street tree management district accounted for approximately 11% of the total budget for District 1, 12% for District 2, 15% for District 3, 16% for District 4, 16% for District 5, 12% for District 7, and 16% for District 8, taking up a high ration in Districts 4, 5, and 8 with dense populations.
As a result of identifying the distribution status of street trees based on the Chuncheon street tree information provided by Public Data Portal as of January 2023, there are total 28,293 street trees planted in Management Districts 1 through 8. From the starting point of the street tree sections, there are 2,900 trees planted in total 24 street tree sections (total length approximately 21km) in District 1, 2,481 trees in 14 sections (total length approximately 66 km) in District 2, 5,328 trees in 12 sections (approximately 70 km) in District 3, 3,482 trees in 22 sections (approximately 21 km) in District 4, 7,919 trees in 34 sections (total length approximately 42 km) in District 5, 2,634 trees in 24 sections (approximately 17 km) in District 6, 1,790 trees in 14 sections (approximately 16 km) in District 7, and 1,758 trees in 13 sections (approximately 14km) in District 8. Streets with many street trees were included in District 5, which is where residential areas are concentrated. Streets distributed in District 5 had the most diverse tree species, and District 5 includes Toegye-dong, Seoksa-dong, Hyojadong, and Gangnam-dong where the population density is relatively high in Chuncheon.
Next, as a result of examining the tree species included in the street tree sections, there were Ginkgo biloba, Prunus serrulata, Platanus occidentalis, Chionanthus retusus, Pinus densiflora, Zelkova serrata, Prunus sargentii, Cercidiphyllum japonicum, Styphnolobium japonicum, Zelkova serrata, Cornus kousa, Acer buergerianum, Aesculus turbinata, Metasequoia glyptostroboides, and Prunus serrulate planted on the street tree sections of Chuncheon. Ginkgo biloba was the main species planted in Chuncheon, and District 5 included a variety of street trees.
Chuncheon currently has a management system centered on districts, but we selected the research sites with focus on 4 special-purpose areas such as residential area, commercial area, industrial area, and green area by subdividing the land use characteristics of the city. To select the research sites for the field survey, we selected 2 street tree sections for each of the residential, commercial, industrial, and green areas with focus on areas with high population density, many street trees, and diverse tree species included in the streets based on the street data of each district. Finally, total 8 street tree sections with street tree management factors (Table 1 and Fig. 1).

Research sites

Research sites of the study.
Collection of citizen data
This study developed field notes to collect street tree data through the field survey. Based on the register for the creation and management of street trees according to the Enforcement Regulations on Creation and Management of Urban Forest Act, we added the data items collected on the 2015–2016 Street Tree Census by New York City and collected street tree data with reference to Kim (2021), Kim (2016), and USDA (2010). The developed field notes consist of the general monitoring form and individual tree monitoring form. The former records general data on street tree sections and the latter records detailed data of each individual tree.
The general monitoring form shows the general data on street tree sections and includes general information (date of survey, investigator information, etc.), road information (road name, investigated district, special-purpose areas, number of lanes, etc.), and street tree section data (name of section, number of plants investigated, etc.) (Fig. 2).
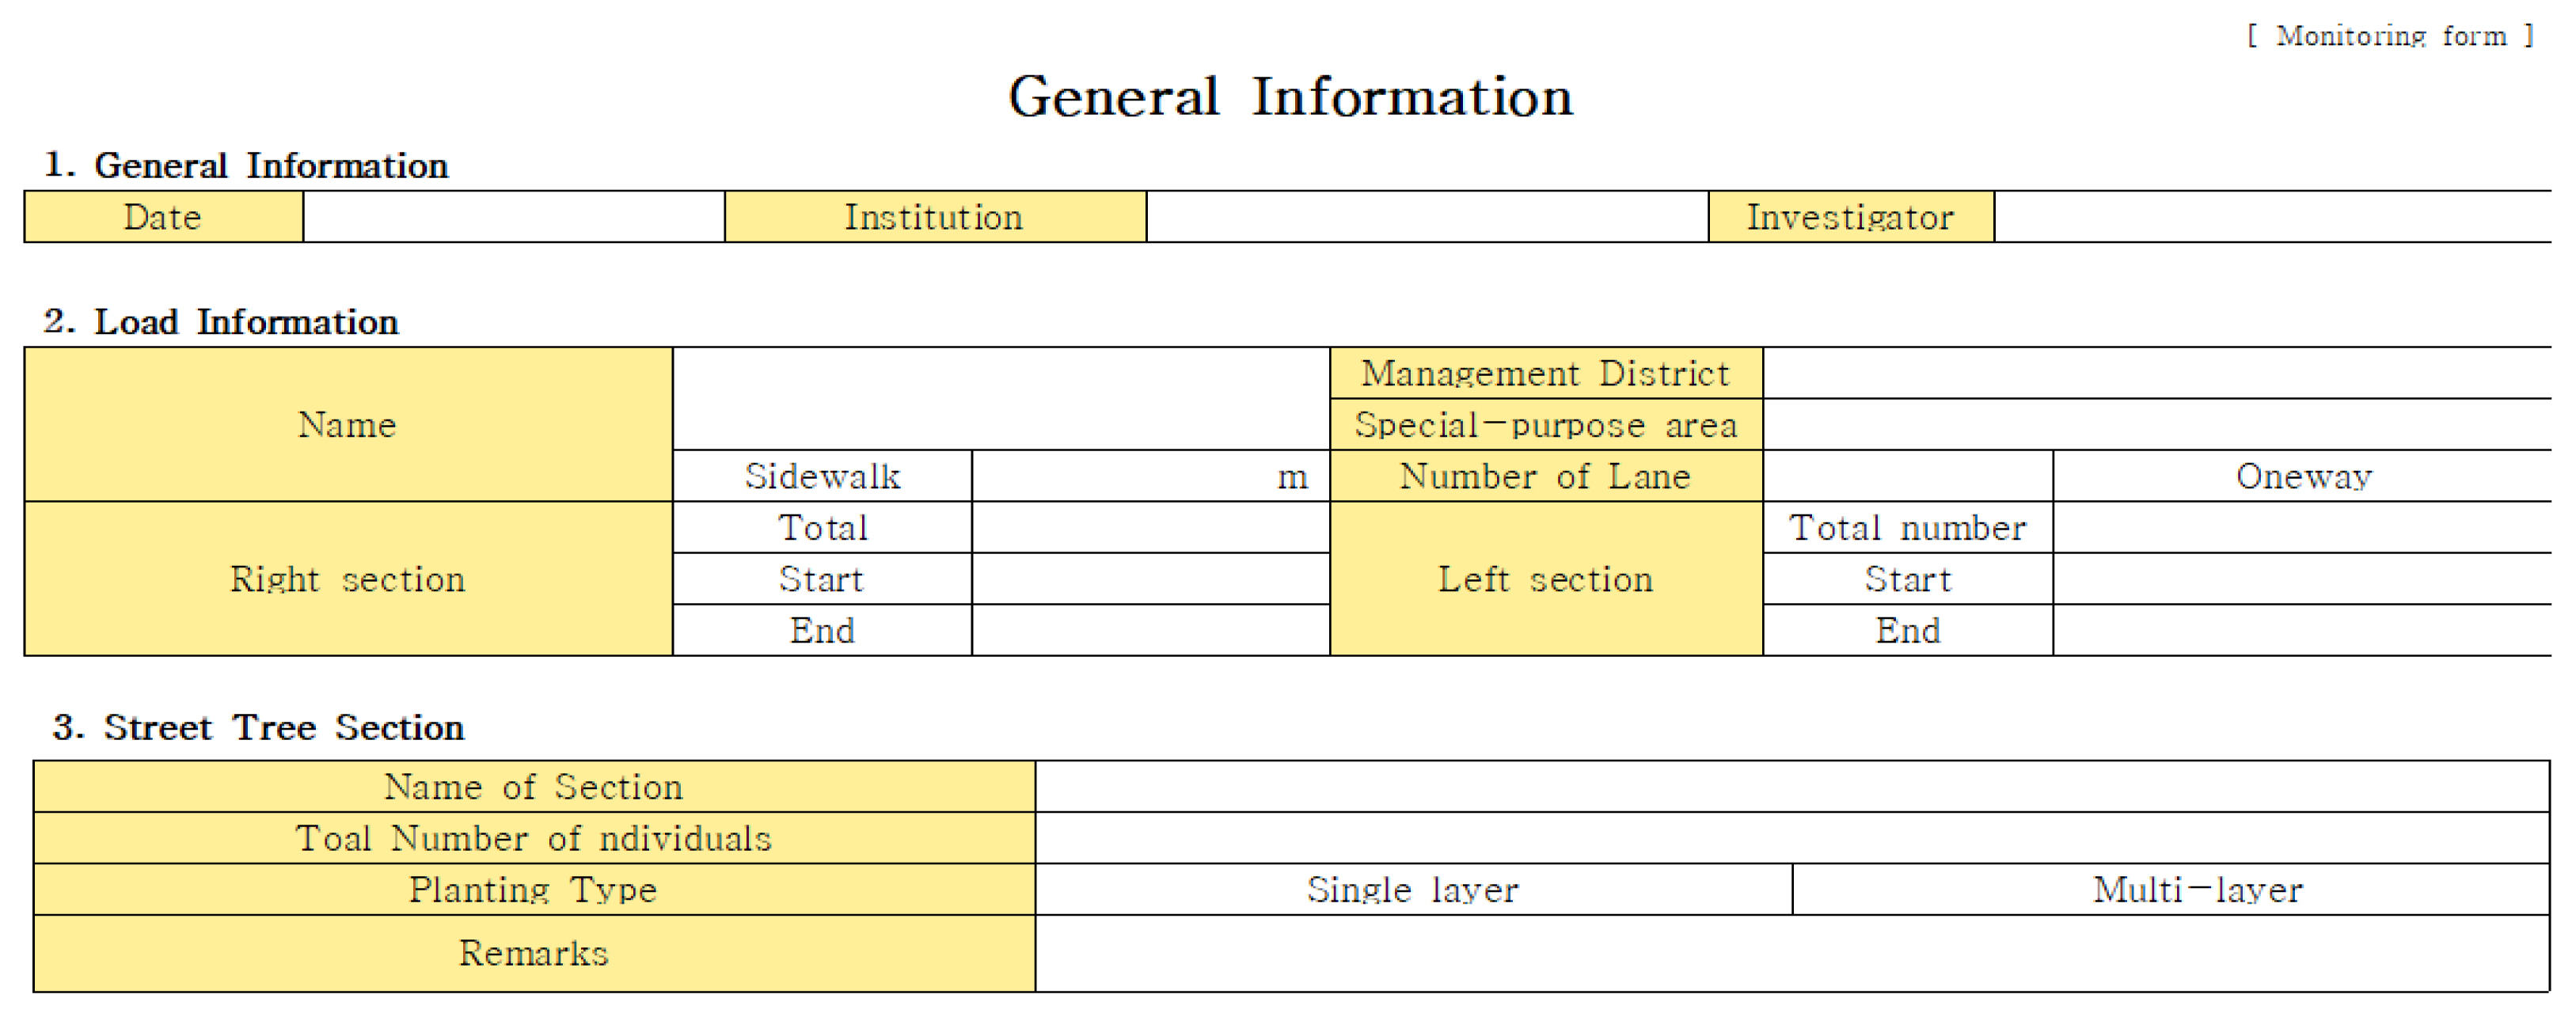
Developed monitoring form on general information of survey site.
The individual tree monitoring form is a table showing detailed data of each individual tree and includes tree growth survey items such as species, diameter at breast height (DBH), height, canopy vitality, and visual health of leaves/trunks/branches and management survey items such as soil moisture state, pruning traces (pruning, pollarding), sign blocking, disease and pest, felled trees, piled objects, and broken branches (Fig. 3). Tree growth data was obtained by measuring with measuring equipments, visual assessment, and grading according to the criteria.

Developed monitoring form on individual trees information of survey site.
The data collection method to survey the growth status of individual street trees in each section is as follows. DBH refers to the diameter of a tree measured at a point that is 1.37m above the ground, and DBH was measured by wrapping a DBH tape measure around the trunk. When there were two branches at the point 1.37 m above the ground, we measured the DBH of each branch and calculated the mean as the DBH of the tree. Height was measured by comparing the surveyed trees with the floor height of an adjacent building or the height of an electric pole, or by using the human scale. Canopy vitality is a health index that best represents the characteristics of an individual in order to diagnose and evaluate the visual health of a tree, and it was evaluated as shown in Fig. 4 by visually inspecting the trees and grading them according to each criterion based on the canopy vitality estimation criteria (Table 2) presented by Kim et al. (2016).
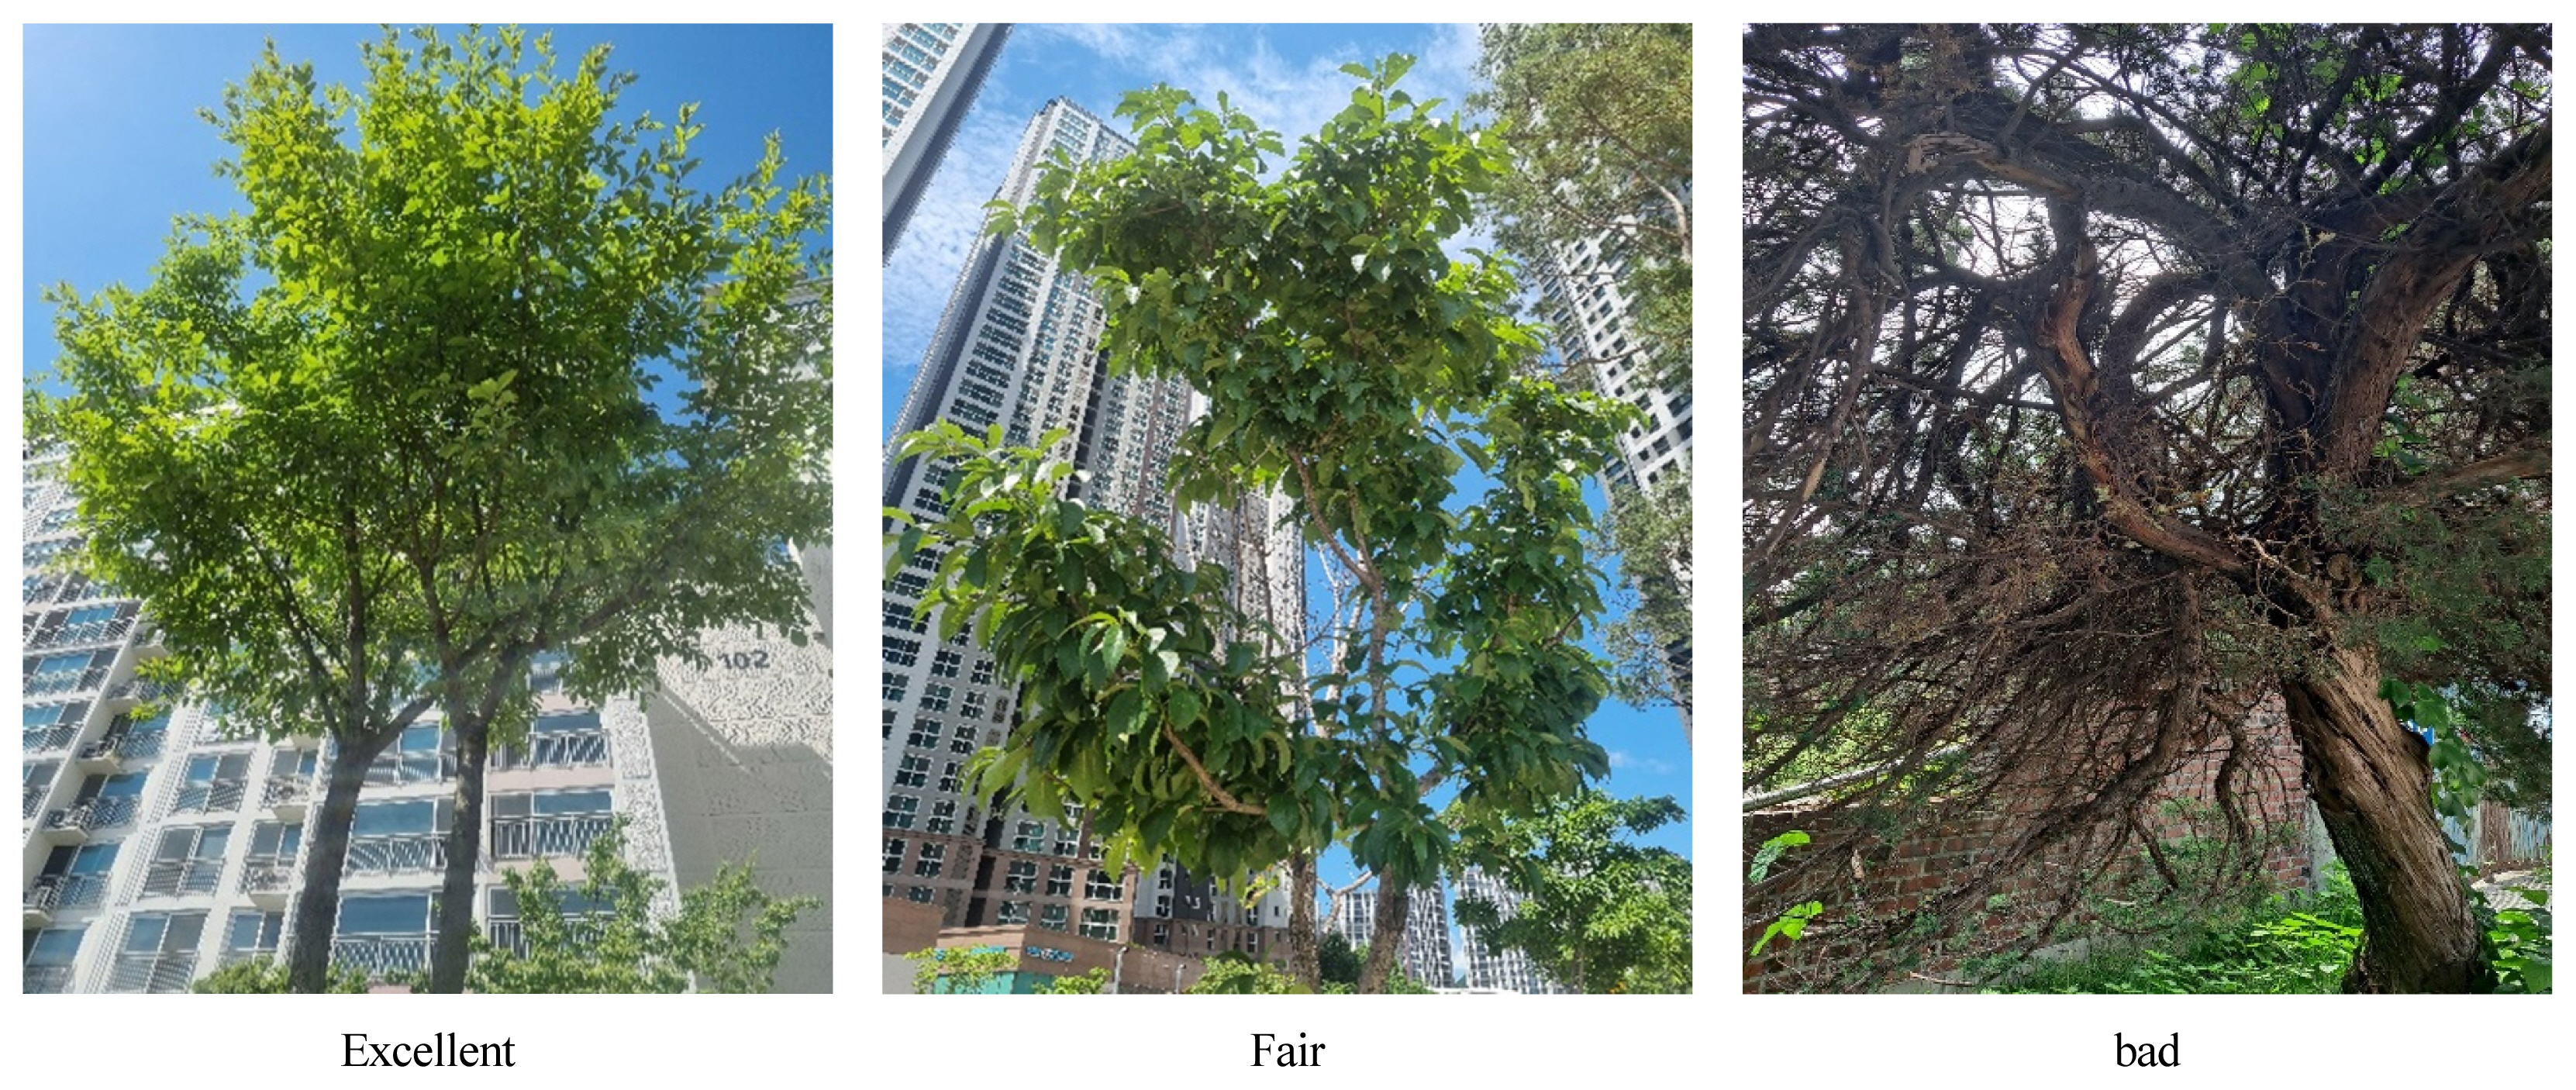
The example of grade estimation for canopy vitality.
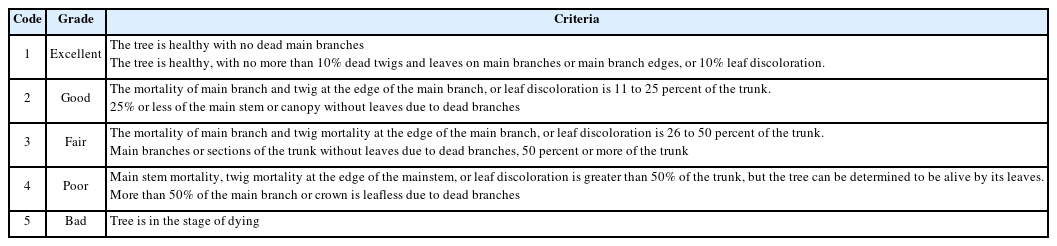
Estimation criteria of canopy vitality
Visual health of leaves/trunks/branches was checked with unaided eye and evaluated on the scale of good, fair, and poor. The visual health was considered ‘poor’ when there were at least 80% of symptoms caused by physical and biological stress, diseases and pests, and tree disease according to the USDA (2010), ‘fair’ when there were at least 30%, and ‘good’ when there were 10% or less. Problems with the growth of leaves include cases in which the leaves are eaten and damaged by insects, the leaves are small due to poor growth, and the leaves are discolored or dry (Fig. 5). Problems with the growth of trunks include cases in which the trunk is abnormally thin compared to the size of the tree, the trunk is damaged in the shape of a hole, and the bark shows cracks or is peeled off (Fig. 6). Moreover, problems with the growth of branches include cases in which the branches are abnormally think due to lack of growth, show stripped bark, have signs of broken branches, and poor condition of the branches (Fig. 7).
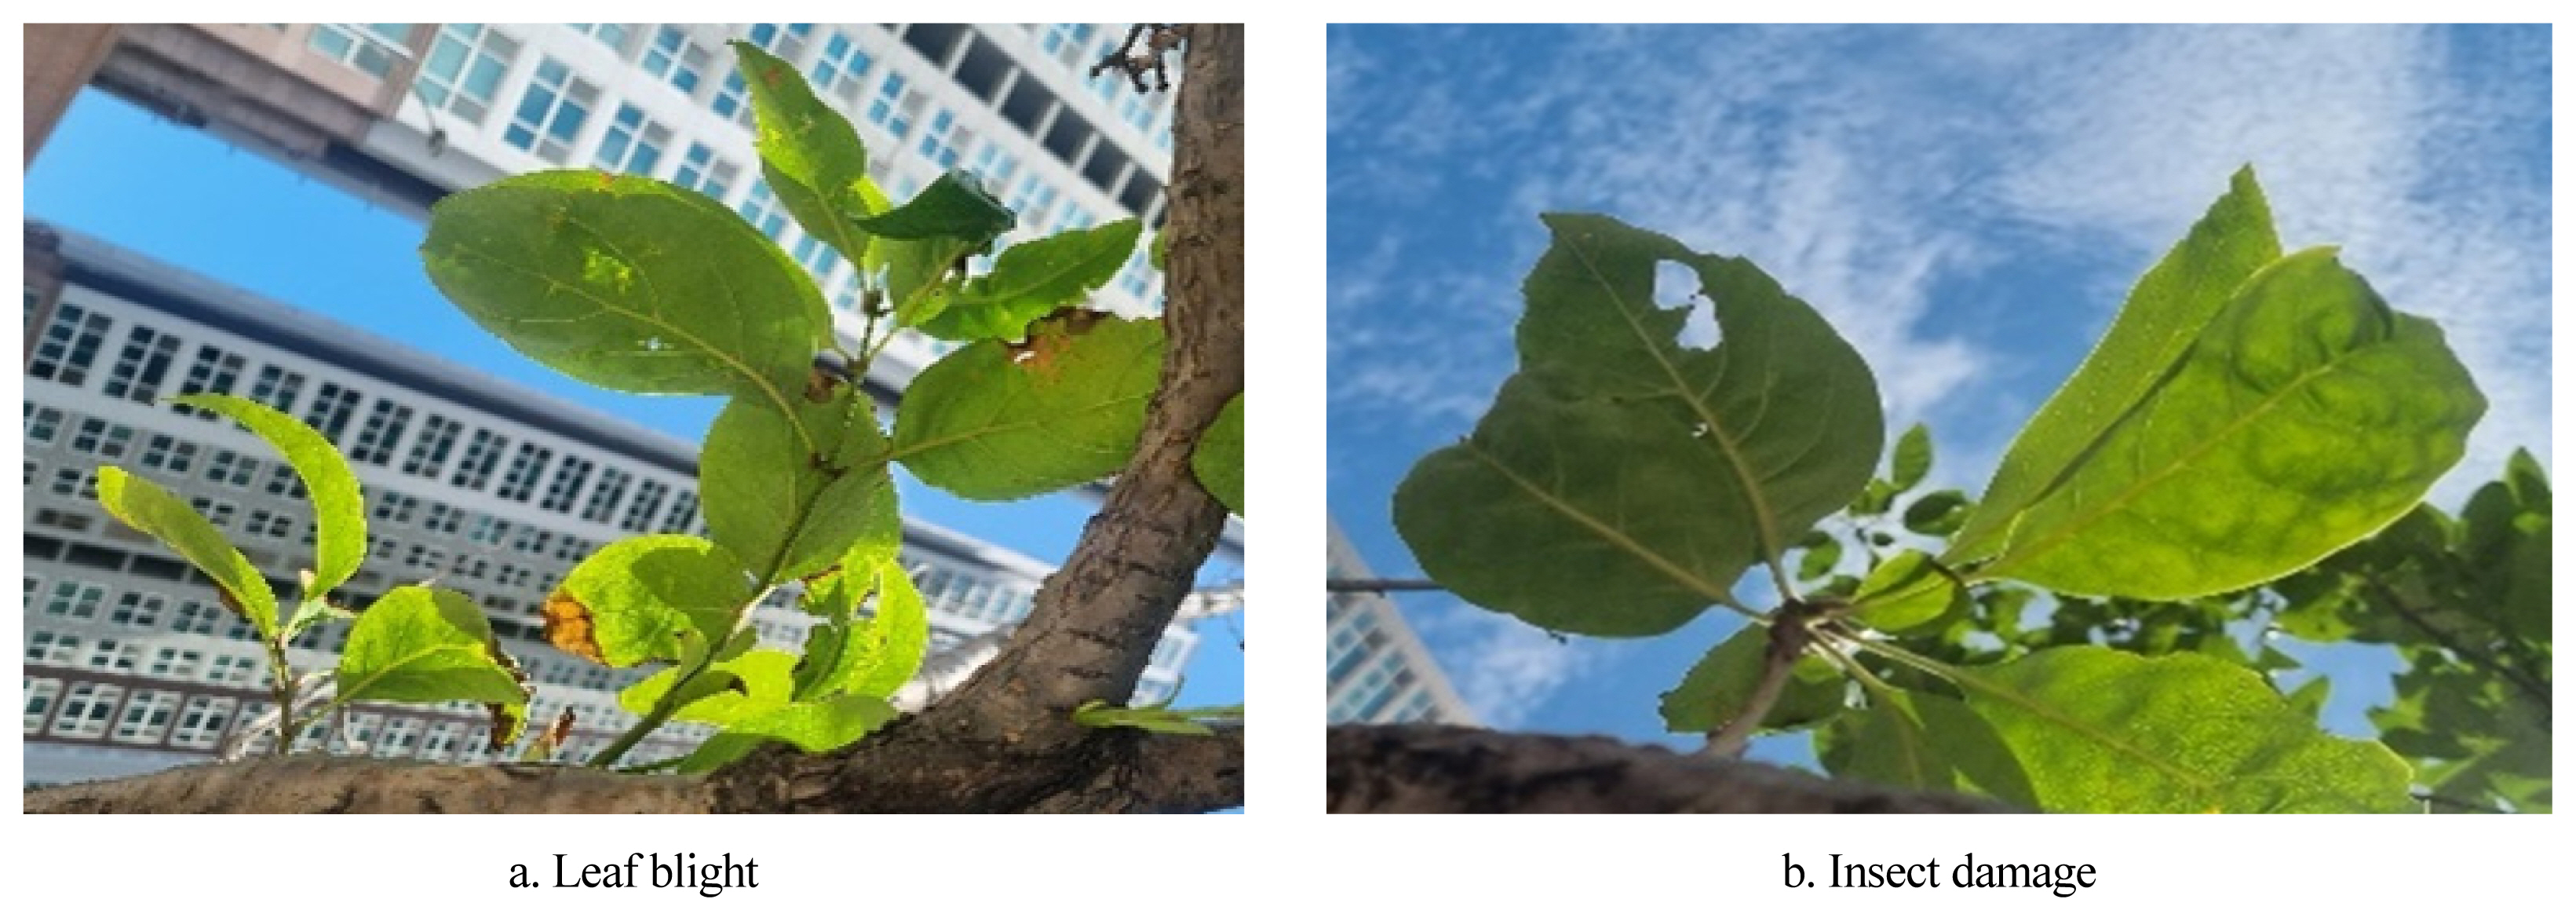
Visual health assessment of the leaves. (a) Leaf blight is a plant disease that primarily affects the leaves of a plant. (b) Insect damage is any harm or injury inflicted on a tree by various species of insects.
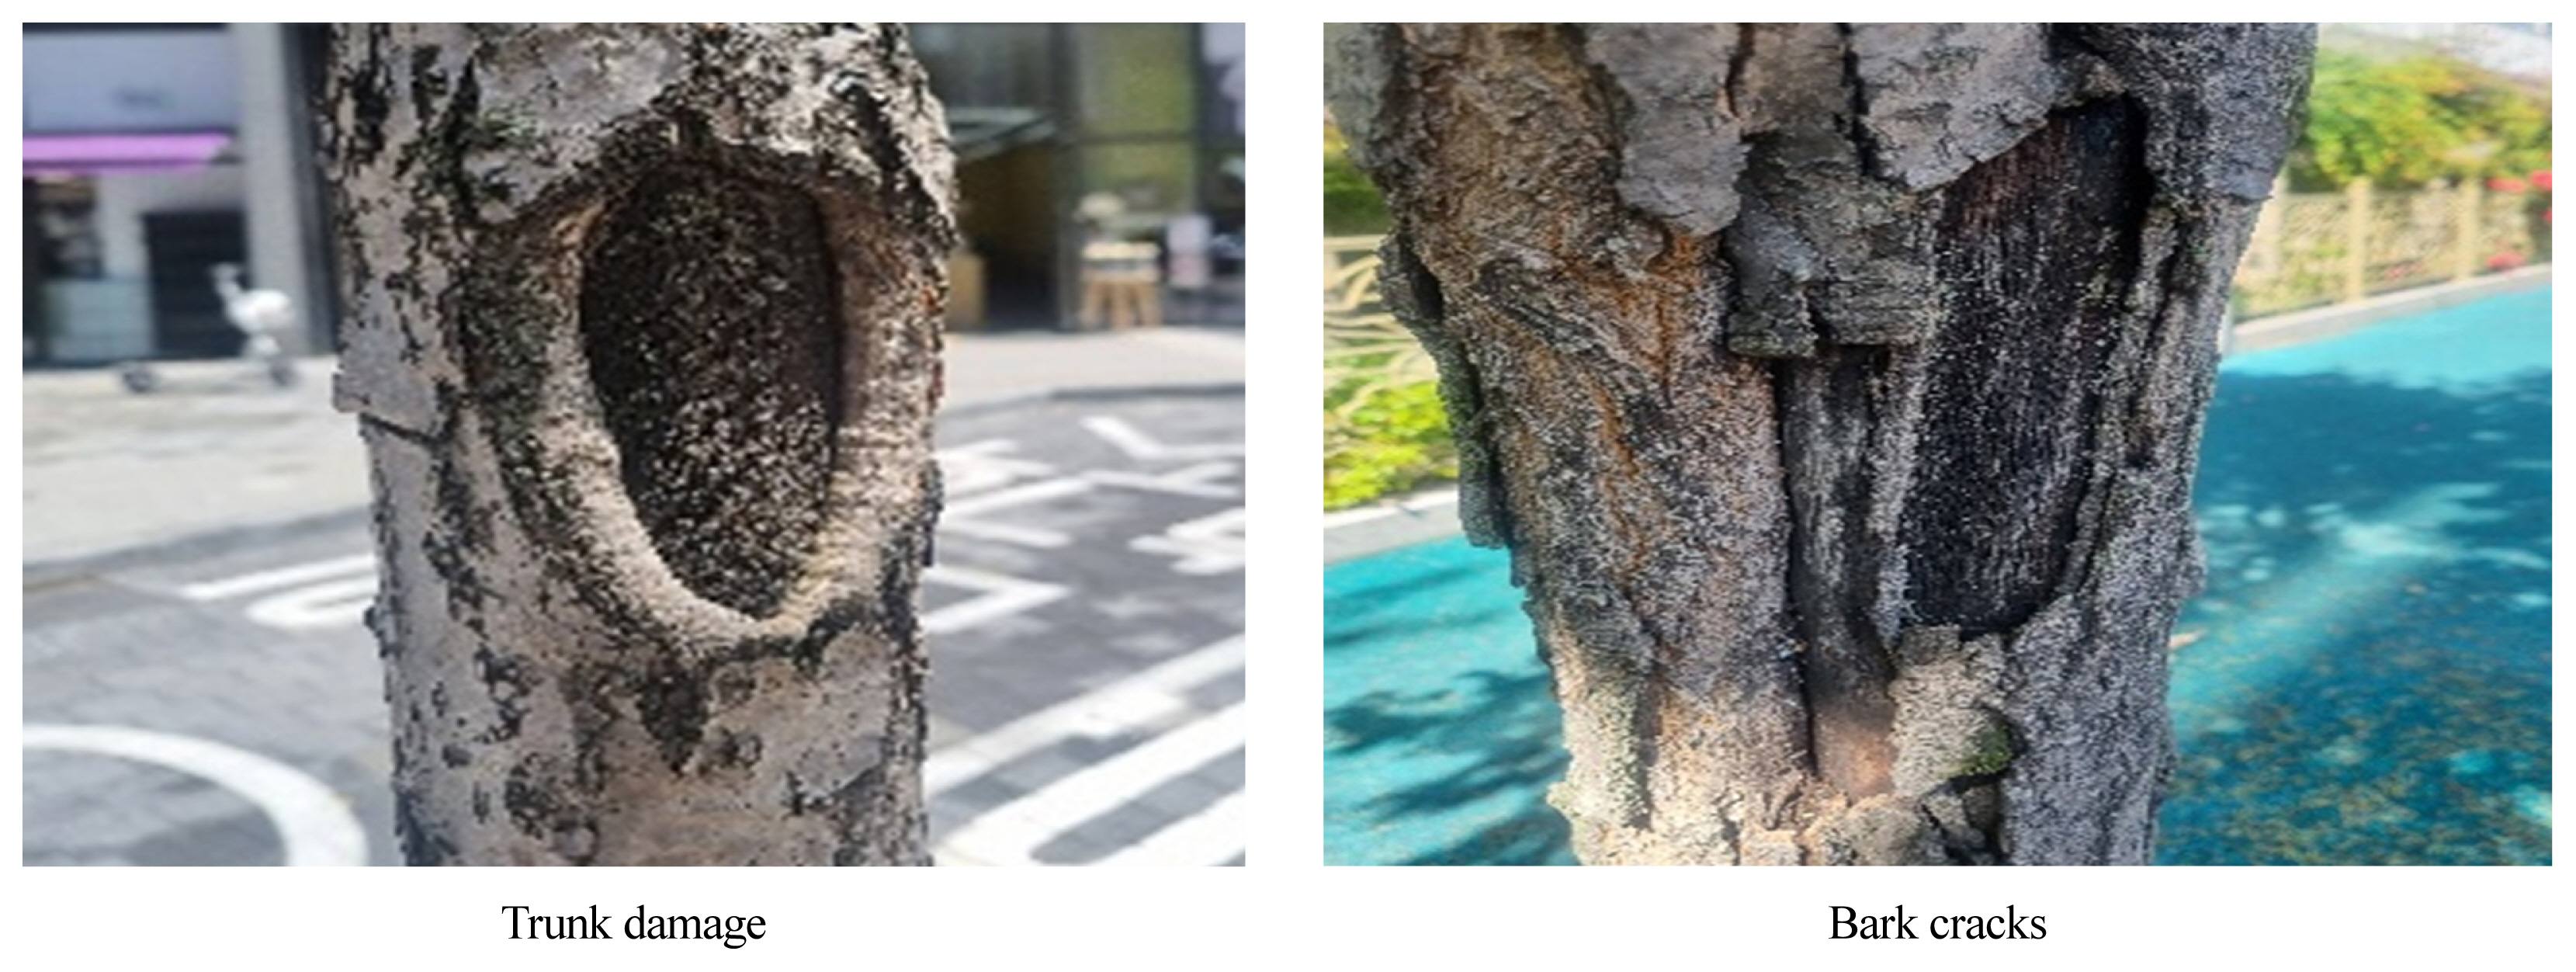
Visual health assessment of the trunk.
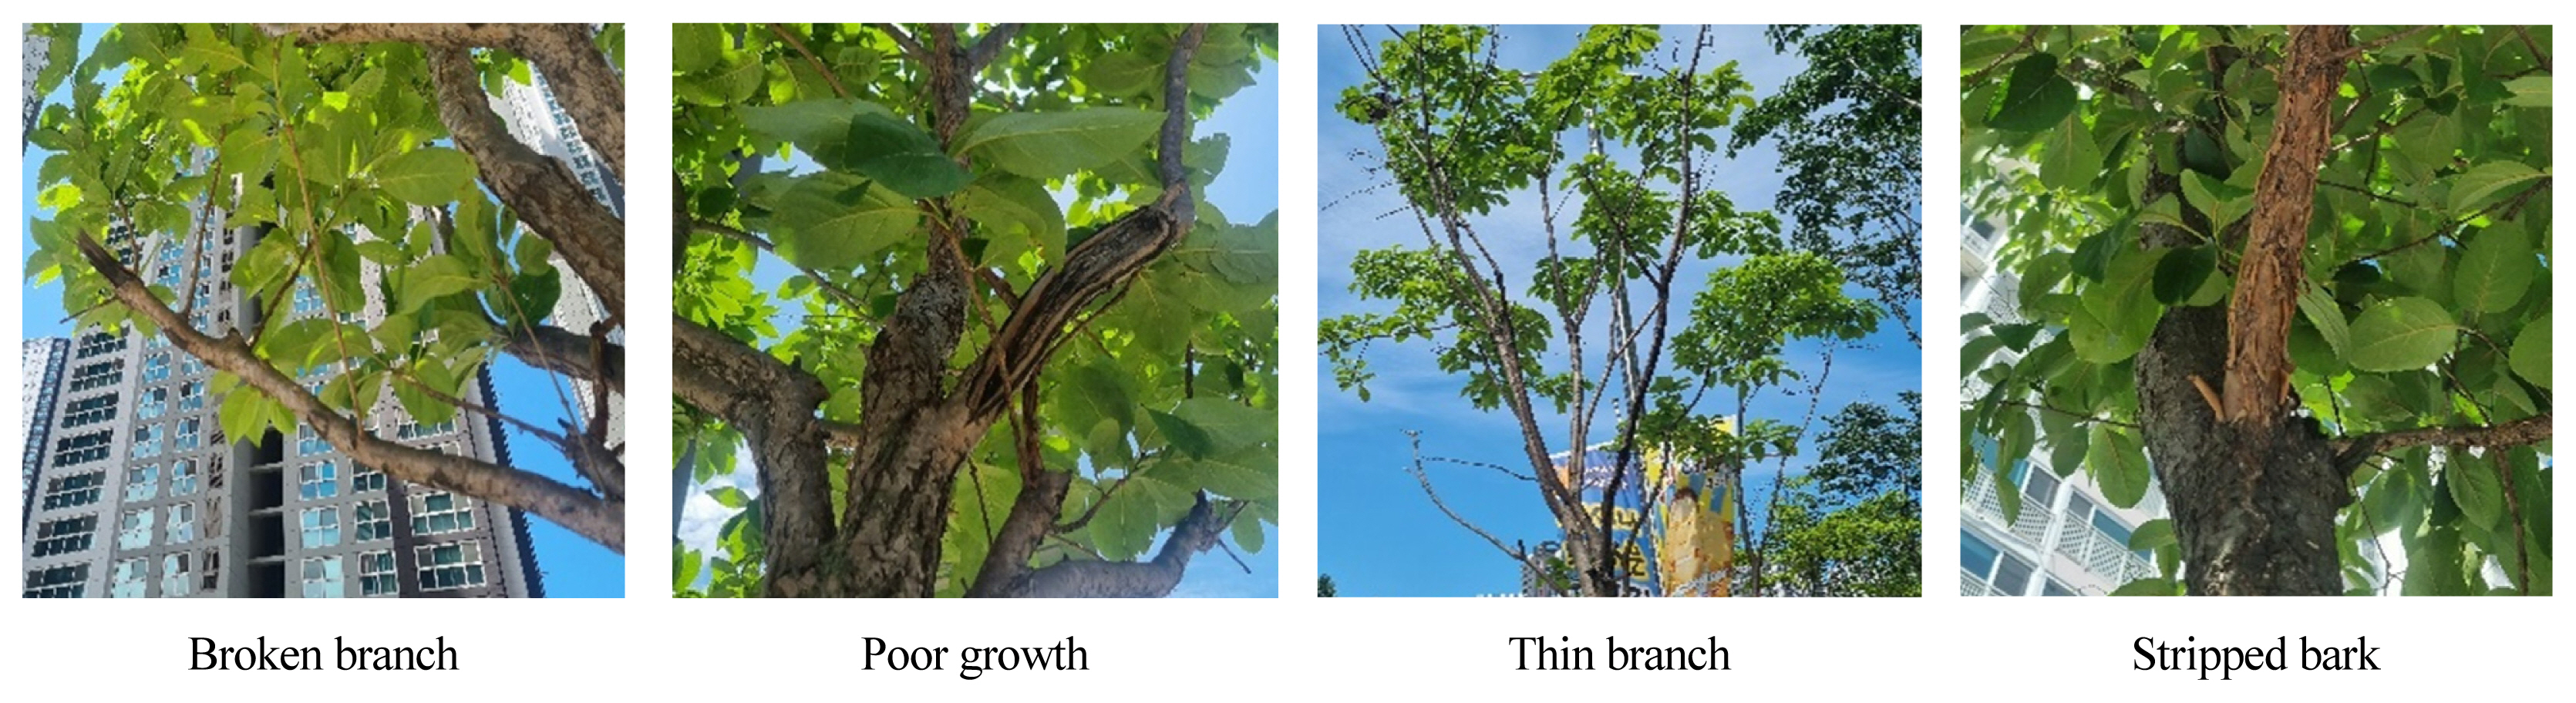
Visual health assessment of the branch.
Next, we checked and recorded whether there are pruning, pollarding, sign blocking, disease and pest, felled trees, piled objects, or broken branches in each individual plant, which were selected as tree management factors. Fig. 8 shows the examples of each of the tree management factors
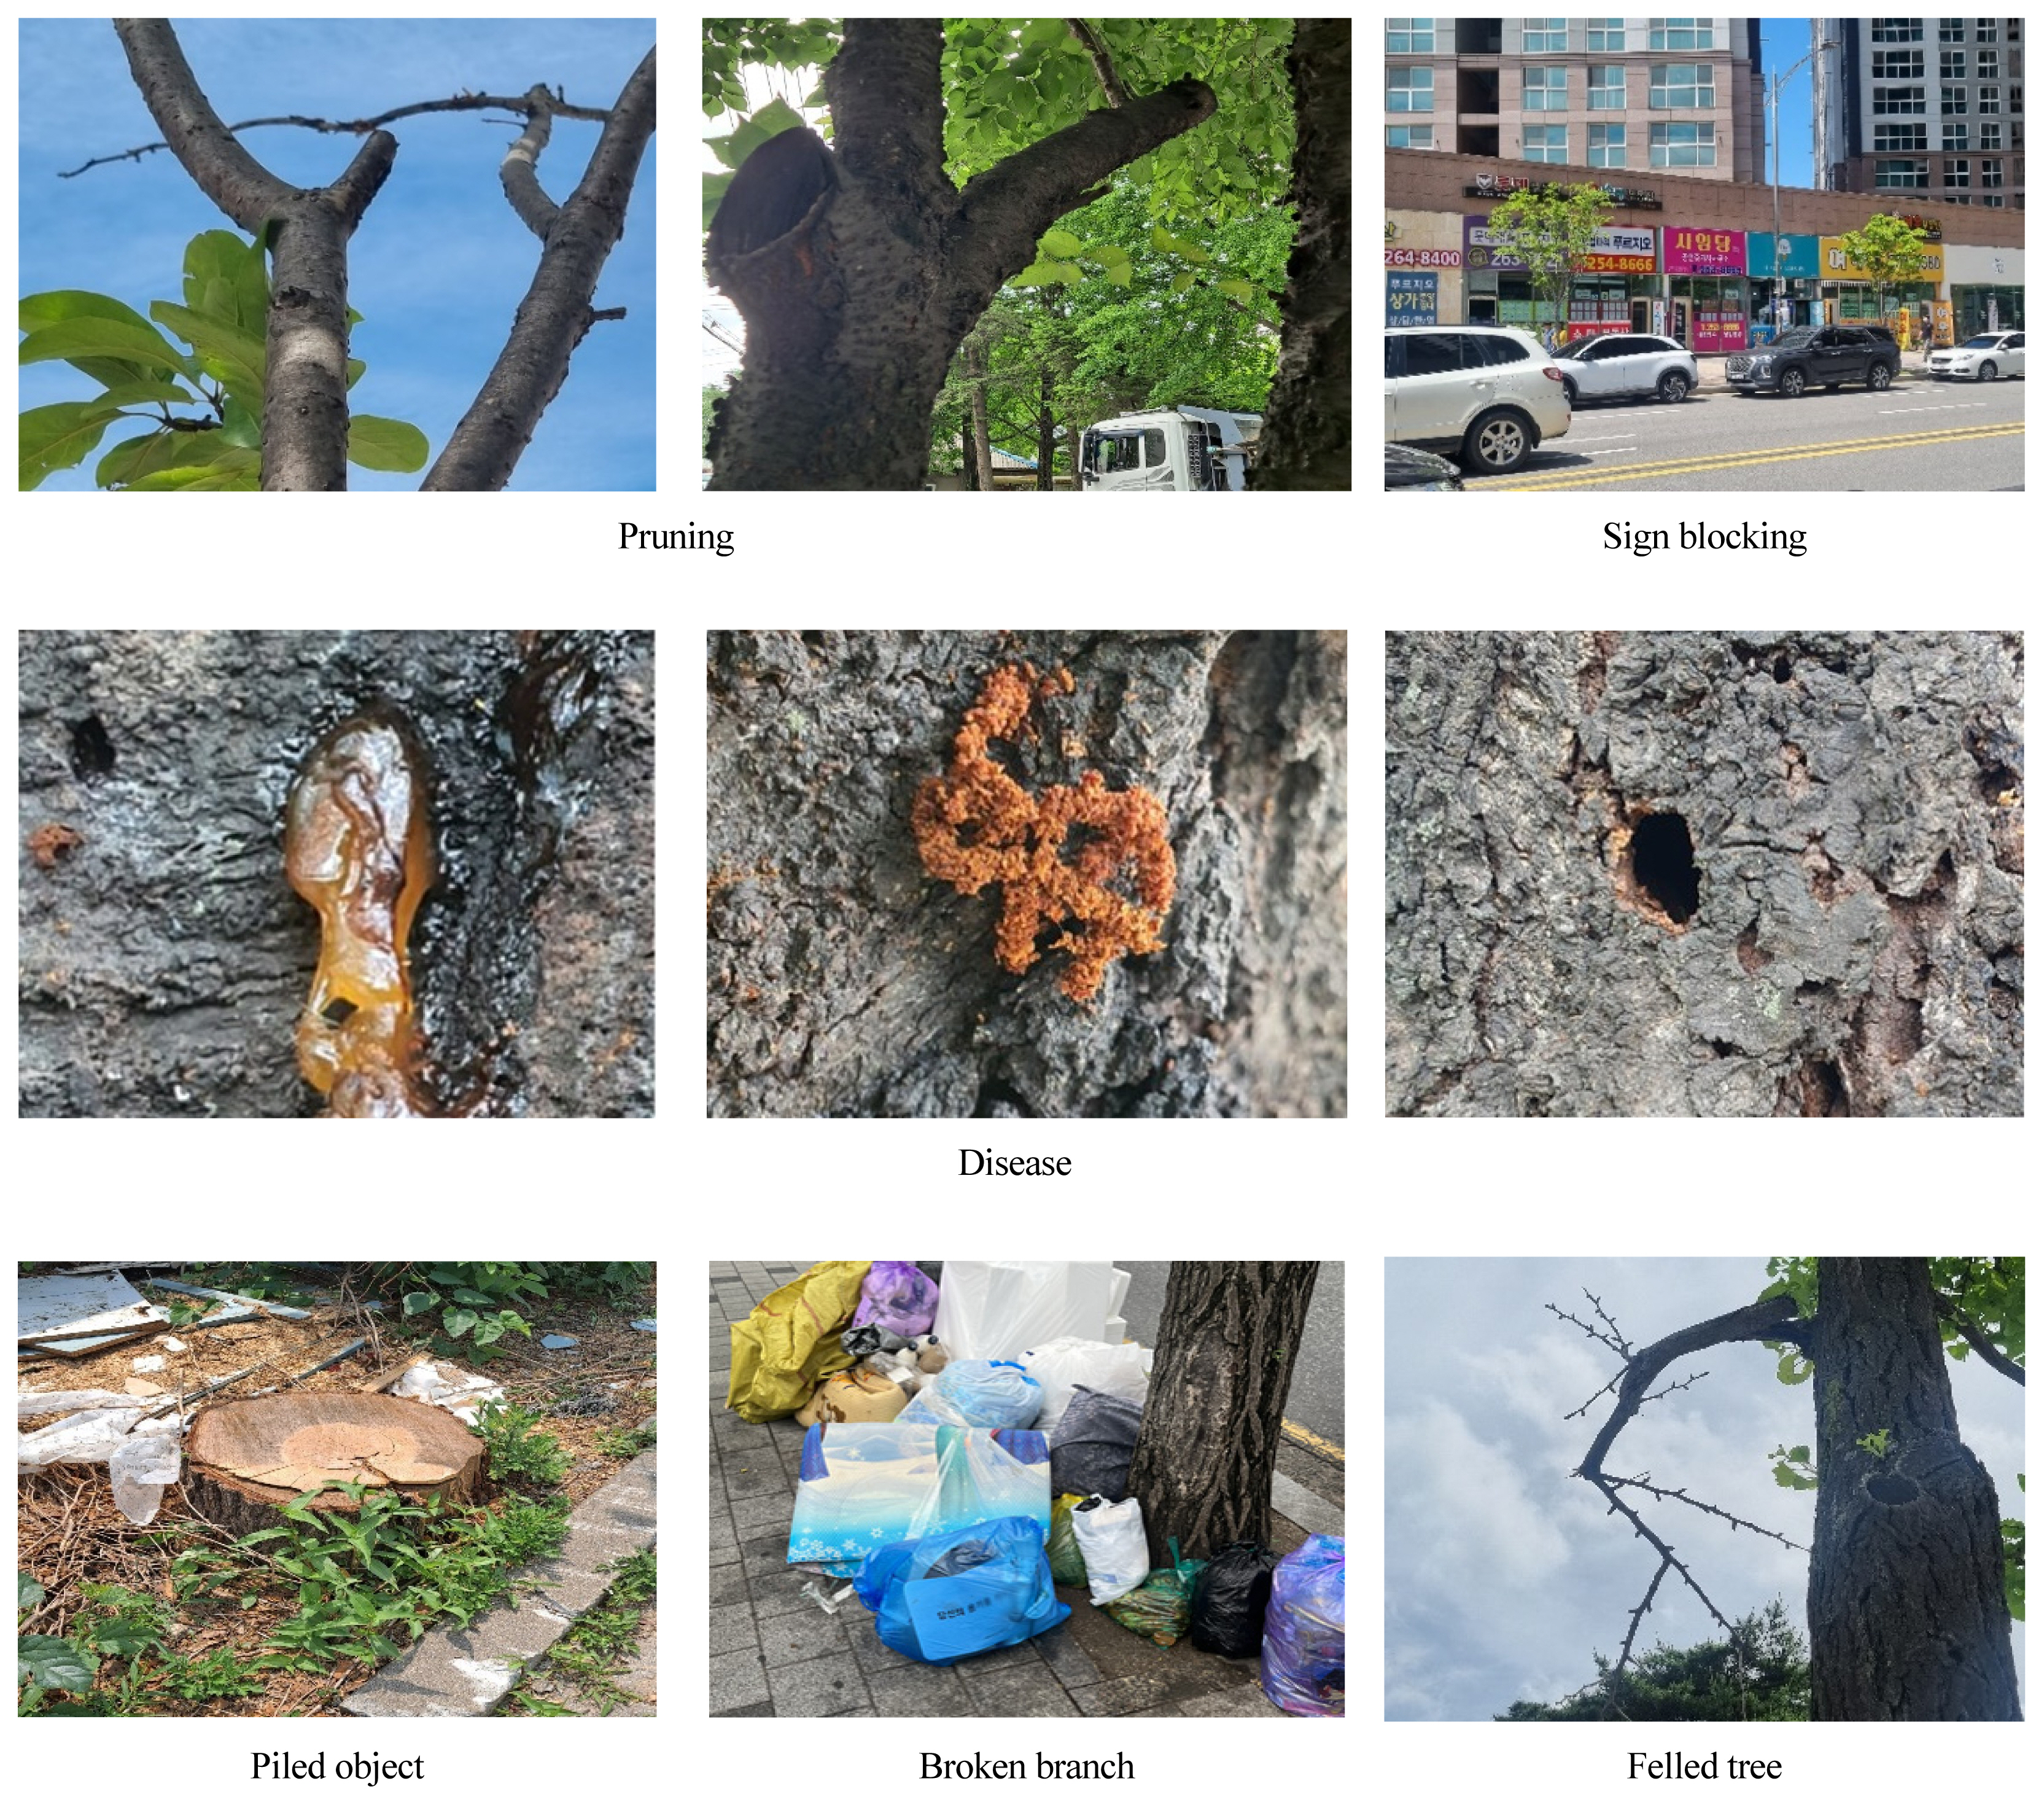
Tree management factors.
For data collection, we recruited 10 students that are from freshmen to seniors in the Department of Ecological Landscape Architecture Design at Kangwon National University. To minimize uncertainty that may occur in terms of data consistency due to subjective evaluation when multiple researchers collect data on street tree growth status and management factors, we conducted an orientation for an hour about data collection methods and evaluation criteria prior to the field survey. The participants were paired up into teams of two and conducted the field survey on approximately 40 trees in one section allocated to each team and collected data. The field notes and photographs from the field survey were put into a database (Fig. 9).

Field survey processes.
Data analysis
The collected data were analyzed using R Studio version 4.1.0 (Team, 2021). Growth data of individual trees were analyzed by summarizing the monitoring data for street trees collected through descriptive statistics. To compare by special-purpose area, we compared the visual health of leaves, trunks, and branches of one section in each of industrial area, green area, and residential area where Ginkgo biloba is planted among the street tree sections investigated to minimize the effect of tree species. To determine whether there are management factors such as pruning traces, sign blocking, disease and pest, felled trees, piled objects, and broken branches, we conducted a logistic regression analysis using the GLM function with binary data with values of 1 (yes) or 0 (no) (Hilbe, 2009). A logistic regression model is a type of generalized linear model and a technique used when the dependent variable is dichotomous in the regression analysis for predictive analysis (Tranmer & Elliot, 2008). The probability that the dependent variable will be 1 can be determined through the ratio of the probability that a random event will occur compared to the probability that a random event will not occur using the odds ratio, and the formula for the odds ratio of random event A is as shown in Equation (1) (Bland & Altman, 2000; Norton & Dowd, 2018). The coefficients of independent variables in the logistic regression model are indicated as log odds (equation 2).
Log odds can be positive or negative, and if the log odds calculated in the logistic regression model is positive, the event is more likely to occur, whereas if the log odds is negative, it is less likely to occur. In this study, we set the 6 street tree management factors as dependent variables and 4 special-purpose areas as independent variables and built total 6 logistics regression models. To apply the binary logistic regression model, we converted the nominal independent variables into binary dummy variables, after which we built a model to analyze whether there were street tree management factors selected as dependent variables. The statistical model was used to compare the probability of occurrence in each special-purpose area.
Results
Citizen science data monitoring results
As a result of conducting the field survey on total 8 street tree sections selected for each special-purpose area, information on total 283 street trees was collected. Table 3 and 4 show the monitoring results of the number of individuals, plant species, growth state, and visual health assessment of surveyed street trees in each special-purpose area.
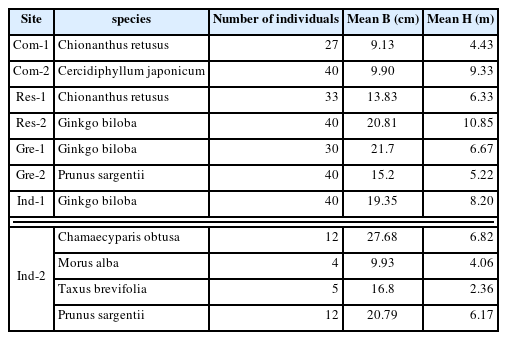
A summary of growth status of surveyed street trees

A summary for the visual health assessment of surveyed street trees
Fig. 10 shows the results of comparing the visual health of Ginkgo biloba, the common tree species investigated in the industrial area, green area, and residential area. As a result of comparing the visual health of 40, 30, and 38 Ginkgo biloba trees in the industrial area, green area, and residential area respectively, the visual health of leaves, trunks, and branches of all trees investigated in the green area was ‘fair’. In the industrial area and residential area, 27.5% and 5.3% of trees showed ‘poor’ visual health of trunks. Branches showing ‘poor’ and ‘fair’ visual health accounted for total 21% of the trees in the residential area. Overall, there was a difference in the visual health of trunks between the special-purpose areas.
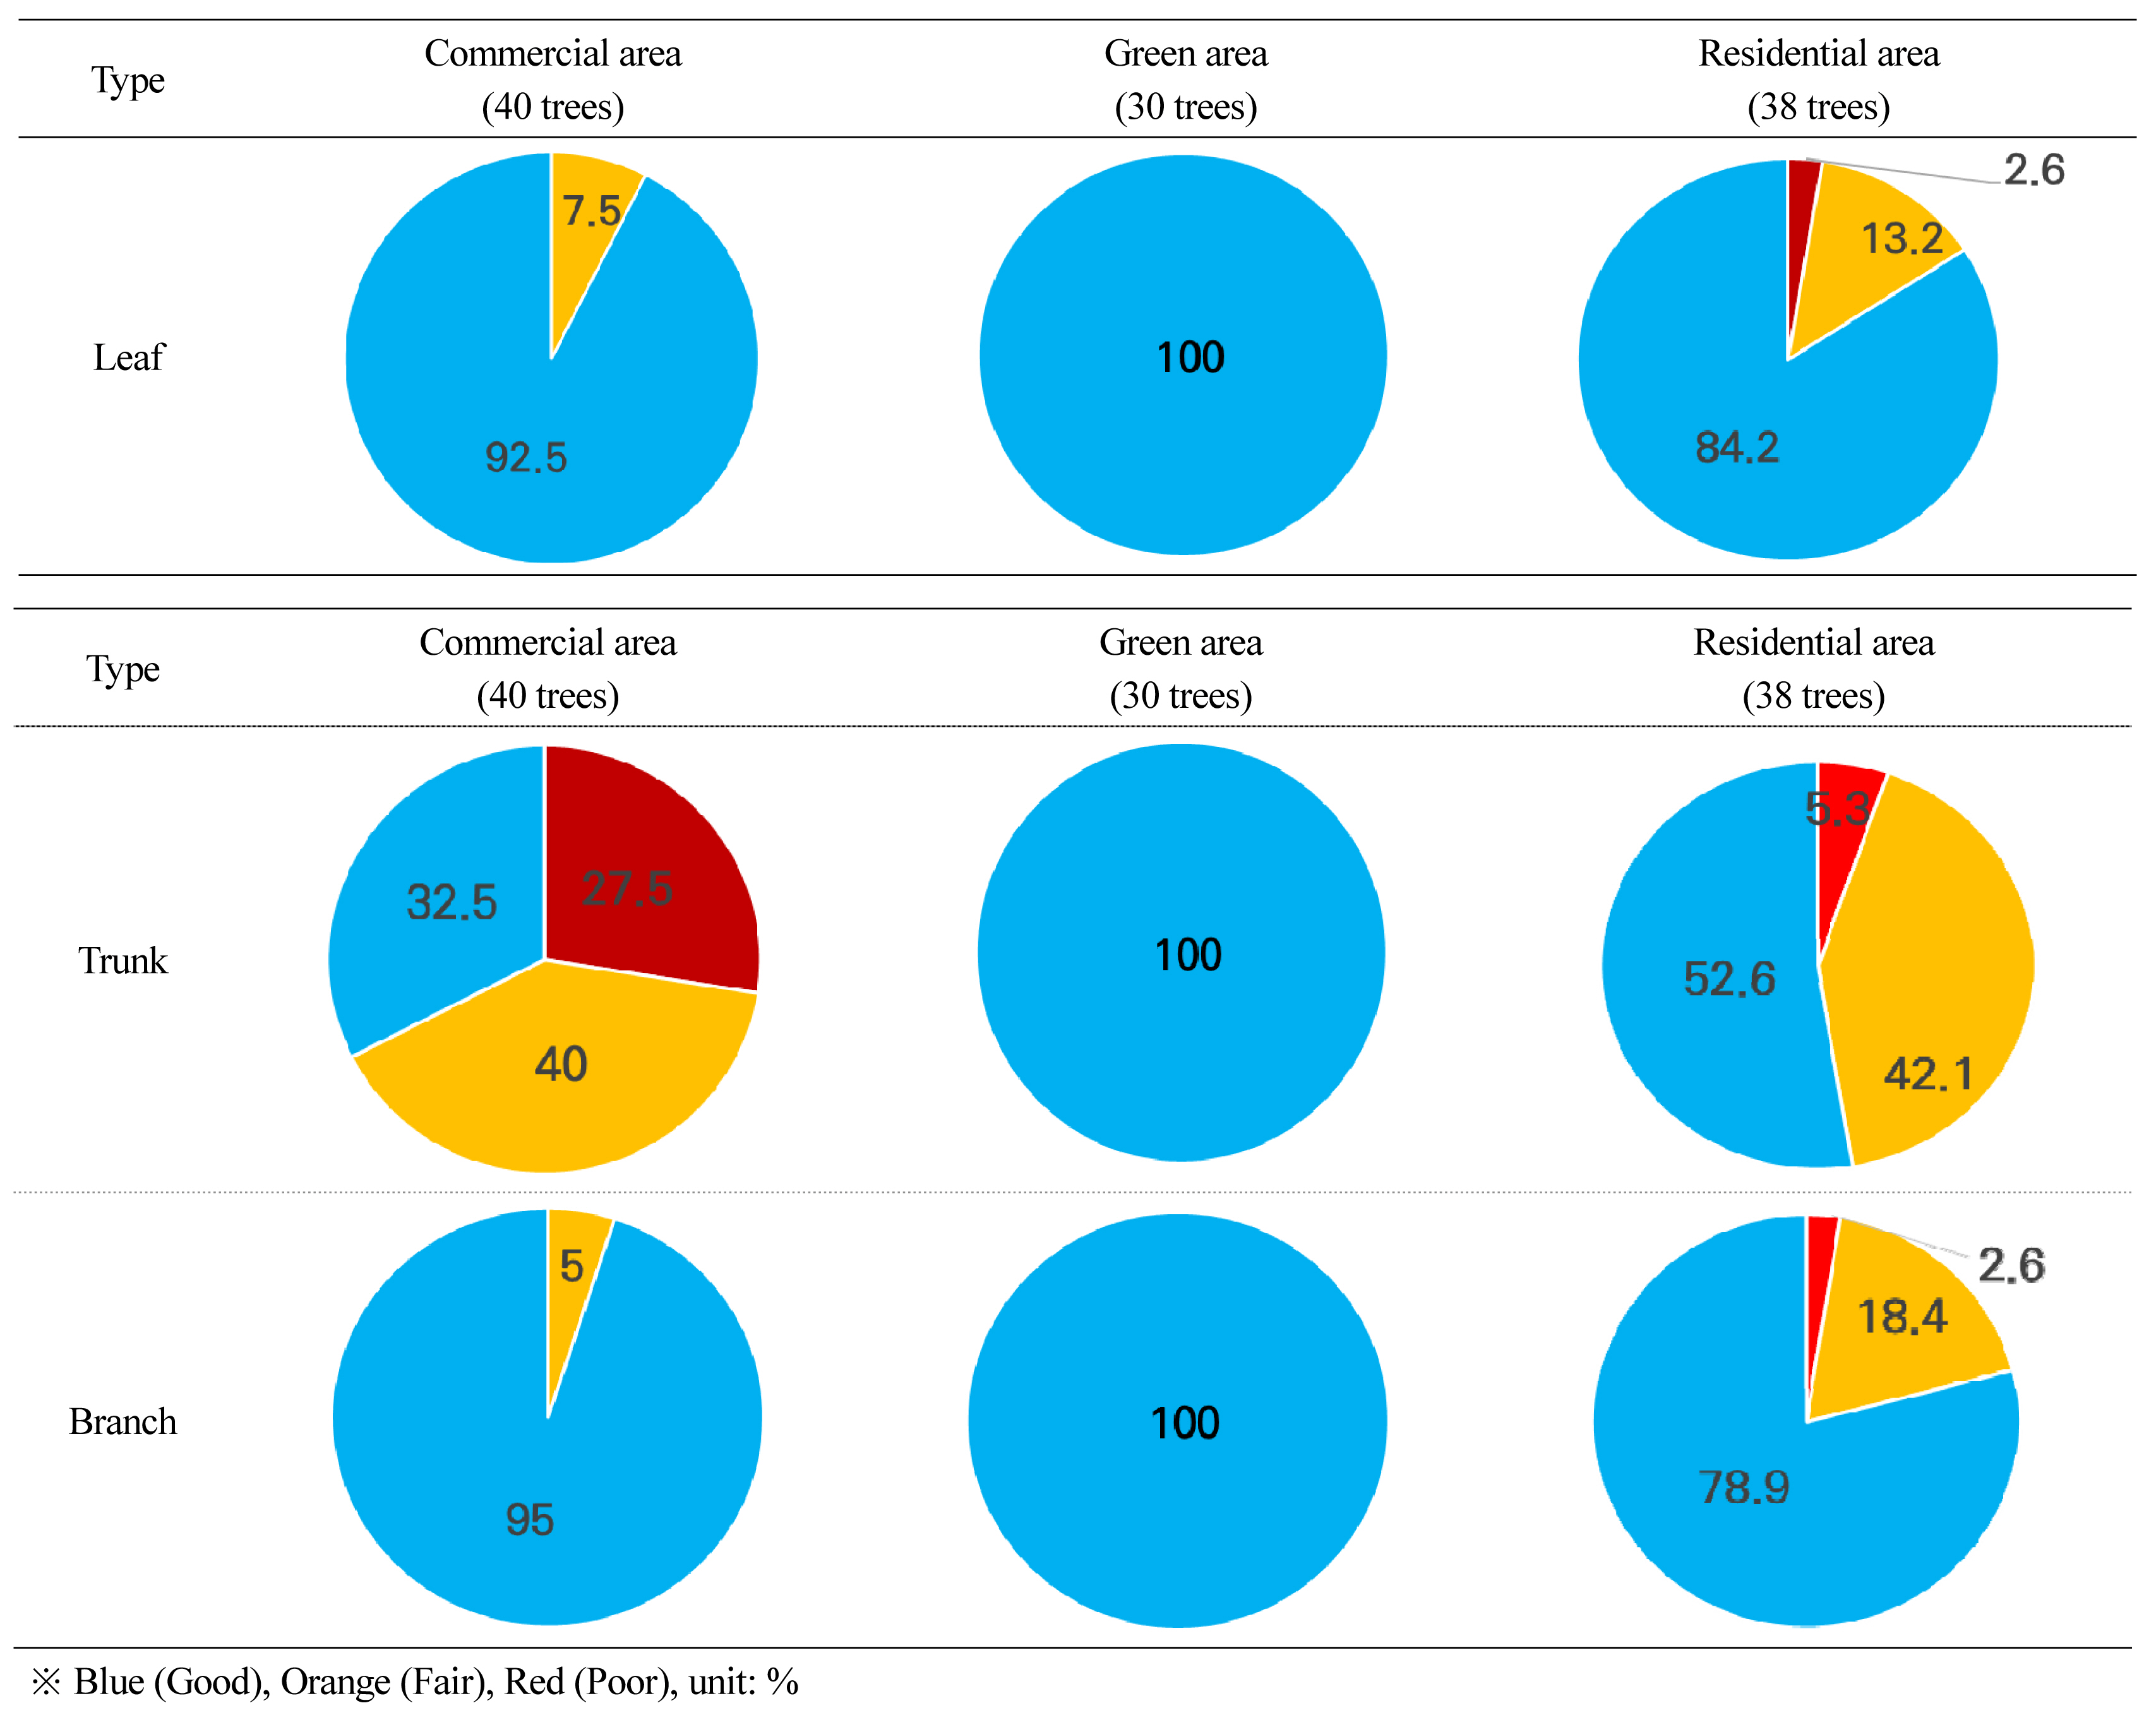
Result for the assessment of visual health condition in Ginkgo biloba by special-purpose area.
Statistical analysis results of management factors
Table 5 shows the results of individual records for the 6 items selected as management factors from the street tree monitoring results by special-purpose area. In the commercial area, sign blocking and pruning traces occurred with a high probability, and other items also appeared to have a higher probability of occurrence than other special-purpose areas. In the residential area, pruning traces, sign blocking, and disease and pest showed a high probability, and in the green area, pruning traces and disease and pest showed a high probability. Out of 40 Prunus sargentii trees planted in Green Area 2, traces of diseases and pests were found in 28 trees (70%). In the industrial area, pruning traces were found in more than 80% of the trees in both sections, and street trees with branches left broken were found with a relatively high probability.

A summary of probability of occurrence for management factors by site and species
Table 6 shows the results of analyzing the log odds of special-purpose areas where each management factor has a significant effect on the event that occurred through the binary logistic regression model. As a result of building a model for pruning traces, there was a statistically significant correlation between the industrial area and the occurrence of pruning traces (Coefficient = 1.798, p < .01). Sign blocking (Coefficient = 1.058, p < .01) and piled objects (Coefficient = 2.295, p < .01) in the commercial area also showed a statistically significant correlation. In addition, there was a significant correlation between the industrial area and broken branches (Coefficient = 2.480, p < .01). There was also a correlation between disease and pest and the green area (Coefficient = 5.785, p < .01), but the damage turned out to be diseases and pests recently spread on Prunus by foreign insects, and thus it is highly likely that a statistical bias may have occurred due to tree species rather than the impact of the special-purpose area. Regarding the occurrence of felled trees, special-purpose areas did not have a statistically significant effect.
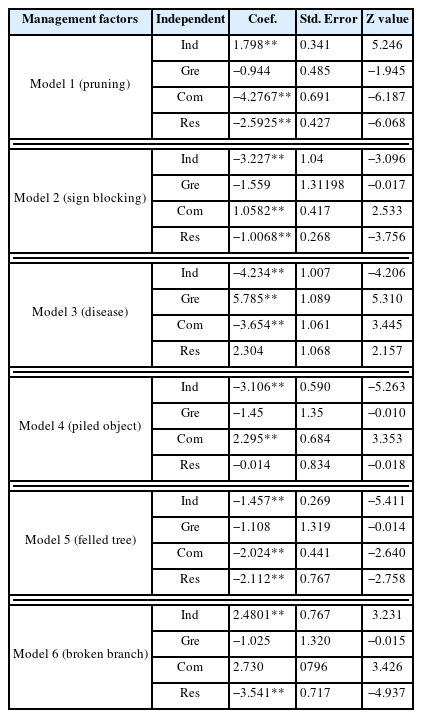
Model estimation results for each management factors
Discussion
This study confirmed that the probability that certain management factors may occur was statistically significant in the commercial and industrial areas. This result may be due to the differences that may occur according to the land use patterns in the special-purpose areas as well as major activities carried out in the areas. By identifying management factors that occur with high frequency in each special-purpose area, it would be possible to select species to plant, plan the management cycle, and prevent civil complaints.
In street trees planted in the commercial area, all 6 management factors were occurring, and the top three most frequently occurring factors were pruning traces, sign blocking, and piled objects, and the factors with statistical significance were sign blocking and piled objects. These results imply that commercial activities in the commercial area and the special management factors become more likely to occur. In particular, garbage bags piled under street trees and information signs were commonly found in the commercial area. Leaving piled objects like household waste under street trees cause substances such as salt from rain to be absorbed by the roots, which inhibits the growth of the trees. Thus, preventing these management factors in advance will help reduce the damages to tree growth.
Pruning traces and broken branches were found at a high frequency in the industrial area, showing statistical significance. In industrial areas where factories and manufacturing facilities are concentrated, there are frequent movements of large vehicles or machines, which may be the cause of broken branches. Moreover, in terms of management, industrial areas have a small floating population and productivity is valued more than the landscape of the surrounding environment, which is why street trees are managed relatively poorly. The by-products of street trees generated after pruning can be used as woodchips, sawdust, and compost resources by recycling and processing them, but there is currently no system for managing, using, and processing the by-products from pruning the street trees and thus the resources are not being used efficiently. The results of the difference in the occurrence of pruning traces between special-purpose areas observed in this study are expected to be used as basic data to efficiently track the process of handling the by-products from pruning the street trees and establish a management system. Furthermore, the results can also be used to select tree species to plant within industrial areas to reduce physical damage to trees such as broken branches that may be caused by movement of large vehicles or machines.
Moreover, this study compared the visual health of Ginkgo biloba that is a tree species investigated in all of industrial, residential, and commercial areas. As a result of showing the ratio of good, fair, and poor visual health of leaves, trunks, and branches as shown in Fig. 10, the biggest difference was found in trunks between special-purpose areas. Chone et al. (2001) claimed that for grapevines, the trunk is the most distinctive indicator of drought stress. However, the effect on the growth of tree leaves, trunks, and branches may vary depending on the type of environmental stress (drought, ozone, high temperature stress, etc.) and stress defense mechanisms of each tree species (McCutchan & Shackel, 1992; Pääkkönen et al., 1998). For this reason, the results of this study have limitations in specifying the environmental factors that caused the differences in visual health of leaves, trunks, and branches between special-purpose areas. Therefore, it is necessary to conduct additional research on stress factors for each special-purpose area.
Conclusion
This study identified the distribution status of street tree sections by street tree management area in Chuncheon based in data collected by citizens themselves, compared the probability of occurrence of 6 street tree management factors in each special-purpose area, and statistically analyzed the effect of special-purpose areas on the occurrence of street tree management factors through a binary logistic regression model. Based on the results, this study raises the need for strategies to prioritize street tree management and efficiently manage street trees by considering the differences in special-purpose areas within limited budget and manpower.
However, this study has limitations in that it analyzed the downtown areas with high population density and examined only two sections in each special-purpose area. Thus, the results of this study are limited to the downtown areas of Chuncheon, and additional analysis including more sections and individual trees is needed in order to generalize the probability of occurrence of the street tree management factors in each special-purpose area of Chuncheon and to obtain representativeness of the results. Furthermore, this study is also limited in that it failed to consider the effect of tree species on the probability of occurrence of street tree management factors. This study focused on the probability of occurrence of street tree management factors by special-purpose area, but street tree species can be a key factor that affects the growth and development of street trees such as disease and pests, which is why it is necessary to consider tree species in further research.
Finally, one thing to note from the study results is the potential for the usability of citizen science data. Students who participated in data collection contributed with active interest in the research project, and the researchers could derive street tree management strategies based on the collected data. This implies the clear potential for the usability of citizen science data. In 2021, Seoul benchmarked the 2015–2016 Street Tree Census in New York City and created the first citizen-led street tree map in South Korea. The start of this citizen-led street tree management project in South Korea is expected to have a positive effect on environmental protection and street tree management in various fields, such as building street tree data to protect the environment and street trees, activating volunteer programs, and raising civic consciousness. To promote citizen participation for street tree management and encourage citizens to more actively use the collected data, it is necessary to establish a management system such as standard monitoring methods, data sharing platforms, and management plans to be used in data collection, management, and analysis. Furthermore, measures must be established to ensure the quality of massive street tree data collected by volunteers. This will not only allow citizens to more effectively use the street tree data collected but also ensure data accuracy and reliability, thereby increasing the applicability of data in various fields such as academic research.