Structural Equation Modeling Analysis of Factors Affecting the Loyalty of Forest Trail Users
Article information

Abstract
Background and objective
With the increasing public awareness of health due to COVID-19 and the quality of life, people have come to prefer natural spaces with fewer crowds. Public use of forest trails is increasing as a place that satisfies the demand for such natural spaces. As a result, the basic plans for trails and mountaineering support were established, and there has been government-level support such as the establishment of the Korea Mountaineering Support Center, which resulted in a quantitative and qualitative increase in the use of forest trails. Accordingly, efforts must be made to ensure satisfaction and loyalty in using forest trails.
Methods
Therefore, this study identified the factors affecting the overall satisfaction and loyalty toward forest trails through structural equation modeling. As for the research data, we used data from the Fact-finding Survey on Forest Welfare Facility Users to analyze the use of forest trails.
Results
As a result, safety and comfort, kindness, travel time, and program experience variety had a significant effect directly and indirectly on overall satisfaction and loyalty. Safety and comfort affected personal activity experience variety, while kindness affected program experience variety. For travel time, the direct effect on loyalty showed a positive correlation, but the indirect effect showed a negative correlation.
Conclusion
These results showed that safety should be considered a top priority on forest trails, and that long travel time to forest trails could be a factor that increases loyalty by offering various programs. In addition, loyalty has a multifaceted correlation between several factors, suggesting that it is necessary to consider not only direct effects but also indirect effects.
Introduction
Recently, there has been increasing public interest in enjoying the natural environment and promoting health through forest trails. With this growing public interest in hiking culture, the Forestry Culture and Recreation Act was amended in 2011, through which forest trails are defined as paths formed in forests for activities such as mountain climbing, trekking, leisure sports, exploration, or relaxation and healing, which was intended to prepare for diverse public interests in forest trails as well as an increase in usage. Accordingly, basic plans for forest trails to systematically create, operate, and manage forest trails and basic plans for mountaineering support to meet the demands for quantitative increase and conservation of forest facilities were established. Moreover, Korea Mountaineering Support Center was designated as a public institution in February 2020 to spread a healthy culture of mountain climbing and support mountaineering activities of citizens based on the basic plans for mountaineering support. In 2021, forest trails with high historical and cultural value have been designated as national forest trails, satisfying the public interest.
According to the ‘2022 National Leisure Activity Survey’ conducted by the Ministry of Culture, Sports and Tourism, mountains (11.4%) was ranked 6th most popular out of 70 leisure spaces that people want to use most, and strolling and walking (43.%) was ranked 2nd for the leisure activity in which they participated most (sum of 1st through 3rd) (Ministry of Culture, Sports and Tourism, 2022). This shows that there has been an increasing interest in forest trails, with people perceiving forest trails as a place where they can enjoy leisure safely, away from the crowds and the risk of COVID-19 (Kim and Lee, 2021; Chang et al., 2021).
There is a need for a qualitative increase along with the quantitative increase in the use of forest trails. Through the ‘2nd Basic Plan for the Creation and Management of Forest Trails (Korea Forest Service, 2022)’, Korea Forest Service is promoting expansion of forest trail services by improving the quality of forest trails through functional improvement, providing high-quality forest trail services, and developing forest trail tourism programs to promote use of forest trails. The ‘Manual for the Creation, Operation, and Management of Forest Trails’ (Korea Forest Service, 2022)’ is providing policies for the creation, methods, operation, and management of forest trails to improve safety and quality of forest trails. Moreover, Korea Mountaineering Support Center seeks to improve the quality of forest trails by offering forest trail programs such as forest trail walking expeditions and experience programs.
Improving services and programs for better quality of forest trails leads to satisfaction and loyalty toward forest trails. In fact, managers of tourist spots such as forest trails focus on repeat visitors by increasing the attractiveness and loyalty of the tourist spots (Meleddu et al., 2015, Van Dyk et al., 2019). Accordingly, forest studies are conducted on satisfaction and loyalty. Han (2022) proposed a structural equation model to examine the determinants of satisfaction and loyalty of users of centers for forest activities, and Koo et al. (2015) analyzed satisfaction and loyalty according to service quality in mountain horseback riding activities. Hong et al. (2010) analyzed the relationship between satisfaction and revisit depending the value perceived by arboretum users and suggested a strategy for arboretum management. There has been continuous research on satisfaction and loyalty regarding forests, but there is insufficient research on forest trails, and thus there is a need for a multifaceted analysis.
Therefore, with reference to previous studies, this study selected service satisfaction and travel time of users visiting forest trails as independent variables, personal activity experience variety and program experience variety as mediating variables, and overall satisfaction and loyalty as dependent variables, and designed structural equation modeling (SEM) for a multifaceted analysis. This study intends to examine the factors affecting loyalty and satisfaction and the relationship between them through the structural equation model.
Research Methods
Research subjects and data
Data from the ‘2022 Fact-finding Survey on Forest Welfare Facility Users’ conducted by Korea Forest Welfare Institute were used to analyze the effects on and relationship between overall satisfaction and loyalty of forest trail users. The fact-finding survey was conducted to comprehensively identify and analyze the status of public use of forest welfare services according to Article 6 of the Forest Welfare Promotion Act and Article 6 of the Enforcement Decree of the same Act. The survey was conducted on users who visited forest welfare facilities for approximately 3 months from August to October 2022 by trained inspectors using a structured questionnaire on site. This study selected only 292 respondents who used forest trails in 9 facilities as the subjects, and conducted analysis on 279 respondents except 13 of them with missing values or insincere responses. For demographic characteristics, their gender, age, marital status, child status, and average monthly household income were surveyed (Table 1). For facility use characteristics, their service satisfaction, travel time, personal activity experience variety, program experience variety, overall satisfaction, and loyalty were examined (Table 2). The variables included in service satisfaction, overall satisfaction, and loyalty were all rated on a 11-point Likert scale from 0 to 10 points. Service satisfaction was designed in 20 items based on the PCSI (Public-service Customer Satisfaction Index), but total 14 items were selected for analysis after eliminating 6 items (parking facilities, entrance fee, souvenirs, handling complaints, public transportation, experiential activities) showing low response rates as the relevant services were not experienced. For travel time, the respondents were to write their own responses. For personal activity experience variety and program experience variety, the respondents were to choose from multiple choices about forest trail activities, enjoying natural scenery, forest bathing, picnics, forest life experience, forest exercises, observing and learning about plants and animals, visiting tourist attractions, and others, after which the total score for the activities was used.

Demographic characteristics

Facility use characteristics
Research model
This study established a research model with reference to previous studies to identify the factors affecting overall satisfaction and loyalty of forest trail users and determine the path and mediation effect.
Previous studies confirmed that satisfaction and loyalty toward tourist facilities and forest welfare were affected by service satisfaction in the facilities. In a study comparing the characteristics of using recreational forests and arboretum, Yoo et al. (2020) confirmed that service satisfaction has a positive correlation with overall satisfaction and loyalty. Sim and Lee (2010) and Kim and Jeong (2017) discovered that festival experiences and services affect visitor satisfaction and loyalty. A study analyzing the impact of service quality at social welfare facilities on revisit also formed a significant positive correlation between social welfare service quality, facility satisfaction, and user loyalty (Yun, 2021). The PCSI used in this study was developed to overcome the limitations of the existing customer satisfaction indices by reflecting the specificity of public institutions. The existing customer satisfaction indices such as the ACSI/NCSI mostly take approaches only in terms of perceived customer satisfaction. The KCSI uses repurchase intention, which is a concept of loyalty, in calculating the satisfaction index, which leads to an ambiguous relationship between variables. The KS-SQI and SSI are designed to calculate the service quality index instead of customer satisfaction index. Lee and YI (2012) made up for the deficiencies of previous customer satisfaction indices and developed the PCSI, a customer satisfaction index specialized for public institutions. Chae et al. (2023) used the PCSI to analyze factors affecting service quality satisfaction of visitors in forest welfare facilities, and Jeon et al. (2023) analyzed satisfaction in education to derive points to improve in forest education, which shows that the PCSI is used in forest studies to measure customer satisfaction. Service is the first and closest factor perceived by users in a facility. Therefore, it is important to clearly identify and implement the relationship with service satisfaction to increase satisfaction and loyalty in facilities such as forest trails.
In addition to service satisfaction, accessibility such as travel time is also one of the major determinants of overall satisfaction and loyalty. Accessibility is a tourist destination choice attribute that gives tourists a positive tourist attitude toward destinations (Kim, 2020), and a study on ways to improve forest trail management confirmed that accessibility affects facility satisfaction (Oh et al., 2018). Moreover, accessibility also turned out to be a factor for revisiting tourist destinations along with hygiene, accommodation, price, and service (Park et al., 2021). As such, accessibility to facilities is a fundamental factor that affects satisfaction and loyalty along with service. Therefore, in the model of this study, we selected service satisfaction and travel time as accessibility as independent variables.
We selected personal activity experience variety and program experience variety as mediating variables connecting dependent variables such as overall satisfaction and loyalty and independent variables such as service satisfaction and travel time. Personal activity experience variety refers to the number of activities experienced by an individual without being accompanied by an expert in the forest trail, and program experience variety refers to the number of programs experienced while being accompanied by an expert. In tourism, experience tourism is defined as tourism activities directly experienced with the body, and experiential activities categorized into creativity, playfulness, aesthetics, and deviance are all reported to have a significant effect on satisfaction (Han and Ryu, 2020). Han (2022) performed structural equation modeling to analyze the determinants of satisfaction and loyalty of users in centers for forest activities. The results showed that satisfaction affects loyalty, and user satisfaction increased according to understandability, usefulness, and expertise of the educational program. Moreover, Lee et al. (2016) confirmed that longer usage time of the forest healing program conducted in the healing forest leads to higher satisfaction.
Loyalty used as a dependent variable is a variable about actual behavior, not a psychological variable such as satisfaction toward the facility. Loyalty is defined as the intention to repurchase and continuously use the preferred products and services (Oliver, 1999). Research on the concept of loyalty began in marketing (Cornin and Taylor, 1992; Lee and Yoon, 2004) and has led to tourism (Byun and Choi, 2007; Park et al., 2014). However, it is not sufficiently used in forest studies. In marketing and tourism, the relationship between satisfaction and loyalty is accepted almost as an established theory based on many previous studies (Anderson and Srinivasan, 2003), and there is on-going research in the field. Thus, forest studies must also confirm the relationship between forest welfare facilities and users by proving this relationship.
A structural equation model was established based on these studies (Fig. 1). We intend to identify the impact in each relationship by selecting service satisfaction and travel time as independent variables, personal activity experience variety and program experience variety as mediating variables, and overall satisfaction and loyalty as dependent variables.
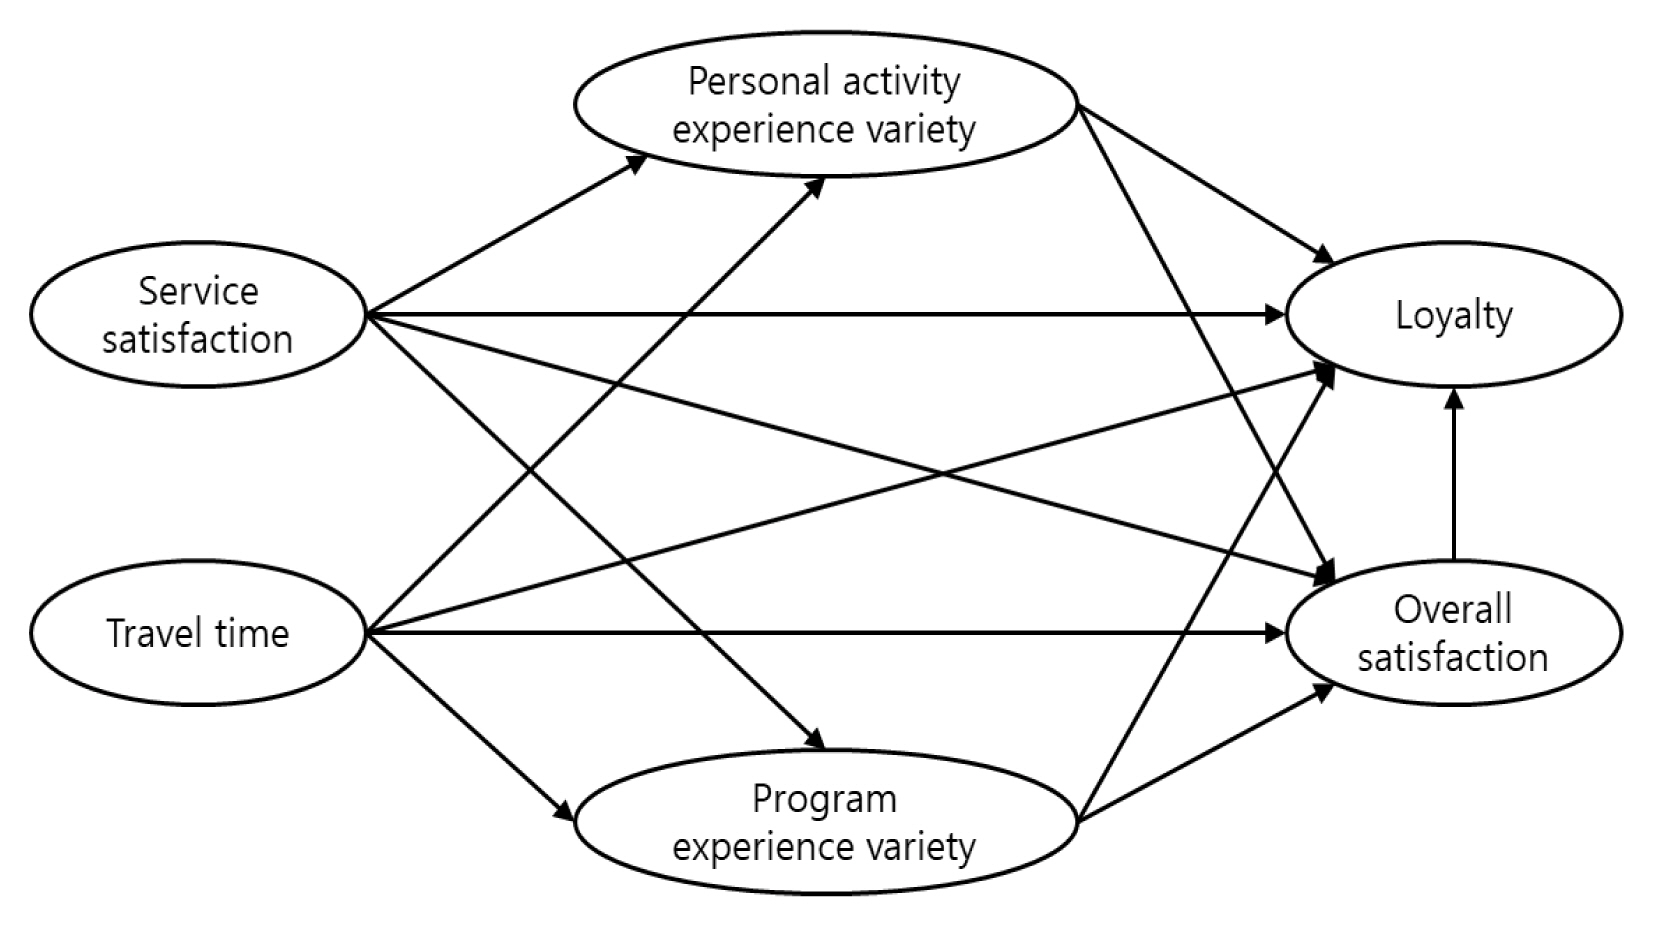
Research model.
Analysis methods and tools
Structural equation analysis was conducted to analyze the research model established based on previous studies. Structural equation modeling is widely used in various fields due to its advantages of being able to handle latent variables and analyze direct relationships between multiple variables through path analysis and indirect relationships through mediation analysis. Structural equation modeling consists of a measurement model to measure latent variables and a structural model to analyze the cause and effect of latent variables. First, we analyzed the measurement model based on latent variables revealed through exploratory factor analysis (EFA). We used confirmatory factor analysis (CFA) to assess the measurement model. In confirmatory factor analysis, we analyzed unidimensionality, reliability, and validity. Unidimensionality is when the observed variable measures only one latent variable, and factor loadings were analyzed to confirm this. Reliability confirms whether the measurement scale accurate measures what it intends to measure, and it was confirmed using Cronbach’s alpha coefficient. Finally, validity is to confirm whether the measurement scale faithfully measures what it intends to measure, and it can be classified into convergent validity and discriminant validity. Convergent validity was analyzed using average variance extracted (AVE) and composite reliability (CR), and discriminant validity was analyzed through the relationship between the correlation coefficient between latent variables and the square root of the AVE.
In the structural model analysis, we analyzed absolute fit, incremental fit, and parsimonious fit to analyze the goodness-of-fit of the structural model, and analyzed the relationship between latent variables through path analysis and mediation analysis. We used bootstrapping for mediation analysis (Kwahk, 2019).
Results
Descriptive statistics
The means and standard deviations (SD) of variables included in the structural equation modeling are as follows (Table 3). For service satisfaction, the forest trail consistent the purpose of the visit (8.48), facilities and services guidance (8.47), and kindness of the staff such as information centers (8.41) showed high satisfaction, as well as high overall satisfaction (7.95) and loyalty (7.82). The mean of travel time was 1.33 hours, the mean of personal activity experience variety was 3.91, and the mean of program experience variety was 0.52.

Descriptive statistics of facility usage
Testing the measurement model
To test the measurement model, we conducted exploratory factor analysis and confirmatory factor analysis. We eliminated 1 measurement variable (accessibility of trails) in which communality did not exceed 0.5 in exploratory factor analysis and 6 measurement variables (various activities are possible in the trails, the forest trail consistent the purpose of the visit, convenient for the elderly and the weak, sufficient tourist resources around the trails, excellent natural scenery of trails, and natural environment management status in trails) in which factor loadings did not exceed 0.7 or did not fit the model to ensure unidimensionality in confirmatory factor analysis. After excluding total 7 measurement variables, there were total 7 items for service satisfaction, classified into 2 factors: kindness, and safety and comfort. The results of analyzing the two factors of service satisfaction such as kindness and safety and comfort as well as loyalty showed that all exceeded 0.7 (Table 4).

Unidimensionality and reliability test
We presented convergent validity and discriminant validity to confirm the construct validity of the measurement model. We confirmed the AVE and CR to test the convergent validity (Table 5). Convergent validity is confirmed when the AVE is greater than 0.5 and the CR is greater than 0.7, and the research model in this study meets all criteria. Discriminant validity is confirmed when the correlation coefficient between latent variables is smaller than the square root of the AVE (Hair et al., 2010). In this study, the correlation coefficient between all latent variables was smaller than the square root of the AVE, thereby ensuring validity. The final model revised through the testing of the measurement model is as shown in Fig. 2.

Convergent validity and discriminant validity test (bold text marked with * represents the square root value of AVE)

Diagram of final model.
Model fit analysis in structural equation modeling
The fit of the structural equation model was tested by absolute fit indices GFI (Goodness of Fit Index) and RMSEA (Root Mean Square Error of Approximation), incremental fit indices TLI (Turker-Lewis Index) and CFI (Comparative Fit Index), and parsimonious fit index x2/df (Table 6). Absolute fit indices measure the difference between observed data and data predicted by the model, and the model is considered fit when GFI is greater than 0.9 and RMSEA is within the range of 0.05 – 0.08 (Browne and Cudeck, 1993). Incremental fit indices improve the model fit by variables, and the model is considered fit when TLI and CFI are greater than 0.9 (Bentler and Bonett, 1980; Bentler, 1990). Parsimonious fit indices assess the fit considering the complexity of the model, and the model is considered fit when x2/df does not exceed 3.0. The fit indices of the structural equation model in this study all met the criteria, thereby proving that the model is fit.

Goodness-of-fit measure
Structural equation modeling and path analysis
The path coefficients of the research model through structural equation modeling are as follows (Fig. 3, Table 7). In personal activity experience variety, safety and comfort seemed to have an effect. In program experience variety, kindness and travel time had an effect. In overall satisfaction, program experience variety, kindness, and safety and comfort had significance. In loyalty, kindness, safety and comfort, travel time, and overall satisfaction had significance. Travel time showed a negative correlation with loyalty.
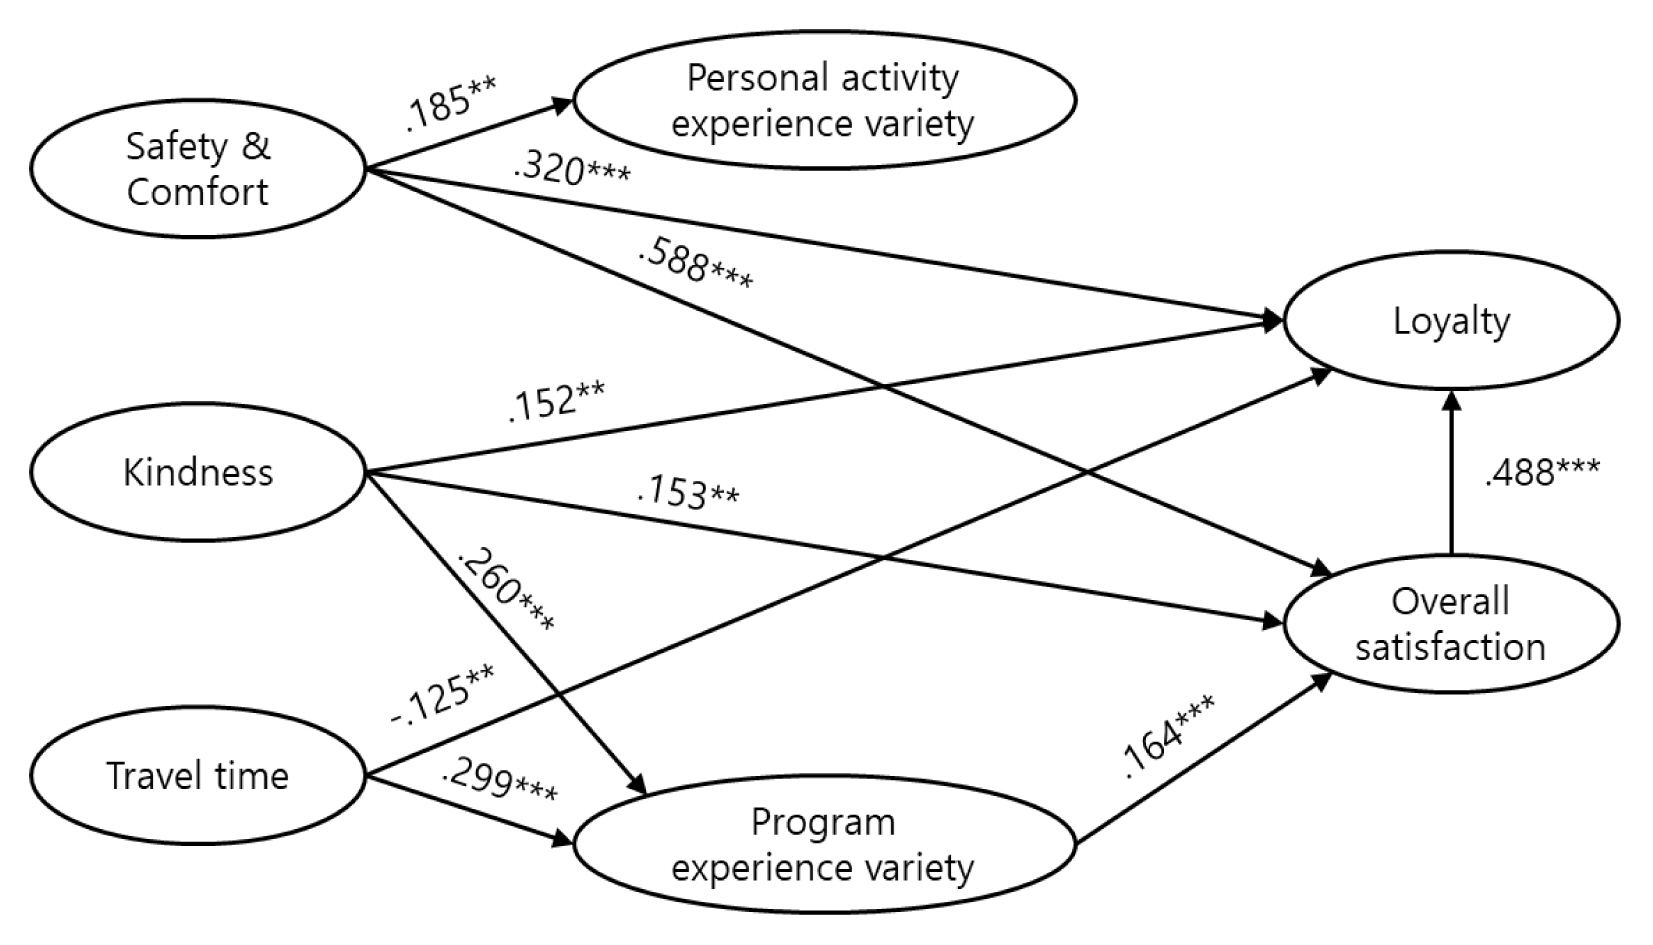
Diagram of path analysis result (mark only paths that indicate significance).

Path analysis result
Mediation effect analysis
We examined the direct effects between variables through the path analysis before and identified the indirect effects through mediation effect analysis. Bootstrapping was used to test the mediation effect (Table 8). The results showed that safety and comfort and program experience variety had an indirect effect on loyalty through overall satisfaction. Travel time had an indirect effect on overall satisfaction through program experience variety. Moreover, travel time also had an effect on loyalty through program experience variety and overall satisfaction.

Mediation effect analysis results (mark only paths that indicate significance)
Discussion
Forest trails are receiving legal and policy support with the growing public interest. People are taking walks in the mountains as a leisure activity to avoid COVID-19, and the government is providing support for forest trails by establishing the basic plans for forest trails, publishing the Manual for the Creation, Operation, and Management of Forest Trails, and launching the Korea Mountaineering Support Center. With such public interest and policy support for forest trails, it is necessary to understand the relationship between usage characteristics and user satisfaction and loyalty toward forest trails. Accordingly, this study developed a structural equation model by selecting kindness, safety and comfort, travel time, personal activity experience variety, program experience variety, overall satisfaction, and loyalty as variables to examine the factors affecting satisfaction and loyalty toward forest trails.
We intend to examine the results of path analysis with focus on the effect of independent variables on mediating and dependent variables. First, safety and comfort had a significant positive effect on personal activity experience variety, overall satisfaction, and loyalty. The importance of safety and comfort is revealed by a previous study (Chang et al., 2016) showing that users of forest welfare facilities perceive the importance of safety, such as ensuring safety and response manuals in emergency situations. Korea Tourism Organization (2020) emphasized the importance of safety by announcing that ’safety’ has become top priority in tourism activities through big data analysis. The results of this study also show that safety and comfort have the greatest impact on satisfaction and loyalty, showing the same results as previous studies. Next, kindness had a positive effect on program experience variety, overall satisfaction, and loyalty. This is consistent with previous research showing that kindness of the staff increases the intention to continue participating in programs (Park et al., 2015) and loyalty toward facilities (Han et al., 2018).
Safety and comfort and kindness both had a positive effect on overall satisfaction and loyalty, but safety and comfort had an effect only on personal activity experience variety, and kindness only on program experience variety. Safety and comfort affect the trust of users (Kim and Kim, 2015; Xu et al., 2018; Lee, 2021), indicating that personal activities without staff are increasing based on trust in the facilities. On the other hand, kindness generated interest in activities accompanied by staff, which resulted in experiencing relevant programs.
Next, travel time affected program experience variety and loyalty. In the relationship with loyalty, shorter travel time led to higher loyalty, and in the relationship with program experience variety, longer travel time led to higher program experience variety. In the relationship with program experience variety, it seems that when a facility requires longer travel time and has lower accessibility, visitors experience a variety of programs to receive better quality services when they visit the facility. This result is consistent with previous research that shorter travel time leads to higher loyalty (Hyun and Kim, 2016).
The results of this study showed that travel time did not have a direct effect on overall satisfaction, but the indirect effect mediated by program experience variety showed a positive correlation. This result is contrary to previous studies (Oh et al., 2018; Acharya et al, 2023) revealing that shorter travel time leads to higher satisfaction. This difference may be due to the fact that, while many studies analyzed the direct correlation between travel time and satisfaction, this study revealed only an indirect correlation through program experience variety.
Travel time was proved to have a negative correlation with loyalty, but in the path of travel time-program experience variety-overall satisfaction-loyalty through the mediation effect, travel time and loyalty had a positive correlation. This result is similar to the relationship between travel time and overall satisfaction explained earlier. Like the relationship between travel time and overall satisfaction, providing services such as various programs that meet the purpose of visitors helps meet the overall satisfaction, thereby increasing loyalty. However, while the coefficient of the direct effect was −.125, that of the indirect effect was .020, which basically shows that the direct effect has a greater effect on loyalty, showing that the total effect had a negative correlation. This indicates that if facilities with poor physical accessibility do not provide a variety of programs, it will lead to a decline in loyalty.
Next, the results of examining personal activity experience variety and program experience variety are as follows. Personal activity experience variety did not have an effect on both overall satisfaction and loyalty, and program experience variety had a significant effect on overall satisfaction. Program experience variety also showed a significant correlation with loyalty through overall satisfaction. Moreover, program experience variety is a mediating variable with other variables and has a mediation effect on overall satisfaction and loyalty. The programs provided by forest welfare facilities were proved necessary for facility users through effectiveness verification (Korea Forest Welfare Institute, 2023), but there is insufficient research on the impact on loyalty toward the facilities. The results of this study confirmed that forest welfare programs affect the loyalty of facility users and proved the importance of programs in operating forest trails.
Conclusion
This study was conducted to analyze the correlation between service satisfaction of forest trail users (safety and comfort, kindness), travel time, activities on forest trails (personal activity experience variety, program experience variety), overall satisfaction, and loyalty through structural equation modeling. We used data from the ‘2022 Fact-finding Survey on Forest Welfare Facility Users’ for analysis, and for the research model, we selected safety and comfort, kindness, and travel time as independent variables, personal activity experience variety and program experience variety as mediating variables, and overall satisfaction and loyalty as dependent variables.
The following implications were derived in summary of the results of structural equation modeling. First, safety of forest trails is the top priority factor in forest trails by increasing personal activities of users based on trust in the facility and increasing overall satisfaction and loyalty toward the facility. The results of this study show an increase in personal activities and loyalty, which will lead to an overall increase in forest trail visitors.
Second, forest trails that are far from densely populated areas must offer a variety of programs. As shown in the results of this study, travel time is a factor that inhibits loyalty toward forest trails, but offering a variety of programs can increase overall satisfaction and loyalty. We must consider the phenomenon of longer travel time due to long distance from densely populated areas not just as a factor that deteriorates satisfaction toward forest trails, but as a factor that helps meet the satisfaction by offering high-quality services such as various forest trail programs for users. In a study by Kim (2021), longer distance in terms of time and space led to higher satisfaction in choosing tourism products. Kaplan (1987) suggested being away and compatibility as some of the conditions for a restorative environment that helps people recover from urban fatigue. Being away refers to the sense of being physically and psychologically away from an environment that causes fatigue, and compatibility refers to meeting the purpose for visiting the place. Long travel time to forest trails causes a sense of being away from stressors, and program experience variety as a mediating variable meets the purpose of users visiting the facility, thereby meeting the overall satisfaction toward the facility.
Third, various factors in forest welfare activities have a complex relationship with overall satisfaction and loyalty. Both service satisfaction (safety and comfort) and travel time had direct effects as well as indirect effects through mediating variables. In particular, travel time showed a negative correlation in the direct effect with loyalty, but showed a positive correlation in the indirect effect, thereby proving a multifaceted relationship. Hong and Desai (2020) discovered that people preferred going on vacations to distant areas over nearby areas. An and Lee (2017) revealed that spatial distance des not affect visit intention. Kah et al. (2016) showed that long distance to the travel destination serves as a hindrance. These studies imply that travel time shows results in various aspects in terms of leisure activities. These results show that the relationship between satisfaction and loyalty and the factors affecting them is a complex and multifaceted relationship. As even the same variable shows different results, it is necessary to examine not only the direct effect in the relationship between satisfaction and loyalty but also the complex relationships with other factors as well.
There were limitations derived along with the conclusions above. First, we included only 7 out of 20 PSCI items in the structural equation modeling, thereby failing to analyze the other 13 items. Many items such as convenience, affordability, and aesthetics were excluded from the analysis of structural equation model fit, and thus we could not examine the correlations and characteristics of each of the diverse service items. It is necessary to consider analyzing various items by simplifying the structural equation model in the future.
Second, a variable about the number of activities or experiences in the facility must be added. Although we analyzed the variety of activities such as personal activity experience variety and program experience variety, we could not analyze the number of experiences since it was not included in the survey. Since the number of visits to a facility or experiences of a specific activity is due to the continuous use of the facility, there may be a correlation with loyalty toward the facility. However, actual analysis has not been conducted, which raises the need to examine the relationship with other variables in addition to partial correlations.
Follow-up research must be conducted in consideration of the implications and limitations above. Although this study limited the analysis to forest trails, further research will hopefully analyze each of forest welfare facilities as they have their own characteristics. It is necessary to make the most use of service satisfaction items to identify the characteristics of each facility, and apply more diverse forest welfare usage characteristics such as the number of experiences in forest welfare to the analysis. In addition, there is a need to analyze the variety of programs provided in each facility and revisit rates to verify the importance of program experience variety in this study.