The Effect of Police Officers’ Gardening Activity Level, Plant Preferences, and Key Variables on Resilience
Article information

Abstract
Background and objective
This study examines the effect of gardening activity level, plant preference, and key variables of police officers on resilience.
Methods
A total of 105 male and female respondents with an average age of 40.6 ± 9.3 were surveyed and analyzed.
Results
Respondents with older age, higher education, higher average monthly income, and longer period of service tended to show higher means of gardening activity level. Among the three factors of resilience (control, sociability, and positivity), control was higher in the graduate school group than other groups, showing statistical significance. Tulipa spp. and Narcissus spp. showed the highest preferences among the 8 cultivars of flowering plants, followed by Iris spp., Dahlia spp., Allium giantium, Eustoma grandiflourm, Zantedeschia spp. > Lilium Oriental Hybrids. And, as a result of examining the preferences for 6 plant colors, yellow and green were preferred the most, followed by white, blue, orange, and then red, showing statistical significance. The resilience of police officers showed a positive correlation with gardening activity level, multidimensional calling, job satisfaction, and plant preferences, and a negative correlation with stress level and job burnout, showing statistical significance. Regression analysis was conducted to determine the effect of gardening activity level, plant cultivar and color preference, multidimensional calling measure, job burnout, stress level, and demographic variables (control variables) on resilience. The results showed that job burnout had the greatest impact on resilience. The results of this study suggest that it will be possible to increase the resilience effect for police officers with severe trauma by using mostly yellow plants when forming gardens in the streets or the workplaces of police officers, and also by using Tulipa spp. for spring.
Conclusion
The resilience effect of the natural environment through the application of plants to police officers with severe occupational trauma could improve the quality of life and relieve stress.
Introduction
Police officers, fire-fighting officers, and soldiers repeatedly exposed to trauma by being deployed at the scene of various incidents or accidents, or jobs such as mental health nurses, psychologists, and social workers subject to special management of negative influence for being exposed to indirect stress caused when providing services necessary for alleviating the negative psychological effect caused by such incidents or accidents are high-risk occupations likely to suffer post-traumatic stress disorder (PTSD) (Alden, et al., 2008; Kwon and You, 2013; Park, 2014; Bercier and Maynard, 2015). High-risk occupations such as soldiers and police officers are exposed to all kinds of stress such as job stress, PTSD, and general emotional labor. Due to various kinds of stress caused by police work, police officers are likely to face mental health problems such as sleep disorders, anxiety, depression, PTSD, suicidal ideation, and job burnout (Berger et al., 2012; Violanti et al., 2014; Stanley et al., 2016; Kwak et al., 2018). This may ultimately deteriorate the effectiveness of work performance in the police organization. Personal and organizational problems of police officers may cause damage to the citizens that are users of public security services (van der Velden et al., 2010). Therefore, policies for stress management are required at this point in order to reduce damage from stress exposure of police officers. Today, there is a growing interest in resilience as a topic of research on stress management (Fletcher and Sarkar, 2013; Aburn et al., 2016). Resilience is the ability to overcome adversities and adjust successfully even when exposed to tough situations (Fraser et al., 1999; Jang et al., 2018). People with high resilience can better overcome an environment with many stressors than others and can successfully complete their duties (Jang et al., 2018).
Previous studies on resilience are as follows. A study on the resilience of nurses revealed that higher resilience of nurses leads to less burnout (Kim, 2013). Jo and Choi (2021) claimed that resilience is one of the factors that help mental health social workers better adapt to stressful situations and that it can be a critical ability for mental health social workers. Moreover, PTSD of police officers or fire-fighting officers showed a negative correlation with quality of life, while resilience showed a positive correlation, indicating that higher quality of life leads to lower PTSD and higher resilience (Park, 2015; Lee, 2016). Job satisfaction had a negative correlation with turnover intention or early retirement due to job stress, whereas it had a positive correlation with calling (Byrd et al., 2000). Accordingly, many studies on high-risk occupations such as police officers, fire-fighting officers, and social workers vulnerable to stress examined factors that can reduce the negative impact of job stress, and one of the typical factors is resilience (Kwak and Kim, 2019).
High resilience relieves stress and enables adaptation to even stressful situations (Ko and Yun, 2007; Bak et al., 2010). It was found that natural environments (Kaplan and Kaplan, 1989) or plant landscapes that can increase resilience not only reduce the amount of stress for viewers due to the stability provided by the color green (Ulrich et al., 1991; Parsons et al., 1998), but also are effective in improving the quality of life (Son et al., 2003). Moreover, plants as a natural environment are living organisms that provide humans with psychological functions such as stability or rest (Lee, 2014), and gardening activities offer psychological satisfaction and increase interest in plants as well as understanding, concentration, and creativity, thereby promoting interest in plants and providing positive effects (Kim, 2001; Shin et al., 2007). Humans have an underlying desire to touch and be close to nature, and everyone has an instinct to return to nature (Wilson, 1984). People today have a stronger desire to go back to nature that is a restorative environment for relief of stress they face in everyday life (Herman, 1997). While the natural environment in the past simply provided humans with living foundation and products (Yoo, 2013), now it can be seen as an essential element for the physical and psychological health of people today (Lopez-Mosquera and Sanchez, 2013).
Thus, in 2022–2023, the National Institute of Horticultural and Herbal Science developed a seasonal street flowerbed landscape model through this research project (Jang et al., 2023), creating street flowerbeds around the workplaces of local residents, especially police officers suffering occupational trauma, to obtain the resilience effect by improving their health and quality of life. We applied the plants suitable for street flowerbeds based on the distribution of resilience according to the gardening activity level and demographic characteristics of police officers, as well as the survey and analysis of plant preferences, plant color preferences, and emotions according to plant color. This study was conducted to provide useful basic data that can reduce job stress and job burnout of police officers and improve their quality of life and calling by increasing their gardening activity level or accessibility to plants for better resilience effect.
Research methods
Demographic characteristics of respondents
To examine the effects of gardening activity level, plant preferences, and key variables of police officers of a high-risk job on resilience, we conducted a survey on 110 police officers in Sunchang and Jeonju from March 20 to 31, 2023. We used total 105 copies in the final analysis excluding 5 with insufficient responses or many missing values, and the demographic characteristics are as shown in Table 1. The average age of all respondents was 40.6±9.3, and there were 87 male (82.9%) and 18 female respondents (17.1%), most of whom were in their 40s (33.3%), followed by 30s (30.5%), 50s (21.9%), and 20s (14.3%). University (students included) was the highest level of education for 71.4% of the respondents, followed by high school (21.0%) and graduate school (students included, 7.6%). For average monthly household income, most respondents earned KRW 2.01 – 3 million (41.0%), followed by KRW 3.01 – 4 million (32.4%), KRW 4.01 – 5 million (20.0%), KRW 501 million or more (4.8%), and KRW 2 million or less (1.9%). Most respondents lived with 3–4 persons (60.0%), followed by 2 persons (17.1%), 5 persons or more (12.4%), and 1 person (10.5%). 37.1% were lieutenants, 22.9% were corporals, 16.2% were sergeants, 14.3% were inspectors, and 9.5% were police constables. Most worked for 1 to less than 5 years (36.2%) and 10 years or more (36.2%), followed by 5 to less than 10 years (20.0%) and less than 1 year (7.6%).
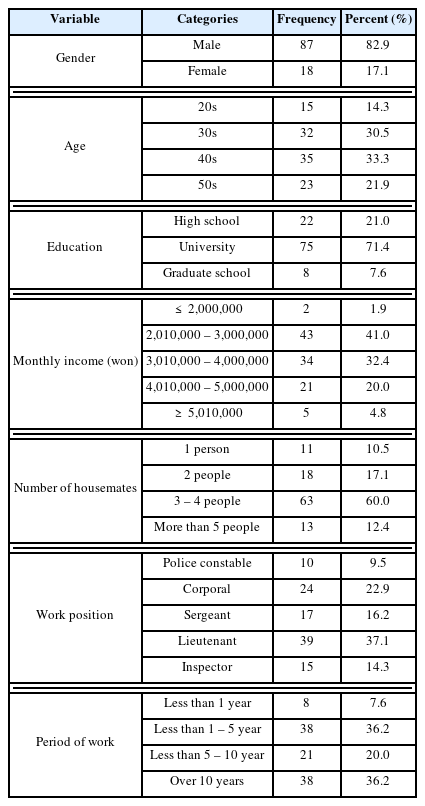
Characteristics of survey respondents (N = 105)
Analysis of psychological characteristics
The evaluation tool for psychological characteristics consisted of gardening activity level, stress level, multidimensional calling measure, resilience, job burnout, and job satisfaction.
Gardening activity level
We surveyed and analyzed the gardening activity level of respondents. The gardening activity level scale consists of total 12 items, 4 in each of the 3 factors such as gardening experience, plant preference tendency, and plant-related event (RDA, 2017; Jeong et al., 2019). The items were to be rated on a 7-point Likert scale (1 point: Most negative - 7 points: Most positive), with higher scores indicating higher level of gardening experience or awareness (Table 2). Cronbach’s α in previous research was 0.890 in the online survey and 0.947 in the offline survey, and Cronbach’s α of the gardening activity level scale used in this study was 0.955, and Cronbach’s α of the three factors was 0.909 for gardening experience, 0.823 for plant preference tendency, and 0.940 for plant-related event.

The scale of level of gardening activity
Korean Perceived stress scale (PSS:K)
We used the Korean version of the Perceived Stress Scale (PSS) to assess the psychological characteristics. The Korean version of the Perceived Stress Scale (PSS-K) is based on the Perceived Stress Scale (PSS-10) by Cohen and Williamson (1988), which is adapted by Baek (2010). This scale consists of 10 items, and the scores of the responses are summed up to determine the level of stress in four levels, with higher total scores indicating higher levels of perceived stress. Level 1 is when the total score is lower than 13 (‘normal stress when the stressor itself is not serious or is accepted as good stress’), Level 2 is when the total score is 13 or higher (‘already began to be affected by stress’), Level 3 is when the total score is 17 or higher (‘highly likely to develop into a mental disease’, and Level 4 is when the total score is 19 or higher (‘in need of professional help’). Each item was rated on a 5-point Likert scale (0 point: Most negative; 4 points: Most positive). Cronbach’s α in this study was .809.
Multidimensional calling measure (MCM)
The calling measure used in this study was the Korean version of the multidimensional calling measure (MCM-K) developed by Hagmaier and Abele (2012) and validated by Ha et al. (2014). There are total 9 items, each rated on a 6-point Likert scale (1 = Strongly disagree – 6 = Strongly agree). There are total 9 items, 3 in each of 3 factors. The first factor is ‘work identification and person– environment fit’, which is the degree to which one identifies with work, and whether the ability or talent to realize one’s inherent potential through work is well suited to one’s current job. The second factor, ‘meaning of work and prosocial value-driven behavior’, represents moral values that affect work-related behaviors at work, such as honesty, fairness, and altruism that represent the purpose and meaning of life. The third factor, ‘transcendent guiding force’, refers to high-level strength or inner feelings that allow individuals to realize what to do and how to do it, and subjective certainty based on work-related stability. Cronbach’s α in the study by Hagmaier and Abele (2012) was .88 for work identification and person–environment fit, .85 for meaning of work and prosocial value-driven behavior, and .83 for transcendent guiding force, and Cronbach’s α in the study by Ha et al. (2014) was .85, .83, and .80 respectively. Cronbach’s α in this study was .91 for multidimensional calling measure, and as for the three factors, it was .85 for work identification and person-environment fit, .86 for meaning of work and prosocial value-driven behavior, and .83 for transcendent guiding force.
Resilience
We used the resilience tool developed by Shin et al. (2009), which can be applied universally in Korea and reflects the multidimensional aspects of resilience. The scale consisted of total 27 items in 3 factors, such as control (emotion regulation, impulse control, cause analysis), sociability (communication, empathy, ego expansion), and positivity (self-optimism, life satisfaction, gratitude), which were rated on a 5-point Likert scale (1–5 points). Cronbach’s α in this study were .95, .94, and .94.
Job burnout (burnout syndrome)
To measure job burnout, we used the MBI-GS (Maslach Burnout Inventory-General Survey) developed by Schaufeli et al. (1996) and translated, revised, and tested by Shin (2003) to ensure validity and reliability. There were total 15 items in 3 factors such as emotional exhaustion, cynicism, and reduction of professional efficacy, which were rated on a 5-point Likert scale (1–5 points), with higher scores indicating higher severity.
Job satisfaction
We used the scale that had been used in the job satisfaction survey on police officers by Youn and Song (2014) and Yun (2015), which has no reliability and validity issues. There were total 3 items rated on a 5-point Likert scale (1 = Strongly disagree – 5 = Strongly agree), which evaluate the self-esteem, worth, pride, and belief the respondents have about their job, such as ‘I am glad I chose to become a police officer.’, ‘I take pride in my job as a police officer.’, and ‘I feel rewarded and proud when performing my duties.’. Cronbach’s α in the study by Youn and Song (2014) was .91, Cronbach’s α in the study by Yun (2015) was .75, and Cronbach’s α in this study was .92.
Flower cultivar, color preferences, and emotional responses to plant color
This consisted of preferences for the cultivars and colors of flowering plants in forming gardens, and the SD (semantic differential) scale.
Flower cultivar and color preferences
We used images for the preference survey on the cultivars and colors of flower plants. The cultivars we selected were those used for flower beds or cut flowers that can be commonly found in gardens or flower shops in spring and summer, such as bulbous flowers (Zantedeschia spp., Lilium Oriental Hybrids, Narcissus spp, Iris spp, Allium giganteum, Tulipa spp, Dahlia spp.) or herbaceous flowers (Eustoma grandiflourm). We used the images that had been presented in the survey on firefighters in 2019 to examine plant color preferences (Jang et al., 2020b). Color preferences were surveyed using total 6 colors with an image of a foliage plant for green and images of flowering plants for white, red, yellow, orange, and blue to be planted with plants (Fig. 1). The preference survey items were rated on a 5-point Likert scale. Cronbach’s α of the flowering plant preferences in this study was .755, and Cronbach’s α of the plant color preferences was .732.
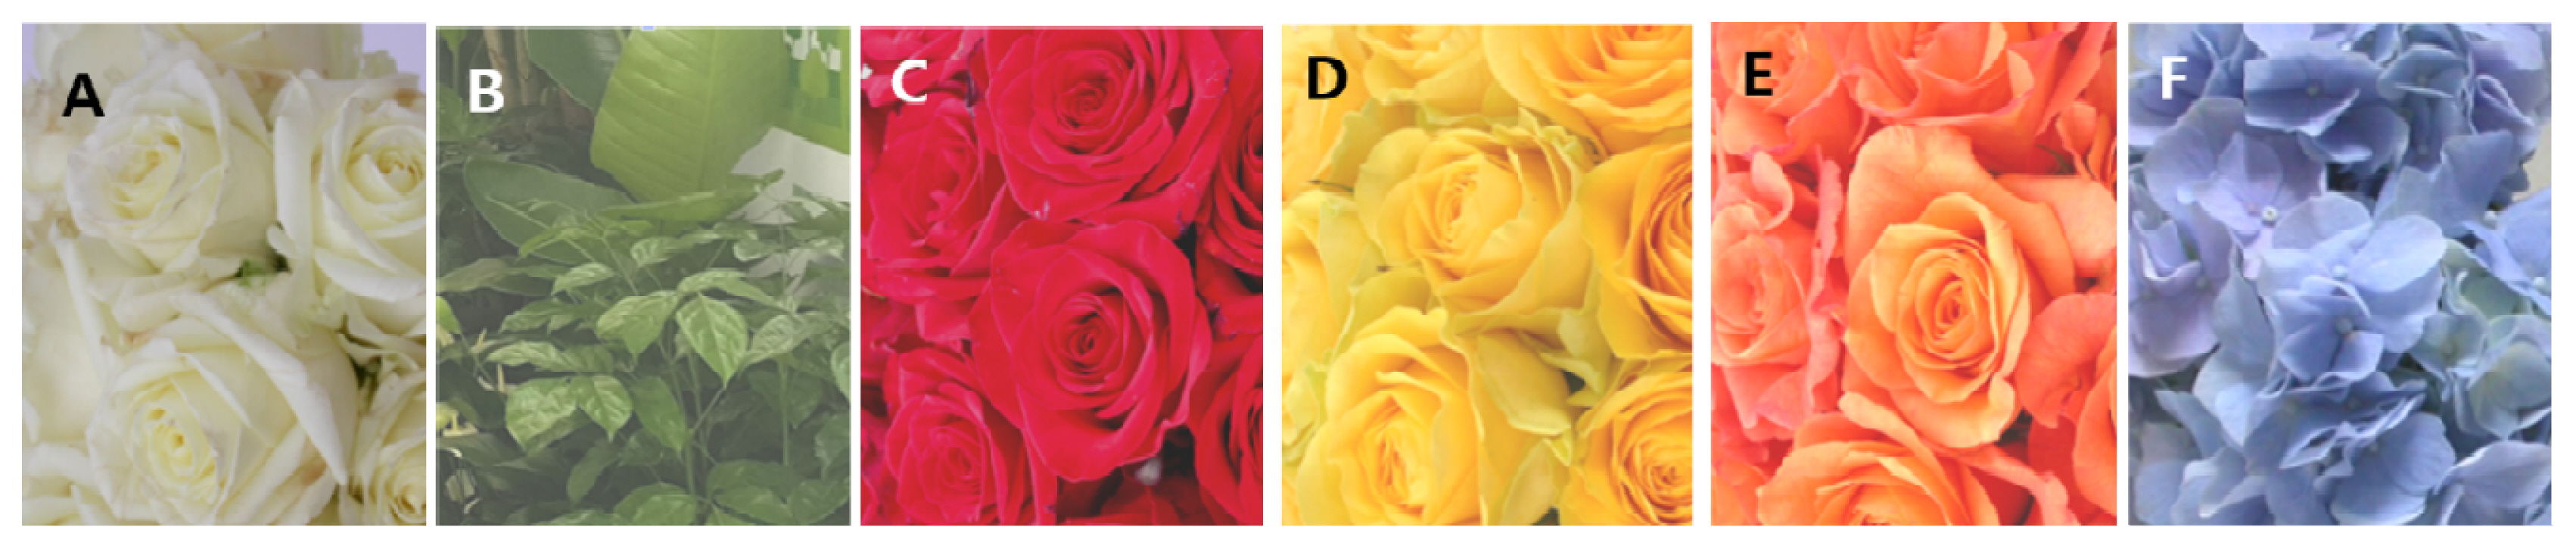
Plant Colors. (A) White; (B) Green; (C) Red; (D) Yellow; (E) Orange; (F) Blue.
Emotional responses to 6 plant colors using the semantic differential (SD) scale
The semantic differential (SD) scale is widely used to evaluate the landscape, which is difficult to quantify and has a value that changes depending on subjective preference or taste of individuals. The SD scale was developed by Osgood (1952) for measuring human emotions using adjectives, and is widely used in evaluation of emotions or landscapes. The survey in this study included emotions toward plant colors using adjectives for landscape evaluation (Im, 2009) and 13 pairs of emotional words, which are adjectives expressed about plants. The 13 pairs of adjectives were rated on a 5-point Likert scale depending on how close the respondents feel to the plant (Jang et al., 2011). In this study, Cronbach’s α of 13 pairs of emotional words was .950.
Statistical analysis
Statistical analysis of this study was conducted using IBM SPSS ver. 25.0. Cronbach’s α was calculated for reliability analysis of the measurement tools. We conducted one-way ANOVA to analyze gardening activity level, SD scale, and preferences for the cultivars and colors of flowering plants, and Scheffe’s multiple range test for post-hoc test. We used Pearson’s correlation analysis to analyze the correlation between key variables such as job satisfaction, gardening activity level, and resilience of police officers; cross-tabulation to test the difference in job satisfaction depending on the general background; and frequency analysis to analyze the demographic variables and job satisfaction of police officers. Moreover, we conducted multiple regression analysis to analyze the effect of key variables such as gardening activity level and demographic variables on resilience. In the survey of demographic characteristics, gender, age, education, occupation, and residence were surveyed on a nominal scale, and thus they were used as dummy variables for regression analysis.
Results and Discussion
Analysis of psychological characteristics
Gardening activity level
The results of surveying the gardening activity level of police officers showed that, out of the three factors of gardening activity level (gardening experience, plant preference tendency, and plant-related event), plant-related event scored the highest (3.57 ± 1.60), followed by plant preference tendency (3.38 ± 1.28) and gardening experience (3.37 ± 1.56). As a result of Scheffe’s post-hoc analysis conducted to verify the statistical significance of gardening activity level according to demographic variables of police officers, all three factors were statistically significant by age, education, average monthly income, and period of service. In all three factors, there was a statistically significant difference between the 20s and 40–50s (Table 3). For education, there was a statistically significant difference in gardening experience and plant preference tendency between high school and graduate school, and in plant-related event between high school, university, and graduate school (Table 4). For average monthly income, gardening experience and plant preference tendency were higher in the group with an income of KRW 4.01 – 5 million than the group with an income of KRW 2.01 – 3 million, showing statistical significance (Table 5). For period of service, all three factors were higher in the group that worked for at least 10 years than the group that worked for 1 year or less, showing statistical significance (Table 6). Those with older age, higher education, higher average monthly income (KRW 4.01 – 5 million), and longer period of service tended to show higher means. Therefore, the middle-aged in their 40–50s showed higher gardening activity level such as higher or more gardening experience or preference as well as plant-related memories or events compared to younger generations. Jang et al. (2019), who discovered that gardening activity level was high among the 50s or older than the 20s, support the results of this study proving that gardening experience level was high among the older respondents in their 40–50s.
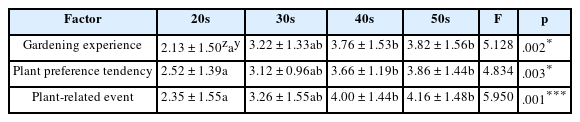
Difference in level of gardening activity by age of police officers
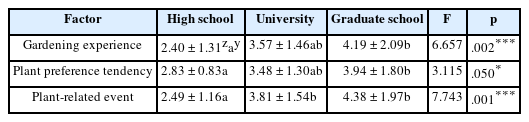
Difference in level of gardening activity by education of police officers

Difference of three factors depending on level of gardening activity by monthly income of police officers
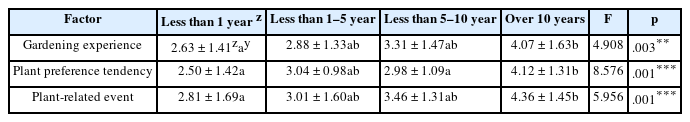
Difference in level of gardening activity by period of work of police officers
Until now, there has been very little research on gardening experience level of police officers. In this survey, the average gardening activity level of young police officers in their 20s was 2.33/7 points, with the gardening experience level extremely lower than the general public (mean 4.41/7 points) or experts (mean 5.36/7 points), indicating that there must be opportunities to constantly encounter plants (Jang et al., 2023). Further research is needed to examine the gardening activity level of police officers. Gardening activities also provide interest in plants as well as positive effects along with psychological satisfaction by increasing attention, understanding, and concentration in plants (Kim, 2001; Shin et al., 2007). Therefore, by creating a flower landscape or garden, which is a natural landscape, in a space close to police officers with lower accessibility to plants than plant experts or the general public, continuous efforts must be made for police officers to easily encounter plants at work or in everyday life without having to search for them (Jang et al., 2023).
Resilience according to demographic variables
As a result of conducting Scheffe’s post-hoc analysis to test the statistical significance of resilience according to the demographic variables of police officers, only education showed a statistically significant difference between groups (Table 7). There were no statistically significant differences between groups by gender, age, and occupation. Among the three factors of resilience (control, sociability, positivity), control was higher in the graduate school group than others, showing statistical significance. There were no statistically significant differences between groups by age and average monthly income, but control and positivity were high among the 30 s, and sociability among the 20 s. For average monthly income, all three factors tended to be higher in the group with an income of KRW 2.01 – 3 million than others (Table 8, 9). Kwon and Joo (2017), who discovered that police officers who worked for less than 5 years, are police constables, and are in their 20s showed the highest resilience, support the results of this study in which the resilience was high among the 20–30s.

Difference in level of resilience by education of police officers
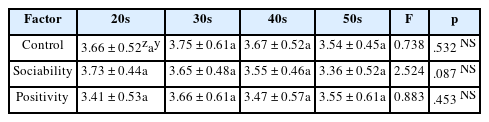
Difference in level of resilience by age of police officers

Difference in level of resilience by monthly income (Korean won) of police officers
Distribution of job satisfaction
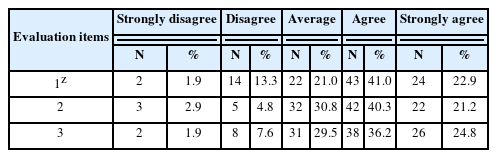
As a result of rating the survey items on the job satisfaction of police officers on a 5-point Likert scale, more than 60% of the responses for all three items of job satisfaction were positive (‘Strongly agree’, ‘Agree’). Only 2–3% of the responses were most negative (‘Strongly disagree’), indicating that police officers have slightly high job satisfaction (Table 10). The results of this study in which more than 60% of the responses about the job satisfaction of police officers were positive were somewhat different from the study by Jang et al. (2020a) on a different occupation, revealing that there were 70–80% positive responses for all three items in the job satisfaction survey on firefighters of a high-risk job.
Distribution of job satisfaction of police officers
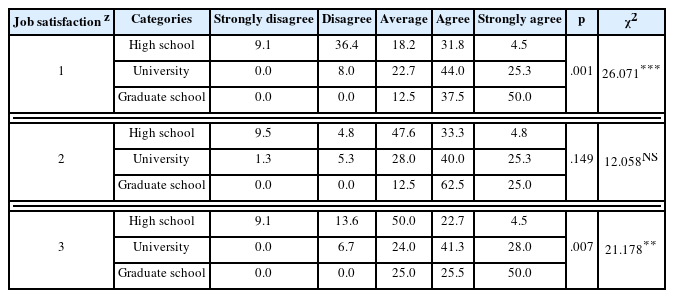
As a result of cross-tabulation to determine the distribution of job satisfaction according to the sociodemographic background of police officers (Table 11), for education, Satisfaction 1 ‘I am glad I chose to become a police officer’ showed p-value .001 (χ2 = 26.071) at α = .05, and Satisfaction 3 ‘I feel rewarded and proud when performing my duties’ showed p-value .007 (χ2 = 21.178) at α = .05, showing that all three items of job satisfaction were higher in the university group and the graduate school group compared to the high school group. This indicated that there was a difference in Satisfaction 1 and Satisfaction 3 with statistical significance. There was no statistical significance according to age, average monthly income, and the number of persons they live with. The results of this study that job satisfaction was higher in the university group and the graduate school group compared to the high school group are supported by Jang et al. (2020a), who revealed that job satisfaction of firefighters was higher in the university group and the graduate school group compared to the high school group in terms of Satisfaction 2 ‘I take pride in my job as a firefighter’ and Satisfaction 3 ‘I feel rewarded and proud when performing my duties’.
Cross-correlation analysis of job satisfaction according to education
Preferences for flower cultivars and colors, and emotional responses toward plant colors
Respondent preferences for flower cultivars and colors
As a result of examining preferences for flower cultivars (Table 12), F-value was 4.595 and p-value was .001, indicating that there was a statistically significant difference in preferences for 8 cultivars of flowering plants. The preferences were the highest for Tulipa spp. and Narcissus spp., followed by Iris spp., Dahlia spp., Allium giganteum, Eustoma grandiflourm, Zantedeschia spp., and Lilium Oriental Hybrids.

The preference of eight cultivars of flower plants
As a result of examining different preferences for 6 plant colors (Table 13), F-value was 4.842 and p-value was .001. The preferences were the highest for yellow (3.70 ± 0.84) and green (3.58 ± 0.86), followed by white, blue, orange, and red, showing statistical significance. These results were similar to the study results by Jang et al. (2020b) that firefighters most preferred yellow in the plant color preference survey for gardening activities, followed by white, blue, orange, red, and green, and that police officers and firefighters do not prefer red plants, which is related to the fact that they encounter many wounds or bloodstains in scenes of accidents. Therefore, it is necessary to use yellow, which has high preference, as the dominant color for flower landscapes around the workplaces of police officers, while avoiding use of red with low preference.
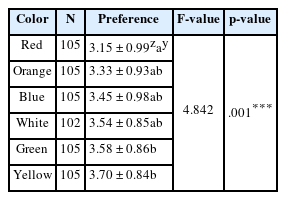
The preference of six colors of plants
Emotional responses to plant colors
The results of analyzing emotions of police officers towards 6 plant colors using 13 pairs of adjectives as emotional words that can be expressed about plants are as follows (Table 14). The white group mostly showed emotional responses such as ‘bright’, ‘clean’, ‘light’, ‘calm’, ‘comfortable’; the green group showed ‘cool’, ‘concentrated’, ‘comfortable’; the red group showed ‘fancy’, ‘strong’; the yellow group showed ‘bright’, ‘warm’, ‘clean’, ‘pleasant’, ‘relaxed’, ‘vibrant’, ‘comfortable’; the orange group showed ‘warm’, ‘fancy’; and the blue group showed ‘cool’. This study reveals that the yellow, white, and green groups feel that the plant color is bright and comfortable, the blue group cool, and the red and orange groups fancy, which is supported by Jang et al. (2020b) that the yellow group mostly showed emotional responses such as ‘bright’, ‘clean’, ‘warm’ while the green, white, and blue groups generally showed ‘comfortable’, and the red and orange groups tended to show ‘fancy’, and also by Song (2004) that the respondents showed high comfortable emotion in a space with green plants.
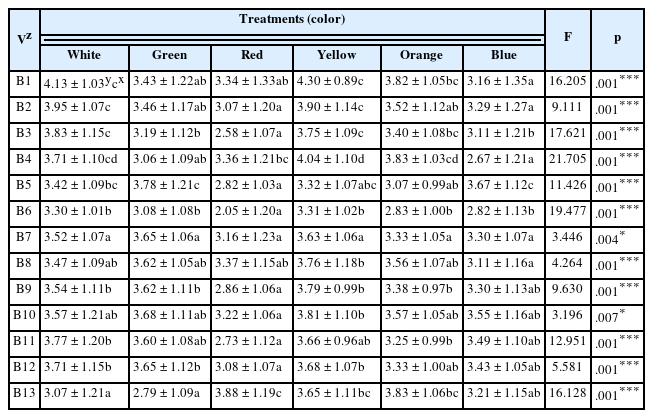
The difference of emotional words between the six colors of plant
Correlation between plant color preferences of respondents and emotional words about plant colors
As a result of examining the correlation between plant color preferences and the emotions felt from plant colors, positive correlations were mostly found between plant color preferences and emotional words about plant colors. Accordingly, the results showed that there were high positive correlations of .5 or higher between white and red and ‘distracted - concentrated’, ‘unpleasant - pleasant’; green and ‘unpleasant - pleasant’, ‘nervous - relaxed’; yellow and ‘uneasy - comfortable’, ‘distracted - concentrated’; orange and ‘unpleasant - pleasant’, ‘uneasy - comfortable’, ‘distracted - concentrated’; and blue and ‘unpleasant - pleasant’, ‘uneasy - comfortable’ (Table 15). For positive correlation, when plant color preferences increase, emotional words are mostly positive (e.g., ‘concentrated’, ‘pleasant’, ‘relaxed’, ‘comfortable’), whereas when plant color preferences decrease, there are more negative emotions (e.g., ‘distracted’, ‘unpleasant’, ‘nervous’, ‘uneasy’). The results of this study show that higher plant color preferences lead to more emotions such as ‘pleasant’, ‘comfortable’, and ‘relaxed’, which are supported by Jang et al. (2020b) who analyzed the psychological effects of plant color preferences of firefighters and discovered that higher preferences showed positive correlations with emotional words such as ‘pleasant’, ‘calm’, and ‘relaxed’.
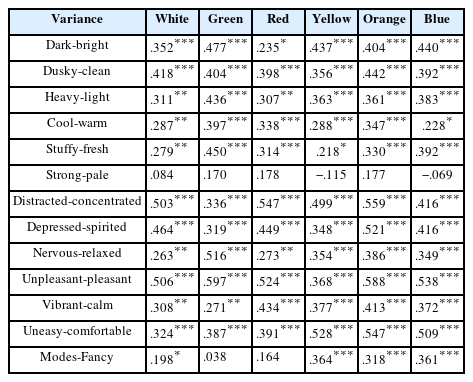
Correlation between preference of plants colors and emotional words for plant colors
Correlation between resilience and key variables
Correlation between the resilience of police officers and key variables ranged from .24 to .75, and there was a correlation between each variable. Police officers’ resilience and multidimensional calling, gardening activity level, job satisfaction, and plant preference showed positive correlations, and stress level and job burnout showed negative correlations and were statistically significant. The resilience of police officers had a positive correlation with multidimensional calling, gardening activity level, job satisfaction, and plant preferences, and a negative correlation with stress level and job burnout, showing statistical significance. This indicates that higher values of key variables such as multidimensional calling, gardening activity level, plant preference, and job satisfaction and lower values of stress level and job burnout lead to higher resilience. In particular, resilience of police officers showed a rather high negative correlation of more than −.56 with job burnout and stress level. This was similar to the study by Kim (2017) reporting that resilience had a negative effect on subfactors of job burnout such as cynicism and professional efficacy. Moreover, it had a high positive correlation of more than .63 with negative factors such as stress level and job burnout, and a high positive correlation of more than .60 with positive factors such as calling and job satisfaction, as well as preferences for cultivars and plant colors (Table 16).
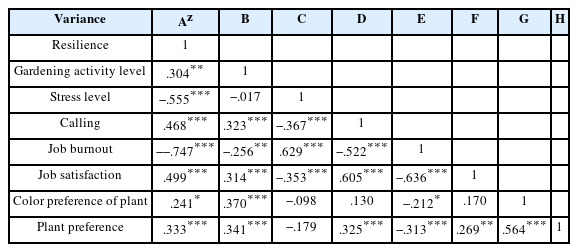
Correlation between resilience and key variable of police officers
The effect of key variables and demographic variables of respondents on resilience
Multiple regression analysis was conducted to examine the effect of demographic variables and key variables such as gardening activity level, plant cultivar and color preferences, and job burnout on the resilience of respondents (Table 17). There was no multicollinearity because the correlation between independent variables was low, and since Durbin-Watson was 1.936, which is close to 2, there was no autocorrelation (data not shown). Regression analysis was conducted to examine the effect of gardening activity level (3 factors: gardening activities, plant preference tendency, and plant-related event), multidimensional calling measure, stress level, job burnout (3 factors: emotional exhaustion, cynicism and reduction of professional efficacy), flowering plant cultivar and color preferences, and demographic variables (control variables) on resilience (3 factors: control, sociability, positivity). The results showed that reduction of professional efficacy and emotional exhaustion among the three factors of job burnout, stress level, average monthly income (KRW 2.01 – 3 million), and gardening activity level were variables that affected resilience. In other words, those with an average monthly income of KRW 2.01 – 3 million, higher gardening activity level, and less experience in reduction of professional efficacy, stress level, and emotional exhaustion tended to show higher resilience. Demographic variables such as gender and education, except average monthly income that is the control variable of respondents, did not affect resilience.
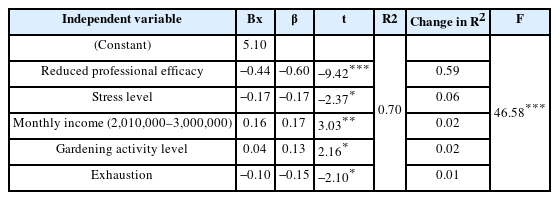
The effect of stress scale, job satisfaction, job burnout, calling, preference, and demographic variables on resilience
These variables explain about 70% of resilience. Among the three factors of job burnout, reduction of professional efficacy factor has the most explanatory power at 59%, which may increase by 11% by adding 6% stress level, 2% average monthly income (KRW 2.01 – 3 million) and 2% gardening activity level, and 1% emotional exhaustion, thereby having total 70% explanatory power. Moreover, F-value 46.58 was significant at p < .001, showing that the regression model in this study is fit. Therefore, for relative explanatory power over independent variables that affect the resilience of respondents, reduction of professional efficacy showed the biggest effect, followed by stress level, average monthly income (KRW 2.01 – 3 million), gardening activity level, and emotional exhaustion. Reduction of professional efficacy turned out to be the variable that is most influential. These results a re supported by Kim (2017) who revealed that resilience showed high explanatory power of 38% for reduction of professional efficiency, and positivity of resilience had a negative effect on all factors of job burnout. This indicates that gardening activity level known to help relieve stress and promote emotional stability and health (Kwak, 2004; Lee, 2006), such as gardening experience, plant-related memories or events, and higher plant preferences or lower job burnout has a significant effect on increasing resilience.
Conclusion
This study conducted a survey and an analysis on total 105 male and female respondents with the average age of 40.6±9.3 to determine the effect of gardening activity level, plant preference, and key variables of police officers at high risk on resilience. As a result of examining the garden activity level of police officers, plant-related event showed the highest score among the three factors (gardening experience, plant preference tendency, plant-related event), followed by plant preference tendency and gardening experience. Those with older age, higher education, higher average monthly income, and longer period of service tended to show higher means of gardening activity level. Among the three factors of resilience (control, sociability, positivity), control was higher in the graduate school group compared to others, showing statistical significance. For job satisfaction, 62% of the responses for all 3 items were ‘Agree’ and ‘Strongly agree’. As a result of examining the difference in job satisfaction by education using cross-tabulation, there was a difference in job satisfaction depending on education, with job satisfaction higher in the graduate school group than the high school and university groups, showing statistical significance. Out of 8 cultivars of flowering plants, Tulipa spp. and Narcissus spp. showed the highest preferences, followed by Iris spp., Dahlia spp., Allium giganteum, Eustoma grandiflourm, Zantedeschia spp. 〉 and Lilium Oriental Hybrids. As a result of examining the preferences for 6 plant colors, yellow and green were preferred the most, followed by white, blue, orange, and then red, showing statistical significance. The results of analyzing the psychological responses of police officers to emotional words about 6 plant colors showed that the yellow and white groups strongly feel the emotions of ‘bright’ and ‘comfortable’, the green and blue groups ‘cool’, and the red and orange groups ‘fancy’. The resilience of police officers showed a positive correlation with gardening activity level, multidimensional calling, job satisfaction, and plant preferences, and a negative correlation with stress level and job burnout, showing statistical significance. Regression analysis was conducted to determine the effect of gardening activity level, plant cultivar and color preference, multidimensional calling measure, job burnout, stress level, and demographic variables (control variables) on resilience. The results showed that job burnout was the most influential variable on resilience, followed by stress level, average monthly income (KRW 2.01 – 3 million), and gardening activity level. Moreover, higher plant preferences of police officers led to higher positive emotions such as pleasant, vibrant, and comfortable, showing statistical significance. The results of this study suggest that it will be possible to increase the resilience effect for police officers with severe trauma by using mostly yellow plants when forming gardens in the streets or the workplaces of police officers, and also by using Tulipa spp. for spring. Therefore, the resilience effect of the natural environment through the application of plants to police officers with severe occupational trauma will improve the quality of life and relieve stress.