Purification Effect of Vegetation Biofilters on Particulate Transition Metals in Multi-Use Facilities
Article information

Abstract
Background and objective
Among multi-use facilities, underground subway stations are vulnerable areas where total management of particulate matter (PM) has been implemented through the Seasonal PM Management System. Through the friction between train wheels and rails that occurs subway stations, iron oxide particles are generated, which can cause various diseases in the human body. This study aims to explore the application of plants to biofilters as a sustainable method for reducing metallic particle pollution.
Methods
The experimental group was designed based on the application of plants and waterings to biofilters. Experimental data were obtained through time-series monitoring of PM using Indoor Air Quality (IAQ) stations and SEM-EDS-based chemical species analysis of PM samples. The chemical species analysis was involved in determining the weight ratio of Fe in the particles through 15 repeated analyses of large-area samples at 100 × magnification.
Results
The highest concentration of PM was found during the 4th period of the day (when days were divided into 4 periods of 6 hours each), with PM10 at 46.3 ± 27 μg/m3 and PM2.5 at 23.8 ± 14.1 μg/m3. For the average weight ratio (AWR) of Fe, the experimental group (R.A.: 3.28wt%, S.A.: 0.25wt%) showed a reduction rate of approximately 92%, while control group 1 (R.A.: 0.51wt%, S.A.: 0.28wt%) showed a reduction rate of approximately 45%; control group 2 (R.A: 1.37wt%, S.A: 0.55wt%) showed a reduction rate of approximately 60%.
Conclusion
The highest rate of Fe reduction was found when both plants and waterings were applied to the biofilters. This finding is consistent with those of previous studies on the positive effects of iron oxidation associated with plant growth.
Introduction
Among multi-use facilities (MUFs), subway stations are one of the most vulnerable places to particulate matter (PM). Through the Seasonal PM Management System, which has been implemented by the Ministry of Environment since 2019, the 4th total pollutant management is currently being conducted for such facilities (Ministry of Environment, 2022). Notably, PM emitted from MUFs with high frequency of use has different chemical compositions for each type of spaces due to various emission sources.
Representative MUFs include parking lots, underground shopping centers, and subway stations. Particulate pollutants generated in parking lots that have been identified include Fe, K, Mg, Mn, Na, and V, which are attributed to the effects of rock weathering or soil re-dispersion originating from the spaces. In addition, Cd, Cr, Cu, Ni, Pb, and Zn have been reported to be emitted due to the effects of vehicle movement and parking (Bae et al., 2011). In underground shopping areas, C, N, and O, presumed to be fiber particles originating from clothing stores and the clothes of passers-by, were detected (Maskey et al., 2011), and the concentrations of V, Mn, and Ni related to indoor combustion were also measured to be relatively high around restaurants (Sim, 2021). Subway stations are MUFs where iron particles generated by the friction between rails and train wheels combine with oxygen to diffuse iron oxide-based particulate contaminants (Eom et al., 2013). It was also reported that the PM generated from subway stations includes transition metals such as Al in addition to Fe (Jung et al., 2010).
Fe detected in subway stations has the form of iron oxide nanoparticles (IONs) and can be absorbed into the body by the users of such facilities through breathing. When IONs are excessively absorbed by the body, iron accumulation and oxidative stress in nerve cells may cause some proteins to aggregate, leading to degenerative brain diseases such as Alzheimer’s and Parkinson’s (Yarjanli et al., 2017). In addition, IONs can cause cardiorespiratory toxicity including temporal lobe diseases, hemochromatosis and beta thalassemia (Yarjanli et al., 2017). As such, it is necessary to discuss a sustainable method for purifying the transition and heavy metals generated in the living environment that are harmful to the human body.
Plant growth requires various elements, which can be divided into essential and trace elements. Essential elements include C, H, O, N, P, K, Ca, Mg, S, B, Cl, Cu, Fe, Mn, Mo, Ni, and Zn (Jones and Jacobsen, 2005), while trace elements include Fe, Zn, Cu, Mn, Co, Ni, B, Mo, and Cl (Spears, 2003). These include metals harmful to the human body such as Cu, Co, Mo, Zn (Lee and Chon, 2004); it is known that those chemical species are involved in plant growth and can be reduced by plants. In particular, when it comes to Fe, it was reported that nanoparticles combined with oxygen and Fe at appropriate concentrations increased the yield of C3 plants (Li et a l., 2021). A previous study (Kim and Lee, 2022) confirmed the effect of vegetation biofilters in underground stations on reducing Fe.
In this context, this study seeks methods by which plants can be used for the reduction of particulate transition metals that can be classified as hazardous to human bodies in underground stations, which are among the large-scale MUFs. To this end, to determine the function of plants based on the experimental group established through previous research, control groups were established depending on whether waterings and/or plants were applied, and a sampling and SEM-EDS analysis of PM were performed (Kim et al., 2022).
Research Methods
Study site environment
The study site was Gyeongbokgung Station on Subway Line 3, which is located in Sajik-ro, Jongno-gu, Seoul. As the subway station is close to a number of major tourist attractions and facilities, including Gyeongbokgung Palace, Gwanghwamun Gate, Sajik Park, Tongin Market, and the Blue House, it has the 44th largest number of subway users out of a total of 285 underground stations. The number of its users decreased due to the COVID-19 pandemic to 30,418 in 2020, but had increased to 43,330 as of 2022 (Seoul Metro, 2022; Fig. 1).
Installation location of vegetation biofilter and IAQ station.
In this study, our experiment was conducted with multi-modular vegetation biofilters that improved on the limited air-conditioning airflow volume of the existing single-modular vegetation biofilters (Choi and Kim, 2021), and the biofilter system was installed at the same place as in the preceding study (Kim et al., 2022).
Vegetation biofilters
The multi-modular vegetation biofilter system installed in the waiting room on the second floor of Gyeongbokgung Station consisted of a total of 8 modules (Fig. 2). It is divided into an air conditioning (AC) module, a filter module, an artificial light source (ALS) module, and an irrigation module; the AC module consisted of Return Air panels (R.A.; 494 × 933 mm, 4EA) and Supply Air panels (S.A.; 494 × 300 mm, 4EA), which are connected to an AC fan (single phase; 220V, 2510 rpm, 0.17 kW).
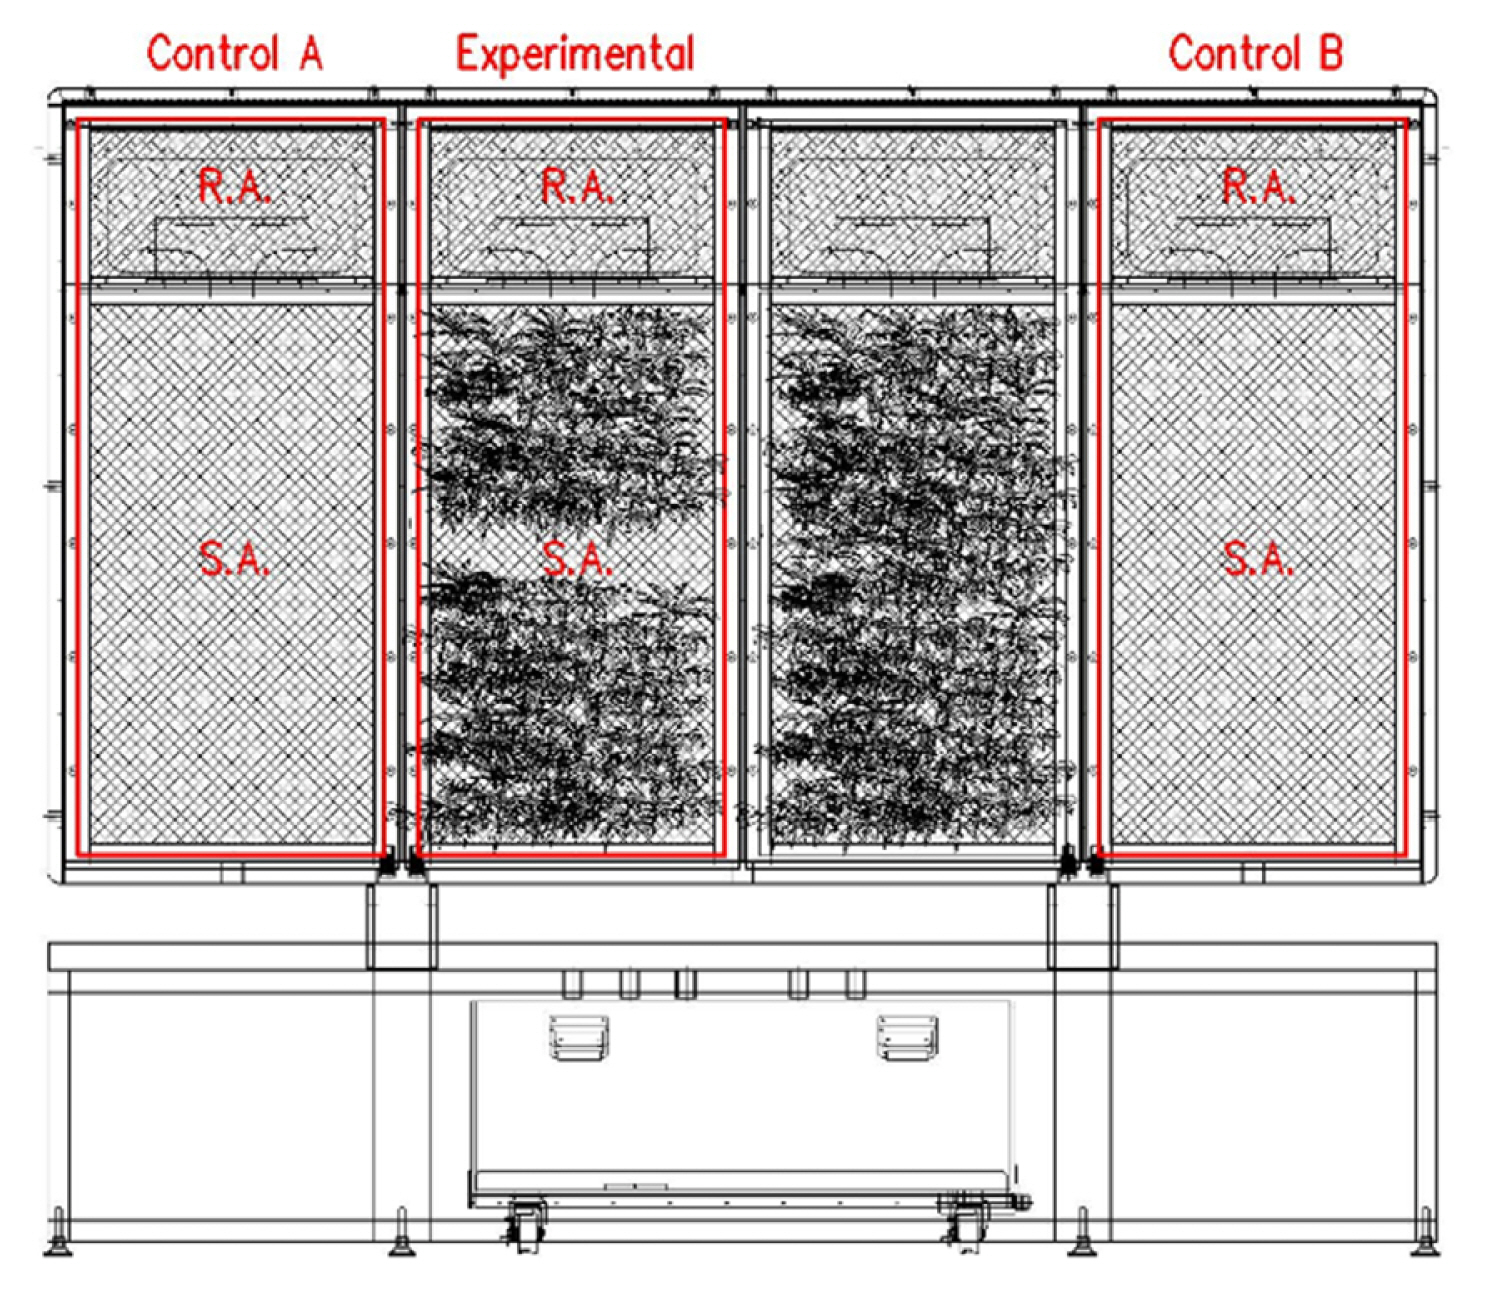
Experimental and control groups of multi-modular vegetation biofilters.
The filter module is connected to the AC module, and has a multi-layered structure based on a pre-filter to which air-purifying plants can be selectively applied. For the ALS module to substitute the natural light environment, LED lamps (Cool White, 440–660 nm full spectrum, 0.2W) whose lighting time can be set are installed at the top of the system. The irrigation module includes a controller at the bottom that controls the individual irrigation cycle of the module, an irrigation pump (single-phase; 220V 14 mm, 7 ℓ/min, rated power 39 W) and an irrigation water tank (1941 × 410 mm), which are linked with a flow controller that controls the time-series amount of irrigation (Fig. 2).
Experimental design
This experiment was conducted by dividing the multi-modular vegetation biofilters into experimental and control groups depending on whether irrigation and plants are applied. The experimental and control groups are composed of one R.A. part and one S.A. part, respectively, and their location is identified by the identification number on the left side (Fig. 2). The panels of the experimental group (R.A. and S.A.) are Panel 2, to which both waterings and plants are applied. The panels of control groups are divided into two types: Control A is Panel 1, to which both waterings and plants are not applied; and Control B is Panel 4, to which only waterings are applied. A total of 25 air-purifying plants of three species, including Dracaena fragrans var. massangeana, Ficus elastica Robusta, and Epipremnum aureum, are planted on Panels 2 and 3. In addition to being used for ornamental purposes, the applied plants have excellent air purification capabilities to deodorize and decompose volatile organic compounds (VOCs) (Song, 2010).
For the AC module, the AC fan was operated every 6 hours, and the experimental conditions of the previous study were applied to the filtering wind speed of R.A. panels; the module was set to maintain a wind speed level of 0.126 m/s, at which plants are not stressed by wind speed, and to secure a total AC capacity of 177.18 m/h (Kim et al., 2022). For the ALS module, LED lights were turned on from 6:00 to 22:00 by applying the photo-environment conditions of the previous study to create a photo-environment with an average PPFD of 28.5μmol/m2s in the middle of each panel (Kim et al., 2021). The irrigation module was set to supply water at a rate of 1.5 L/min per panel by driving the pump at all times.
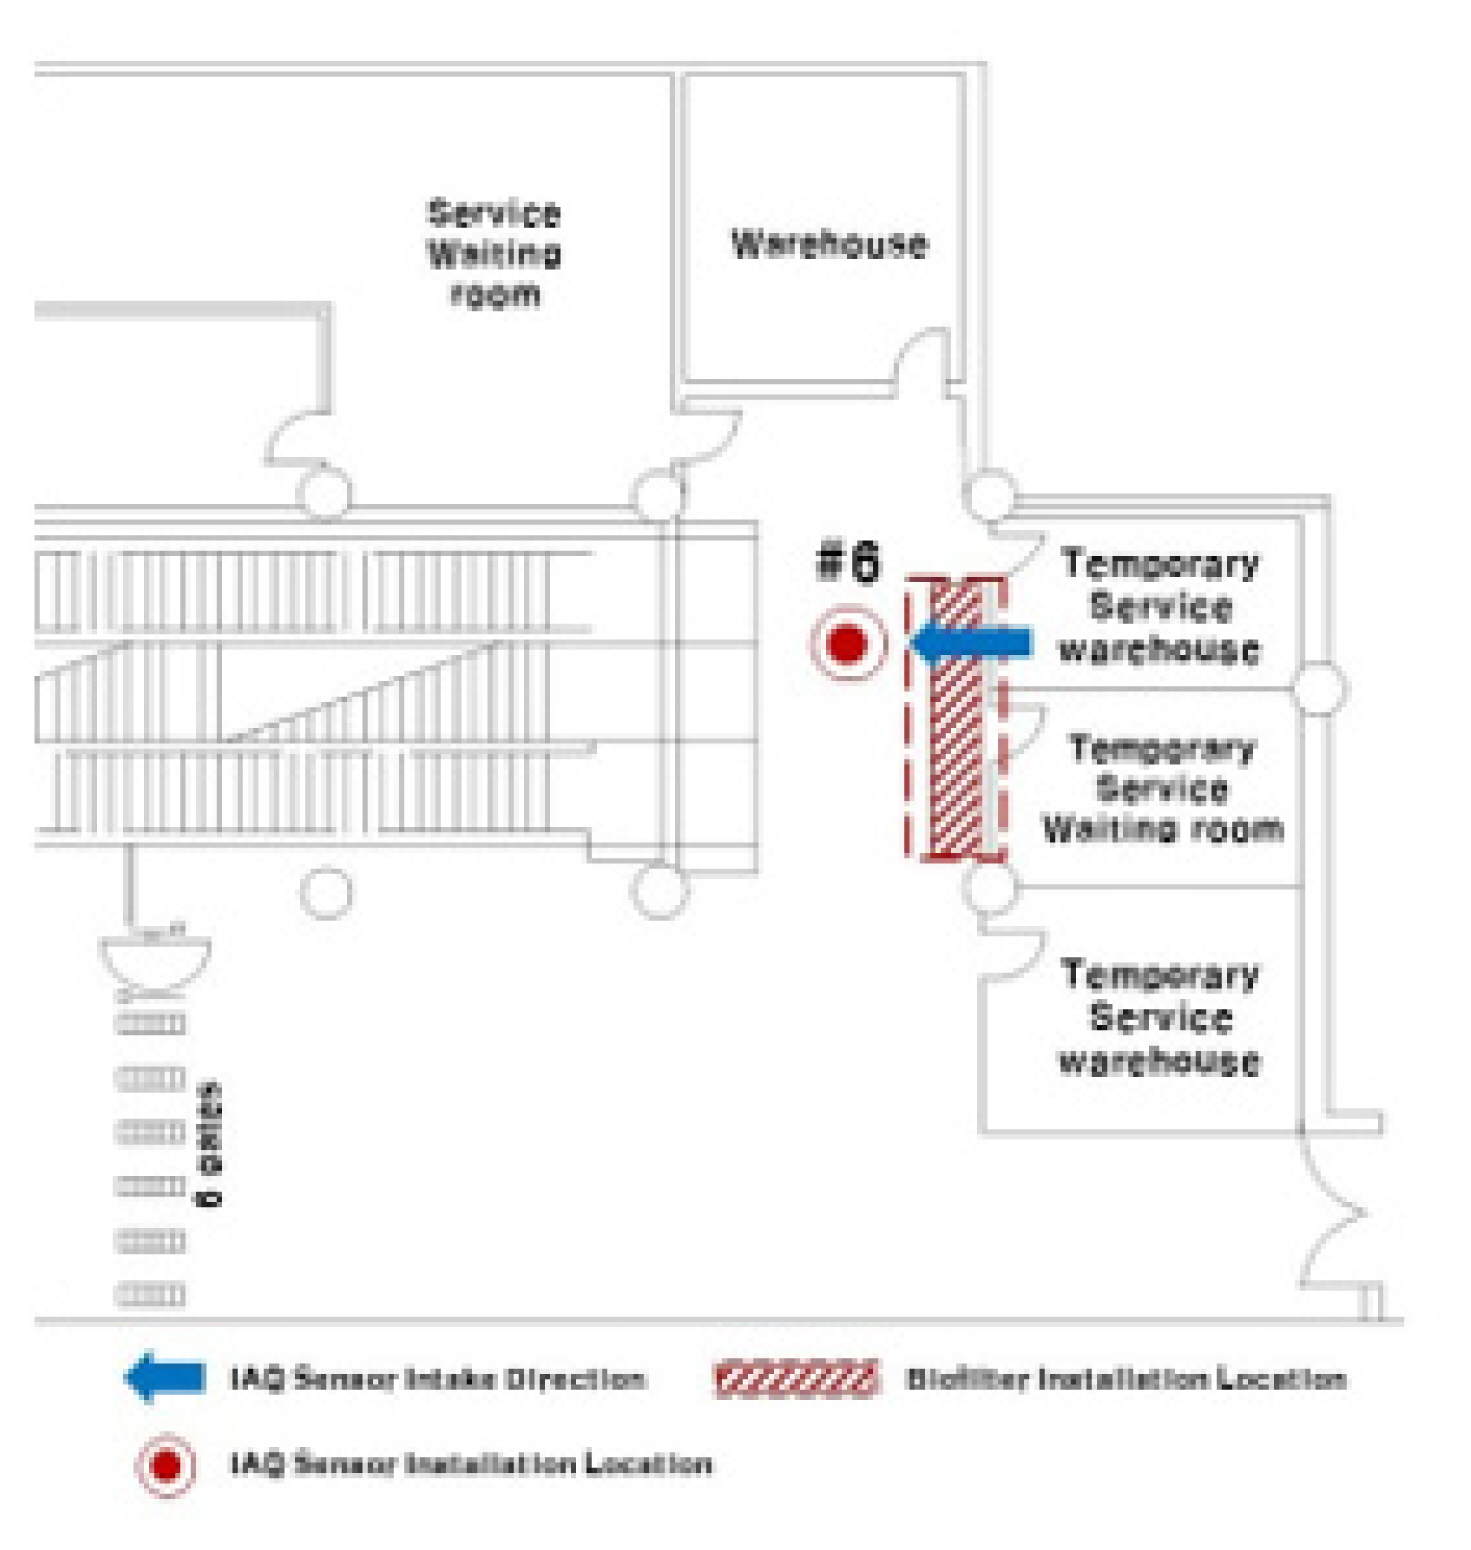
The time-series air quality status of the study site, where the vegetation biofilters had been installed, was monitored and analyzed by installing 6 indoor air quality (IAQ) stations (Smart Aircok, Aircok, Korea) (Fig. 3).
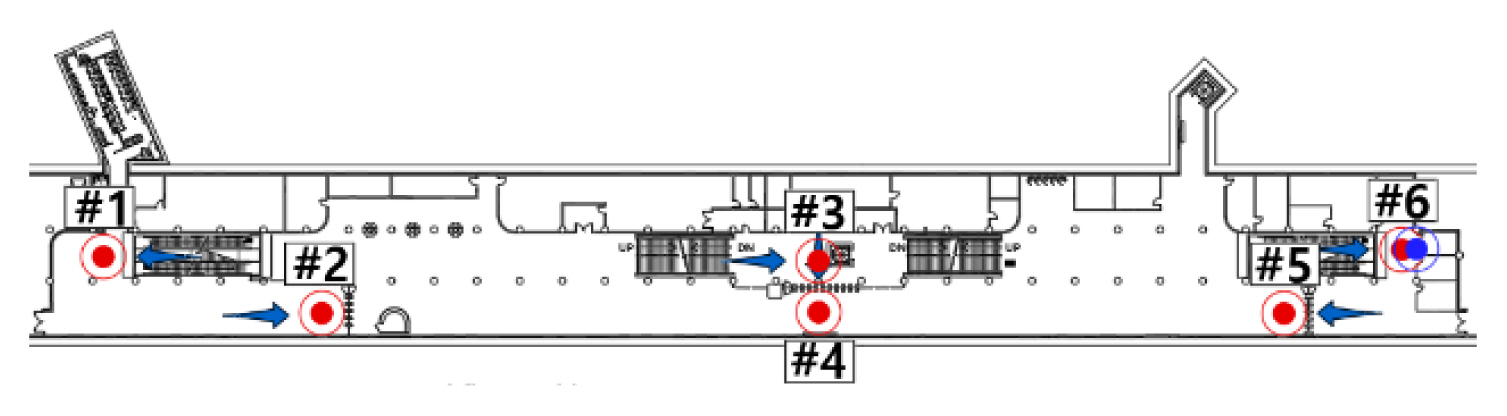
Installation location of vegetation biofilters and IAQ stations.
Sampling and analysis method
By applying the experimental method of the preceding study, time-series monitoring of PM was performed in this experiment under the above conditions and samples were collected. The study site was monitored for a total of 8 days from October 07 to October 14, 2022, when about 500 days (from May 2021) had elapsed after the installation of the multi-modular vegetation biofilter system. The data on PM2.5 and PM10 collected from the IAQ station in Zone #6 where the system was installed among the six IAQ stations were obtained from the server, and a time-series analysis of the data was performed after processing the average concentration during the weekdays. Samples to measure particulate pollutants in the filter module were collected on October 14, 2022 from the center of the R.A. and S.A. panels in the experimental group and two control groups, respectively. collected samples were cut into 5 mm × 5 mm squares and pretreated using an ion sputter coater (G20, GSEM, Korea). The samples were photographed 15 times per sample at 100× magnification for large-area imaging by coupling an energy dispersive X-ray spectroscopy (EDS; QUANTAX-610X, Bruker, Germany) to a high magnification scanning electron microscope (SEM; CUBE III, Emcrafts, Korea). For chemical species analysis, three zones were divided and photographed for each particle, and the weight ratio of the detected elements was estimated for each zone.
Results and Discussion
PM status analysis
The data collected from the IAQ station in Zone #6 were applied to the status of PM in the study site. Data collected during the monitoring period were aggregated by classifying PM into PM2.5 and PM10 according to particle size as follows (Fig. 4).

Indoor air quality in the zone where vegetation biofilters were installed.
The highest average concentration for the analysis period was recorded in the 4th period of the day (divided into 4 periods of 6 hours each) for both PM10 (18:00–24:00, 46.3 ± 27.5 μg/m3), and PM2.5 (18:00–24:00, 23.8 ± 14.1 μg/m3). This is in line with the findings of a previous study on PM concentration pattern for each period of the day (divided into 6 periods of each 4 hours) on the main section of Seoul Subway Line 2. In their study conducted during the winter season, the highest concentrations of particulate pollutants were measured between 6:00–12:00 and between 18:00–21:00, for both PM2.5 and PM10. Based on the ticket gate data provided by Seoul Transportation Corporation, the floating population soared from 808 to 5,508 between 6:00–9:00, and from 3,477 to 6,547 between 16:00–19:00 (Seoul Metro, 2022). Therefore, it seems that the rapid increase in the floating population during commuting hours played an important role in the monitoring results in this study, which were similar to those of the preceding study.
Temperature and humidity
As with PM, the data collected from the IAQ station in Zone #6 were applied to the temperature and humidity of the study site. The collected data were aggregated by dividing a day into 4 periods of 6 hours each as follows, and were classified into temperature and humidity (Fig. 5).

Indoor air quality in the zone where vegetation biofilters were installed.
The highest and lowest average humidity for the analysis period was aggregated to be 51.34 ± 9.16 RH% between 6:00–12:00 and 48.86 ± 7.04 RH% between 12:00–18:00, respectively. The highest and lowest average temperatures were aggregated to be 23.20 ± 2.2 °C between 12:00–18:00 and 21.69 ± 2.71 °C between 00:00–06:00, respectively. It seems that the increase in the internal temperature was affected by the increase in external temperatures between 12:00–18:00, and the humidity at the same period was decreased due to the operation of the air conditioner.
Chemical species analysis of particulate pollutants
The chemical species were analyzed through an SEMEDS-based large-area analysis of the samples collected from the center of the R.A. and S.A. panels (i.e., R.A. and S.A. samples) of the experimental group and control groups 1 and 2 (Control 1 and 2), and can be summarized as follows.
Experimental group
For the experimental group, C and O were the main chemical species detected, and the weight ratio for chemical species, including Al, S, K, Ca, Si, Fe, Nb, and Na, was determined. Among those, the average weight ratio (AWR) of Fe detected from R.A. and S.A. samples was estimated to be 3.28wt% (SD = 0.84) and 0.25wt% (SD = 0.13), respectively. This seems to be in line with the findings of the previous study that the AWR of Fe detected from S.A. samples converged to a minimum of 0 wt% through an SEM-EDS-based chemical species analysis (Kim et al., 2021; Fig. 5).
Control groups
In Control 1, C and O were also detected as major chemical species, and the weight ratio for chemical species, including Al, Si, K, Ca, and Fe, was determined. Among those, the AWR of Fe detected from the R.A. samples was 0.51wt% (SD = 0.17), which was relatively lower compared to the experimental group, while the AWR of Fe detected from the S.A. samples was 0.28 wt% (SD = 0.15).
For Control 2, C and O were also detected as the main chemical species, and the weight ratio of chemical species, including Al, Si, Ca, K, and Fe, was determined. Among those, the AWR of Fe detected from the R.A. samples was 1.37 wt% (SD = 0.27), which was similar to that of the experimental group, while the AWR of Fe detected from the S.A. samples was 0.55 wt% (SD = 0.18), the highest AWR of Fe among the analyzed targets (Fig. 6).
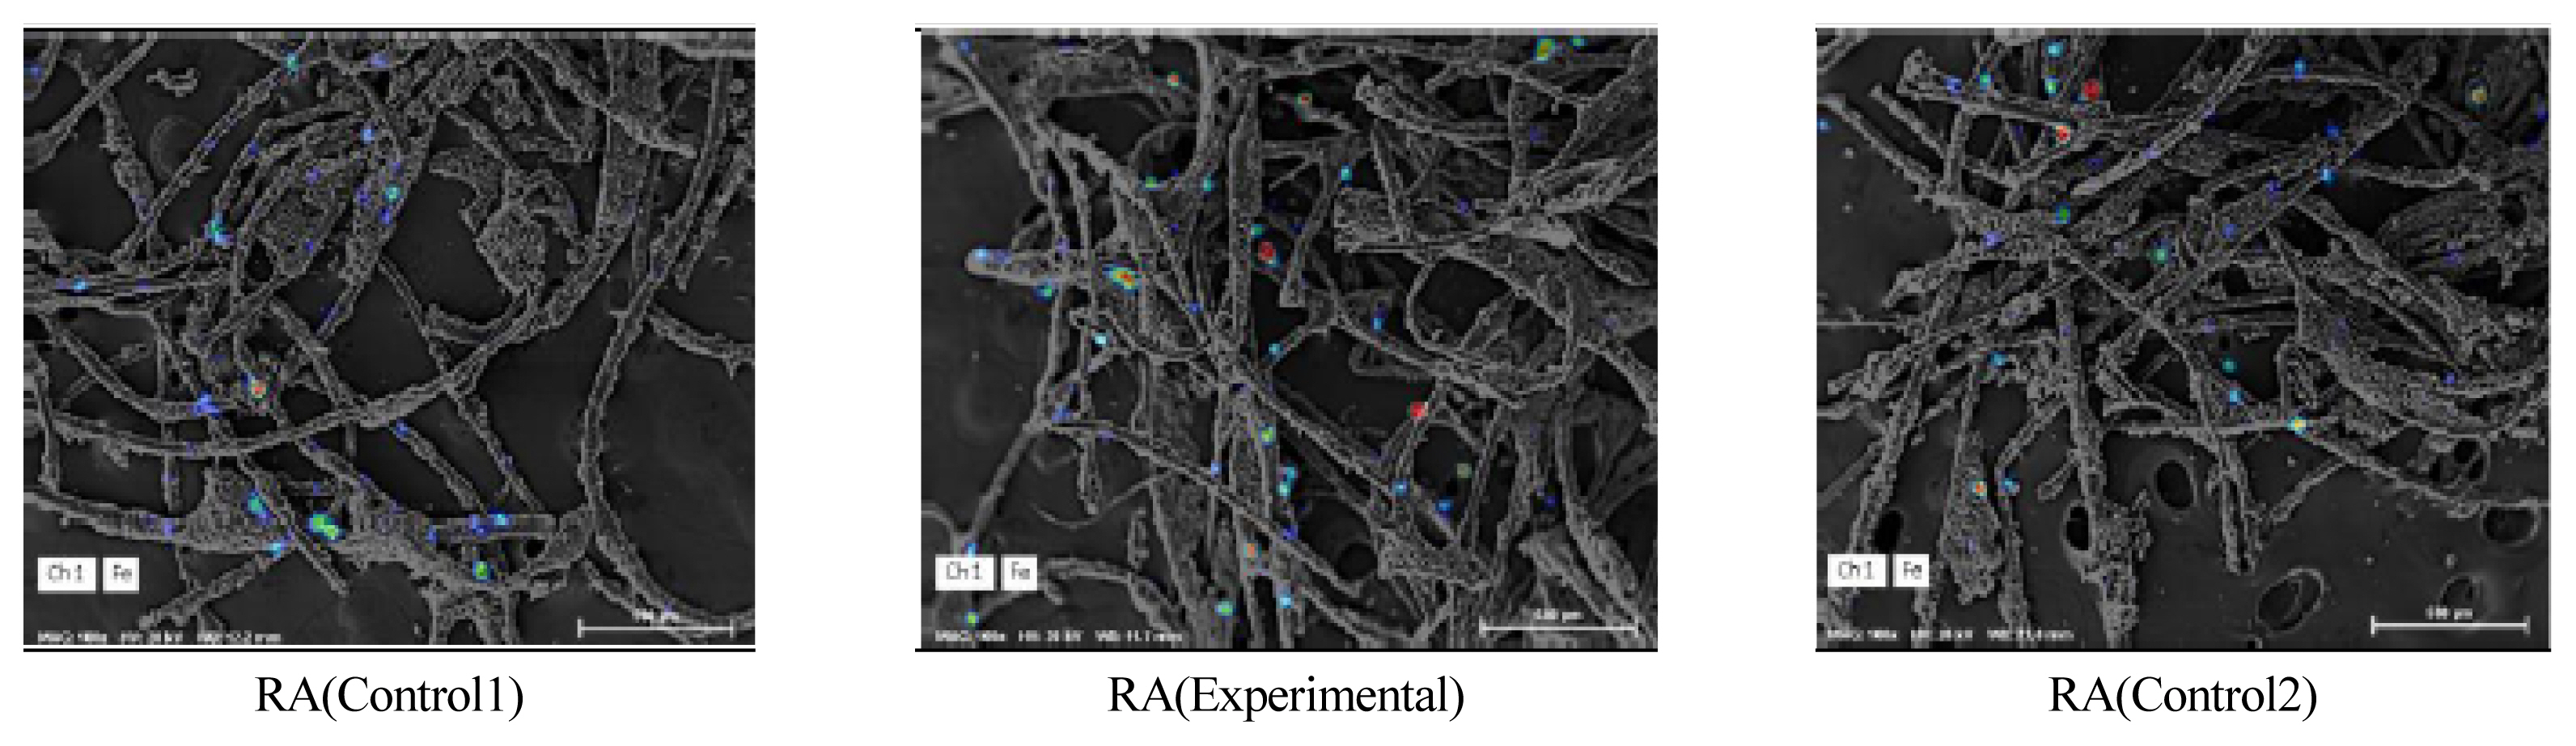
Fe analysis of return air, using SEM-EDS.
Comparative analysis of chemical-species reduction
Based on an SEM-EDS-based large-area analysis at 100× magnification, there were significant differences in the AWRs of Fe between the experimental group with both plants and waterings applied, Control 1 without plants and waterings, and Control 2 with only waterings applied. The highest and lowest AWRs of Fe were found to be 3.28 wt% in R.A. samples and 0.25 wt% in S.A. samples, respectively, resulting in a reduction of approximately 92%, when plants and waterings were applied (Table 1.). This seems to be in line with the findings of the previous study that the AWR of Fe in S.A. samples converged to 0 wt% through a SEM-EDS-based chemical species analysis. On the other hand, the AWR of Control 1 was 0.51 wt% for R.A. samples, but was 0.28 wt% for S.A. samples, indicating a reduction of approx. 45% when plants and waterings were not applied. The AWR of Control 2 was 1.37 wt% for R.A samples, but was 0.55 wt% for S.A. samples, showing a reduction of approx. 60% when only waterings were applied (Fig. 7, Fig. 8).
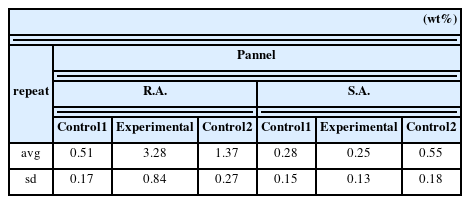
Statistical analysis of the weight ratio(wt%) of Fe in return air and supply air
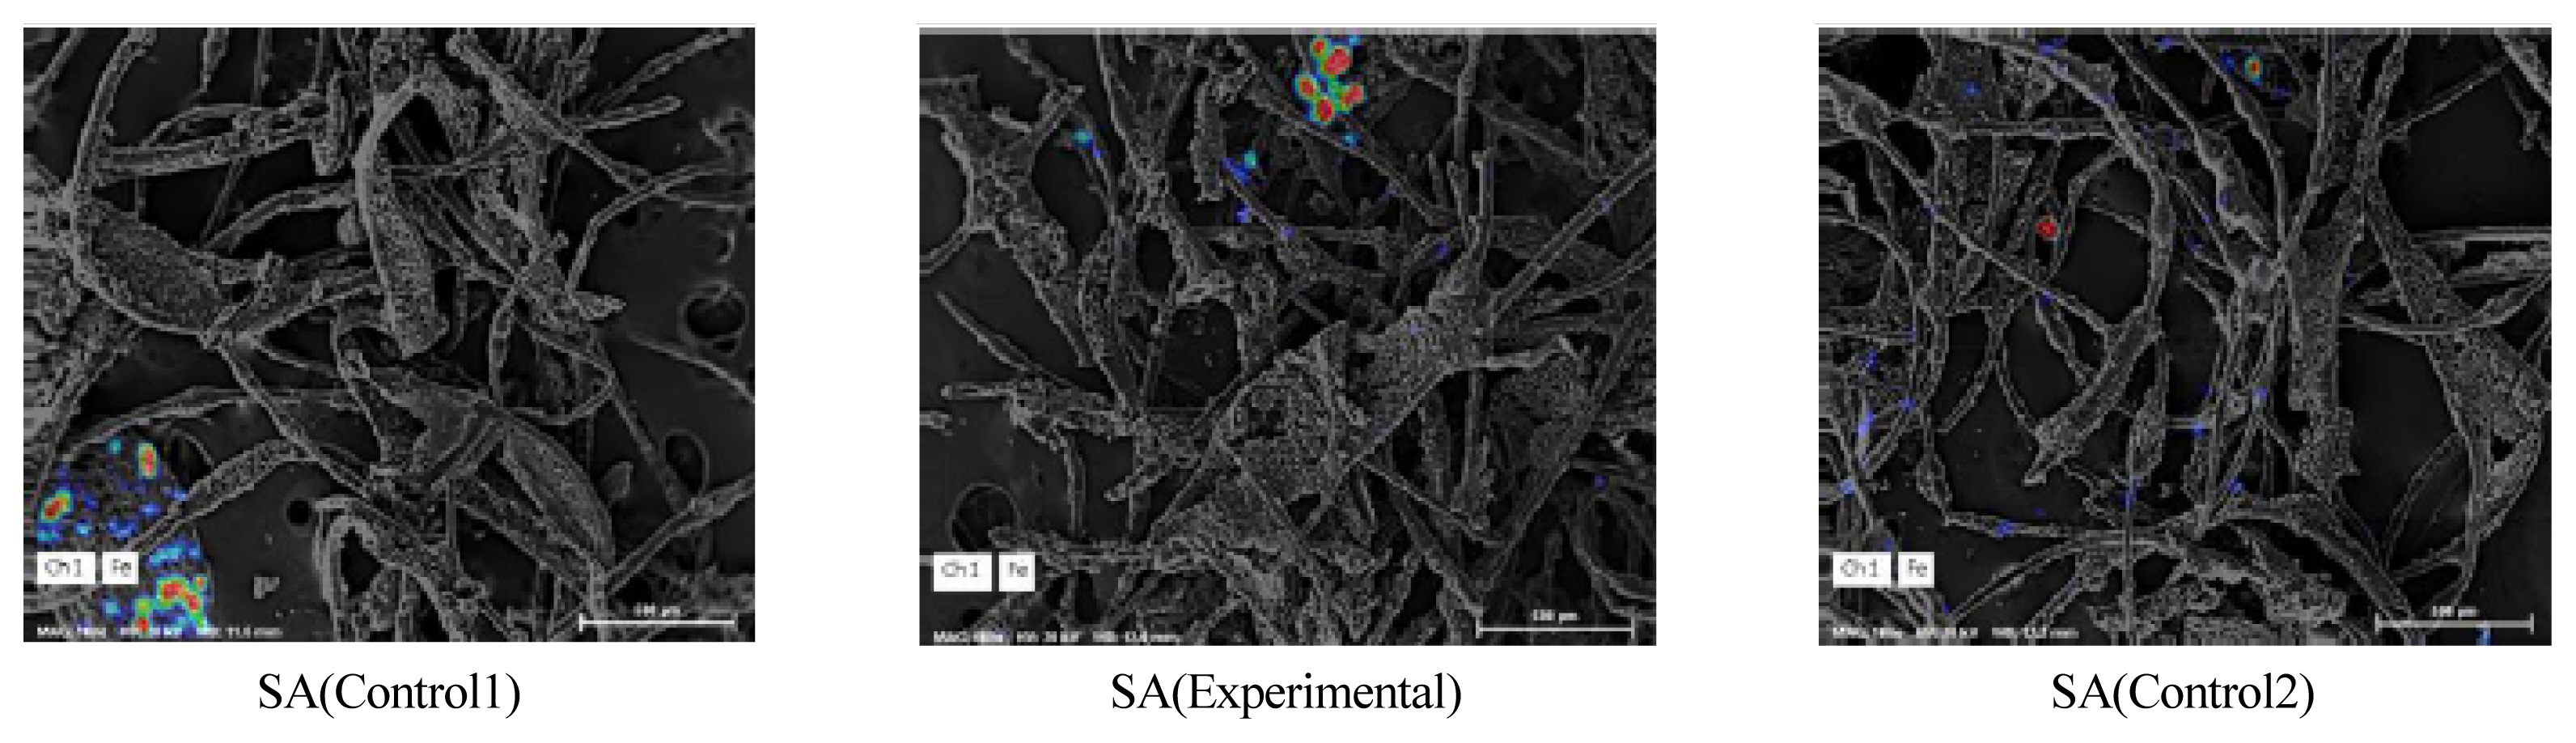
Fe analysis of supply air, using SEM-EDS.
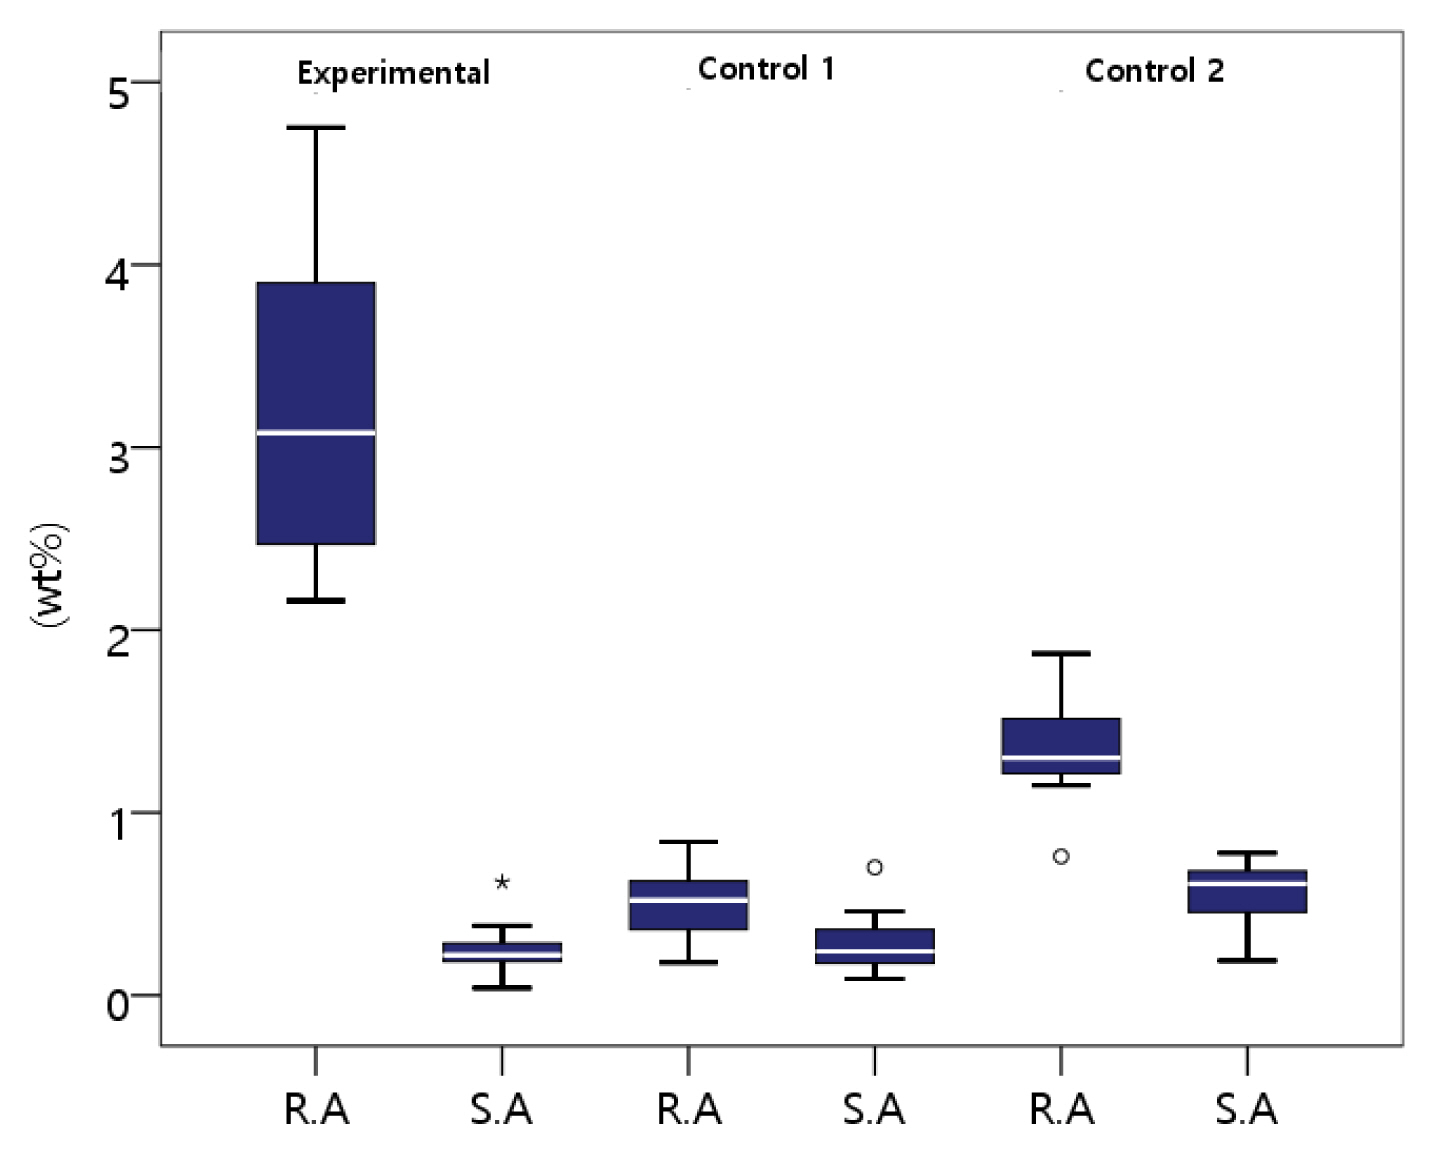
Comparison of average weight ratios for Fe between R. A. and S.A. samples of each group.
Conclusion
In this study, chemical species of PM depending on whether waterings and plants were applied to the vegetation biofilter system installed in underground subway station A in Seoul were analyzed. The findings can be summarized as follows.
For pre-filters with the same specifications applied to the vegetation biofilters, the AWR reduction of Fe was found to be half or less than that for the filters with plants and waterings applied. This enabled us to infer a correlation between micronized iron oxide and vegetation growth. Fe, an essential element for plant growth, has been found to be reduced by the physiological action of plants, along with heavy metals including Cu, Co, Mo, and Zn, which are toxic to the human body. In particular, Fe has been reported to increase the yield of P. heterophylla, a C3 plant, in the form of Fe3O4, nanoparticles that combine oxygen and Fe at appropriate concentrations. In addition, since plants prefer and accumulate heavy metals such as Cu, Ni, As, and Zn for their growth, they can be effectively used for purification mechanisms. However, since advanced measures for phytoremediation strategies, including plant transformation, have been proposed for large-scale application due to the limitations of plant individuals (Sarwar et al., 2017), further research related to these is required (Sarwar et al., 2017).
The concentration of PM was found to soar during commuting hours when the floating population increased rapidly. Such a change in concentration may be related to indoor environmental factors in addition to the floating population. A study that examined the relationship between the temperature and humidity in indoor classrooms and the air quality found that the diffusion of PM has the highest correlation with outdoor temperature (24–30°C), followed by relative humidity (71–84 RH%), and wind speed (0.23–0.92 m/s; Chithra and Nagendra, 2014). On the other hand, this study site was an underground subway station isolated from the external environment, the relative humidity of which was also recorded at around 50 RH%, so it seems that the temperature and humidity did not significantly contribute to the concentration of PM.
Although various previous studies have reported that Fe is reduced by the physiological action of plants (Lee and Chon, 2004; Li et al., 2021), this study was limited when it came to considering the clear causal relationships and correlations with indoor environmental variables. Therefore, it is necessary to further examine why the AWR of Fe obtained from samples of the experimental group with plants and waterings applied was significantly higher than that estimated from samples of the control groups. In addition, the monitoring period of 8 days may be limited to adequately analyze the changes in particulate pollutants. Since samples obtained based on a single-event sampling have limited use when it comes to interpreting time-series changes, these limitations should be addressed through follow- up studies.