An Analysis of Preference for Potted Houseplant Products Using a Conjoint Analysis Method for the Development of Pet Plant Products
Article information

Abstract
Background and objective
Recently, social interest in indoor plants (houseplants) has been increasing. This study was conducted to determine consumer preferences for houseplants by surveying their perception of houseplants, also referred to as “pet plants” using a conjoint analysis method.
Methods
For the conjoint analysis, Attribute 1 was defined as the type of houseplants, which was divided into four levels: orchids, oriental orchids, general foliage plants, and variegated foliage plants. Attribute 2 was set as the shape of pots and was classified into two levels: square and round. Attribute 3 was set as the material of pots, and was divided into four levels: earthenware, ceramic, plastic and onggi (Korean style earthenware). Sixteen profiles were extracted through the orthogonal design using the SPSS Statistics. The survey was conducted online in December 2021, and the responses of 320 out of 332 respondents were analyzed, after unclear responses were excluded.
Results
A conjoint analysis of the preference for houseplant products was conducted using part-worth function models. When purchasing houseplants, it was found that the material of pots (53.0%) was considered as the most important attribute, followed by the type of plants (34.0%), and the shape of the pots (13.0%) (Pearson’s R = .991, p = .000). Foliage plants (part-worth utility = .143) for the type of plants, round shape (part-worth utility = .056) for the shape of pots, and ceramic (part-worth utility = .284) for the material of pots were preferred as a priority. Clusters with similar part-worths were established using the coefficients representing the estimated part-worths for each attribute derived from a conjoint analysis, as a variable. Cluster 1 was a group of 153 people that had 109 females (36.6%), 68 people in their 50s (22.8 %), 59 bachelor’s degree holders (19.8 %), and 42 workers in flower business (14.1 %) as the majority for each demographic item. They preferred variegated foliage plants in round-shaped ceramic pots. Cluster 2 was a group of 104 people with 71 females (23.8%), 44 people in their 50s (14.8%), 47 bachelor’s degree holders (15.8%), and 30 flower-related industrial workers (10.1%) for the largest share. They preferred foliage plants in round-shaped earthen pots. Cluster 3 was a group of 41 people with 32 females (10.7%), 17 people in their 50s (5.7%), 25 bachelor’s degree holders (8.4%), and 9 office workers (3.0%) and 9 workers in flower businesses (3.0%) for the largest share. They preferred general foliage plants planted in round-shaped ceramic pots.
Conclusion
In this study, consumers’ perceptions of pet plants were confirmed. The findings can be used as basic data for the development of pet plant products, which is likely to aid houseplant producers in creating new income sources, giving positive effects to differentiated plant producers and flower shops.
Introduction
Urbanization has led modern people to live in spaces with insufficient green coverage area, and despite their diversified lifestyles, to spend most of the day indoors (Oh et al., 2010). Outdoor air is polluted with particulate matter, yellow dust, and smog (Kim et al., 2019), and indoor air, where 90% of daily life is spent, is also polluted with volatile organic compounds, microscopic dust, ozone, and carbon dioxide, threatening the health of people today (Lee et al., 2017). With the recent rise in the number of single- person households and the advent of the pandemic era, changes in the living environment where indoor activities increase bolster the importance of leisure activities using plants and mental wellness (Hwang et al., 2021).
As people’s interest in houseplants increases, the new term “pet plants” has emerged, meaning plants that live together with us, like companion animals. The emergence of this term indicates that the number of members of society and the social interest in obtaining psychological satisfaction through emotional connection with plants has increased. In the contactless era, people feel comforted by communing with pet plants, reducing their depression and negative emotions, and increasing their vitality. In addition, indoor plants offer the effects of interior decoration and air purification (Do, 2022).
Research on houseplants has included studies on environmental conditions and cultivation methods (Jeong et al., 2017), as well as studies on their environmental function that consider their indoor air purification effects, including studies on formaldehyde removal effects (Kim and Yoo, 2011; Park et al., 2008), PM removal effects (Ahn et al., 2022; Kwon and Park, 2018; Park et al., 2008; Jung and Oh, 2013), carbon dioxide removal effects (Oh et al., 2010; Park et al., 2010) and benzene removal effects (Hong and Park, 2000). Gardening activities using plants significantly reduced stress, anxiety, and depression in depressed patients (Song et al., 2010), while raising pet plants was effective in helping develop emotional intelligence, including young children’s using of their own emotions, and realizing and caring for others’ emotions (Hong and Kim, 2022). Various studies have been conducted on the environmental, psychological, and physical effects of plants on single-person households, including the suggestion of planterior for air purification and psychological relaxation (Ahn and Jeong, 2021; Lim and Kim, 2018). There have also been studies on distribution and consumption, including a comparison of the distribution status of foliage plants and orchid species (Park et al., 2006) and a study on preferences for shape and color of indoor foliage plants (Seo et al., 2009). Most of the above are studies on the effectiveness of plants on their own, and research on consumption behavior around houseplants, which are receiving attention as “pet plants,” is still insufficient.
Conjoint analysis is a representative method of analyzing consumer’s utility in market research. The analysis technique assumes that the products to be marketed have attributes that are considered to be important and that each attribute can have several levels of utility, estimates the utility given by customers to the attributes that the products have, and predicts which products customers will choose (Lee et al., 2016). In general, conjoint analysis has been widely used in market research, but it has also been used as a research tool for estimating socio-scientific values, including in A Study on Improvement Plans of Terrestrial Broadcast Advertising System using Conjoint Analysis (Jang et al., 2015) and An Analysis on the Preference of Early Childhood Teachers in Horticultural Activities based on Conjoint Analysis (Jeong et al., 2020).
This study was conducted to examine user preferences for houseplants by surveying the perception of house plants given the increased social interest in “pet plants” using a conjoint analysis method, with the goal of providing basic data for pet plant product development.
Research Methods
Survey design
A conjoint analysis method was used for a survey. Attributes and levels were defined for the conjoint analysis. Attribute 1 was set as the type of houseplants. The types of houseplants were divided into four levels: general foliage plants, patterned foliage plants, Oriental orchids, and western orchids, referring to the types of house plants commonly presented in previous studies, including National Competency Standards (NCS) Learning Module-Purchase of Plants Used in Floral Design (Ministry of Education, 2018); A Comparative Study on the Distribution Status of Foliage Plants and Orchid Species at the Floral Joint Market in Yangjae-dong, Seoul (Park et al., 2006); An Analysis of Changes in Preference for Patterned Foliage Plants, and Color Harmony (Kim and Seo, 2021). Attribute 2 is the shape of pots, which was divided into two levels, square and round pots, referring to the shapes of pots presented in a survey on consumers’ preference for packaging containers for flowering plants put in mini pots (Lee et al., 2017). Attribute 3 is the material of pots, which was divided into a total of 4 levels; by selecting earthen, ceramic, and plastic pots among the material of pots shown in NCS Learning Module-Purchase of Plants Used in Floral Design (Ministry of Education, 2018); excluding stone pots that are not available in the market, glass pots without no drainage holes that are not appropriate for planting, and fiber-reinforced polymer (FRP) planters; and adding onggi, an eco-friendly pot with the aspects and characteristics of the onggi kiln in Bongsan-ri, Cheongju operated in the modern era (Kim, 2020; Table 1).

Selection of attribute and levels for conjoint analysis
Profile extraction
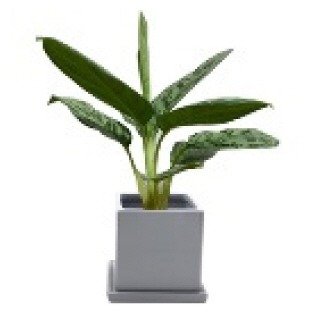
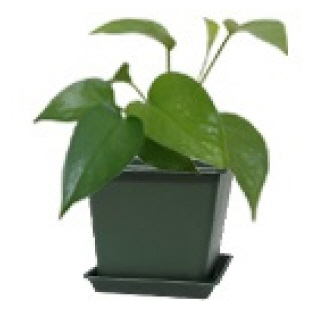
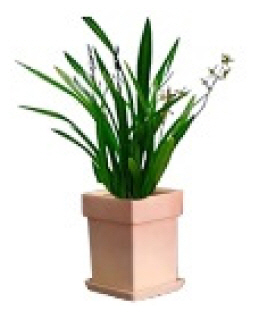
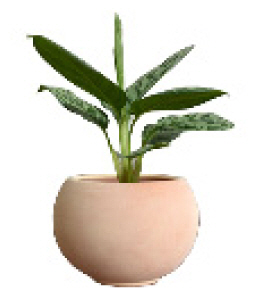
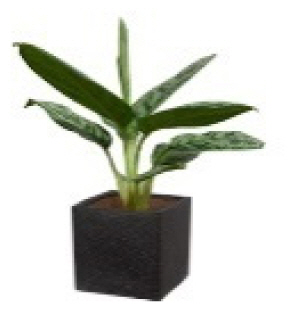
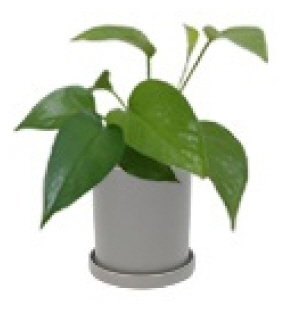
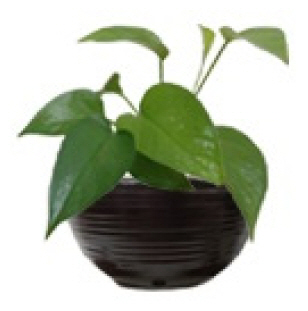
The total number of cases of profiles that could be presented for the survey was 32 based on the main attributes (the type of houseplants, and the shape and material of pots) and each attribute level (4 × 2 × 4). However, having respondents evaluate their preferences for all these profiles imposes a high burden on respondents and makes accurate evaluation difficult. Accordingly, to reduce the total number of stimuli, after extracting 16 profiles using the orthogonal design of IBM SPSS Statistics, version 19.0, the material of pots and the images of plants were collected from open sources on the portal site Naver, and then the images were edited using Adobe Photoshop CS6 and combined with the related data (Table 2).

Profile extraction and reference image presentation for a preference survey of pet plants.
Survey and statistical analysis
A preference survey of potted houseplant products using the conjoint analysis method was conducted using Naver Form, an online survey tool form based on social networking services, over a one-month period from December 1 to 30, 2021. The 16 profiles extracted were schematized by combining edited images, and presented with an explanation added. We had the respondents evaluate their preference on a five-point scale: 5 points = strongly preferred; 4 = preferred; 3 = neutral; 2 = not preferred; and 1 = least preferred. Of the 332 survey responses, 320 responses were analyzed, after 12 that included unclear or insincere answers were excluded. The statistical analysis was performed using IBM SPSS Statistics Version 11.0. For demographic statistics, a frequency analysis was performed. In general, a part-worth function model for each attribute is used to estimate a part-worth for each attribute level (i.e., level utility); in the shape of utility plots representing part-worths estimated, it is determined whether the relationship between attributes and utility is linear or curved. Based on this, a suitable model for each attribute is selected and used (Kim and Kim, 2022). In this study, a conjoint analysis was also performed using part-worth function models, and then the model’s adequacy was checked. In addition, by setting the utility of each attribute as a variable, clusters were established based on the similarity of part-worths, and preferences were analyzed for each demographic variable of respondents belonging to the clusters.
Results and Discussion
Demographic distribution
For the gender of respondents, females and males accounted for 70.9% and 29.1%, respectively. For age group, those in their 50s accounted for the majority at 43.8%, followed by those in their 40s (23.1%), those in their 60s or older (15.6%), those in their 20s (9.4%), and those in their 30s (8.1%). For educational background, bachelor’s degree holders accounted for the largest group at 43.4%, followed by 22.2% for associate-degree holders, 16.9% for master’s degree holders, 7.2% for doctoral degree holders, and 10.3% for others; others included high school graduates and college students. For occupation, workers in flower businesses was the most common at 28.4%, followed by others (16.9%), housewives (16.3%), office workers (14.1%), service workers (10.3%), students (9.1%), and government employees (5.0%); others included the unemployed and researchers (Table 3).
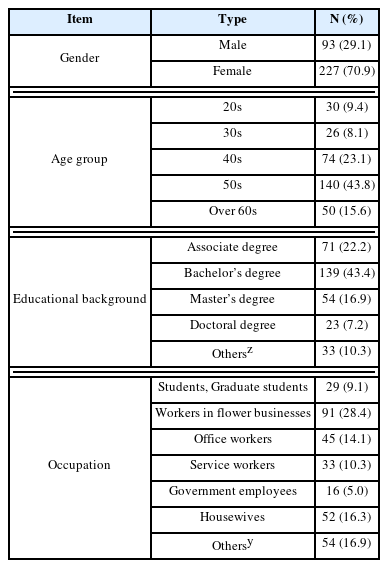
Classification of survey respondents (N = 320)
Preference for potted houseplant products based on a conjoint analysis
In this study, a conjoint analysis was performed using part-worth function models to derive a value (utility) for each attribute level. By analyzing their preference for potted houseplant products, it was found that 53.0% of the respondents considered the material of the pots as the most important attribute, followed by the type of plants (34.0%) and the shape of pots (13.0%). As for preference by each attribute level, ceramic (part-worth utility = .284) was found to be the most preferred for the material of pots, followed by general foliage plants (part-worth utility = .143) for the types of plants, and round (part-worth utility = .056) for the shape of pots (Fig. 1). It was examined whether the conjoint analysis results derived in this way had significant explanatory power; Pearson’s r value, which is the parametric correlation between the response ranks and the utility estimates (ranks) for the attribute profiles when the preference evaluation for the conjoint profiles was converted into a quantitative scale, was .991 (p = .000), indicating that the model’s adequacy was verified. In addition, the larger Kendall’s tau, which represents the non-parametric correlation between response ranks and utility estimates (ranks) for attribute profiles, the higher the explanatory power of the models. In this study, Kendall’s tau value was .879 (p=.000), indicating that the model was adequate.

Preference for potted houseplant products based on a conjoint analysis.
{Pearson’s R = .991(p = .000), Kendall’s tau=.879(p = .000)}
The preference in terms of the shape of pots was found to be different from the findings of an earlier study on consumer preference for packaging material and containers (Lee et al., 2017); they reported that for mini potted flowering plants, angular shape was preferred the most at 62.5% of the respondents, followed by round shape (26.1%), and any shape (11.4%). The research of Lee et al. (2017) surveyed consumers’ preference for the shape of pots for pack-aging without suggesting specific plants, but this study performed a preference survey that specifically presented four levels of plants for potted houseplant products, so it seems that the results were different from theirs. Thus, for the development of potted plant products, general foliage plants in round pots made of ceramic material were derived as the optimal combination to maximize consumer’s utility.
Preference for potted houseplant products by age group
In terms of the preference for potted houseplant products by age group, it was found that all age groups regarded the material of pots as the most important (Table 5). Specifically 66.7% of respondents in their 20s, 76.1% of respondents in their 30s, 71.7% of respondents in their 40s, 69.2% of respondents in their 50s, and 59.0% of respondents in their 60s or older responded that the material of pots was important. For preference for each level of the material of pots, respondents in their 20s (part-worth utility = .284), 30s (part-worth utility = .503), 50s (part-worth utility = .293), and 60s or older (part-worth utility = .234) preferred ceramic pots, whereas respondents in their 40s preferred earthen pots (part-worth utility=.308).
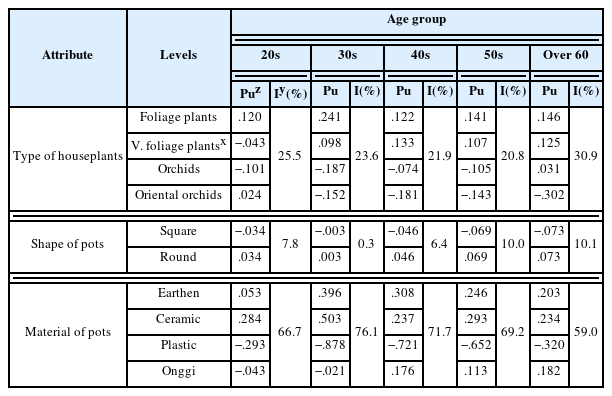
Preference for potted houseplant products by age group
In a study on the difference in life satisfaction and perception of growing plants depending on whether they grow houseplants, Kim et al. (2019) found that the older the survey respondents, the higher their interest in quality of life, life satisfaction, plants, and houseplants. In this study, the importance of the type of plants was evaluated at 25.5% for those in their 20s, and 30.9% for those in their 60s or older, but there were no positive correlations according to age groups.
Preference for potted houseplant products by educational background
In terms of the preference for potted houseplant products by educational background, the material of pots was considered as the most important attribute across all educational backgrounds (Table 6). Differences in pot material preference were shown for each level of educational background; earthen pots were preferred among associate-degree holders (part-worth utility = .347), ceramic pots among bachelor’s degree holders (part-worth utility = .302), earthen pots among master’s degree holders (part-worth utility = .343), ceramic pots among doctoral degree holders (part-worth utility = .472), and ceramic pots for others (part-worth = .305).

Preference for houseplant products by education background
In a study on differences in life satisfaction and perception of growing plants according to whether the respondents grow houseplants (Kim et al., 2019), the researchers reported that interest in plants and houseplants was higher among those with post-graduate degree or higher than among those with a high-school diploma or lower. For the importance of the type of plants in this study, the higher the level of education the respondents had, the higher they evaluated the importance: 20.6% of associate-degree holders, 22.2% of bachelor’s degree holders, 22.3% of master’s degree holders, and 31.2% of doctoral degree holders. This is in line with the findings of Kim et al (2019).
Preference for potted houseplant products by occupation
In terms of preferences around potted houseplant products by occupation, the material of pots was regarded as the most important by those in all occupations (Table 7). There was a difference in the preference for each level of the material of pots according to occupation; students (part-worth utility = .200), office workers (part-worth utility = .306), service workers (part-worth utility = .284), housewives (part-worth utility = .349), and others (part-worth utility = .282) preferred ceramic pots, whereas workers in flower businesses (part-worth utility = .282) and government employees (part-worth utility = .337) preferred earthen pots.
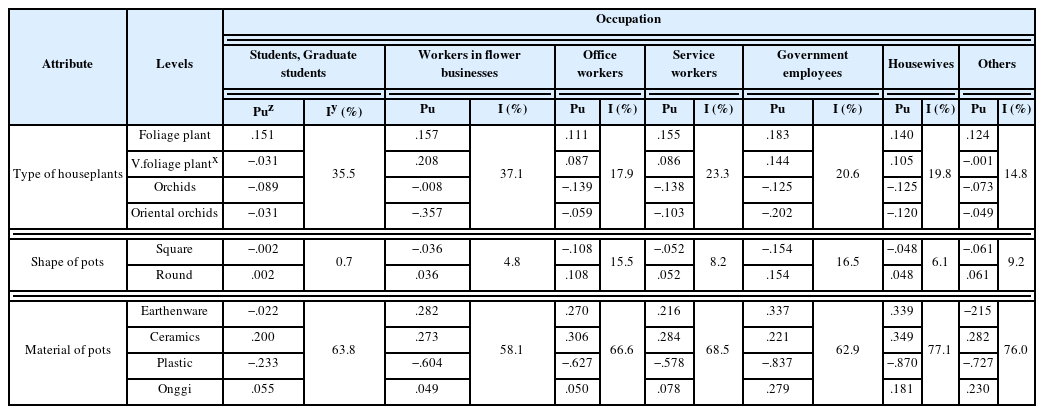
Preference for houseplant products by occupation
Cluster analysis using conjoint utility as a variable
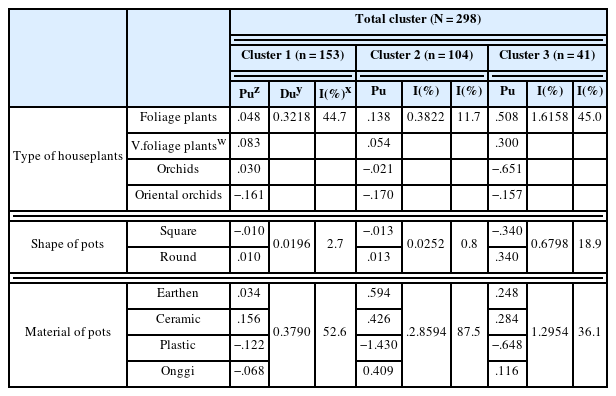
Clusters with similar part-worths were formed using the coefficients representing the estimated part-worths for each attribute derived from a conjoint analysis as a variable, and then preferences were analyzed for each demographic variable of respondents falling under the clusters (Table 8). Consequently, after 22 were excluded from the total respondents, the 298 respondents were classified into 3 clusters. Cluster 1 included a total of 153 people, and demographic types accounting for the largest share were as follows: 109 females (36.6%) for gender; 68 people in their 50s (22.8%) for age; 59 bachelor’s degree holders (19.8%) for educational background; and 42 workers in flower businesses (14.1%) for occupation. Cluster 2 consisted of a total of 104 people, and demographic types accounting for the largest share were as follows: 71 females (23.8%) for gender, 44 people in their 50s (14.8%) for age, 47 bachelor’s degree holders (15.8%) for educational background, and 30 workers (10.1%) in flower businesses for occupation. Cluster 3 was composed of 41 people and demographic types accounting for the largest share were as follows: 32 females (10.7%) for gender, 17 people in their 50s (5.7%) for age group, 25 bachelor’s degree holders (8.4%) for educational background, and 9 office workers (3.0%) and 9 workers in flower businesses (3.0%) for occupation.

Cluster analysis with conjoint utility as a variable
The preference for potted houseplant products by cluster was shown in Table 9. For Cluster 1, the importance of preference for the material of pots, type of houseplants, and shape of pots was estimated to be 52.6%, 44.7% and 2.7%, respectively. Ceramic pots was estimated as the highest for the material of pots (part-worth utility = .156); variegated foliage plants (part-worth utility = .083) for the type of plants; and round pots (part-worth utility = .010) for the shape of pots (Table 9). Regarding the importance of preference for Cluster 2, the material of pots was found to be the highest at 87.5%, followed by the type of houseplant (11.7%) and the shape of pots (0.8%). By attribute, earthen pots (part-worth utility = .594) were preferred as the material of pots; general foliage plants (part-worth utility = .138) as the type of houseplants and round shape (part-worth utility = .013) as the shape of pots. As for the importance of preference for Cluster 3, the type of houseplants was the highest at 45.0%, followed by the material of pots (36.1%) and the shape of pots (18.9%). By attribute, general foliage plants (part-worth utility = .508) were preferred for the type of houseplants; ceramics (part-worth utility = .284) for the material of pots; and round shape (part-worth utility = .340) for the shape of pots (Table 9). There were no significant demographic differences between clusters. However, in Cluster 2, which had an educational background in which bachelor’s degree or master’s degree holders account for the largest group, it seems that they prefer general foliage plants in round-shaped earthen pots. In Cluster 1, in which workers in flower businesses, housewives, and others accounted for the largest group by occupation, it appears that they prefer variegated foliage plants in round-shaped ceramic pots. In addition, for Cluster 3, in which the ratio of office workers and workers in flower businesses was found to be the same, it seems that they prefer general foliage plants in round-shaped ceramic pots. Based on this, different marketing strategies can be established for each cluster.
Preference for houseplant products by cluster
Conclusion
This study was conducted to provide basic data for the development of pet houseplant products by performing a survey to assess the perceptions of pet plants and potted houseplant products, in which social interest has been growing, using a conjoint analysis method. Consumer preference for houseplants was surveyed through conjoint analysis, a social scientific approach, and the attributes and levels were established to analyze actual consumption behavior. Attribute 1 was the type of houseplants, and was classified into four levels; Attribute 2 was the shape of pots, and was divided into two levels (angular and round shapes); Attribute 3 was the material of pots, and was divided into a total of 4 levels (earthen, ceramic, plastic, and onggi material). Orthogonal design was used to extract 16 profiles in IBM SPSS Statistics. A survey was conducted online in December 2021. The responses of 320 of the 332 respondents were analyzed, with unclear responses excluded. The demographic distribution of respondents consisted of 93 males (29.1%) and 227 females (70.9%). The most common age group was in their 50s (43.8%); bachelor’s degree holders (43.4%) for educational background and workers in flower businesses (28.4%) for occupations accounted for the largest share. A conjoint analysis of the preference for potted houseplant products using part-worth function models found that when purchasing houseplants, the material of pots (53.0%) was considered as the most important attribute, followed by the type of plants (34.0%) and the shape of pots (13.0%) (Pearson’s r = .991, p= .000, Kendall’s tau= .879, p= .000). Foliage plants (part-worth utility= .143) for the type of plants, round shape (part-worth utility= .056) for the shape of pots, and ceramic (part-worth utility= .284) for the material of pots were preferred as a priority.
Clusters with similar part-worths were formed using the coefficients representing the estimated part-worths for each attribute derived from a conjoint analysis, as a variable. Cluster 1 consisted of 153 respondents with 109 females (36.6%), 68 people in their 50s (22.8%), 59 bachelor’s degree holders (19.8%), and 42 workers in flower businesses (14.1%) representing the largest share by demographic item. They preferred variegated foliage plants in round-shaped ceramic pots. Cluster 2 included 104 people with 71 females (23.8%), 44 people in their 50s (14.8%), 47 bachelor’s degree holders (15.8%), and 30 workers in flower business (10.1%) representing the largest share. They preferred general foliage plants in round-shaped earthen pots. Cluster 3 consisted of 41 people with 32 females (10.7%), 17 people in their 50s (5.7%), 25 bachelor’s degree holders (8.4%), and 9 office workers (3.0%) and 9 workers in flower businesses (3.0%) representing the largest share, and they preferred general foliage plants in round-shaped ceramic pots. Based on this, different marketing strategies can be established for each cluster.
This study has significance in that from the consumer’s point of view, it is not only confirmed that they are interested in the material and shape of pots as well as the type of houseplants, but basic data is also provided to aid in establishing marketing strategies to promote consumption of pet houseplants by segmenting the market, since there are differences in consumer preferences according to age group, educational background, and occupation. This suggests that the promotion of consumption of pet houseplants requires research on the material and shape of pots as well as the type of plants. In the future, it seems that additional research is needed on the perception of pet plants, as well as on preference for types of plants and the material and shape of pots.