The Role of Visual Communication in Community Participation on Developing A Climate Adaptation Plan
Article information

Abstract
Background and objective
Community participation or participatory planning are two terms used interchangeably that aim to incorporate community residents’ opinions in the planning process to get the maximum benefit. This approach aims to gather stakeholders and engage them in a meaningful conversation to come to a decision representing the stake for everyone involved. This study focuses on the impacts of photorealistic visualization on community participation in the U.S. Great Lakes Region through a 5-year long (2017–2022) climate adaptation planning project conducted in Marquette County, Michigan, USA.
Methods
Using the deliberation with analysis method of public participation, supported by visualizations, and followed by post-project surveys, the study explores how visualizations can improve in disseminating knowledge, bridging the gap of understanding among participants, enhancing engagement and delivering consistent approaches in the community decision-making process to come to a mutual ground of trust and common interest.
Results
The study reveals that visualizations used at different phases of the community participation process increased participants’ interest and engagement during the meeting, provided them with the necessary knowledge regarding climate change and its negative impact on health, and assisted them in decision-making and prioritizing design goals. The study also reveals that the visuals enhanced the project participants’ engagement beyond the project’s scope in future planning endeavors and increased their inclination towards climate and health adaptation planning.
Conclusion
These findings will play a significant role in shaping the adaptive capacity in rural nonagricultural communities and strengthening the decision-making for similar areas dealing with climate change and its consequences.
Introduction
Over the past few decades, community participation (CP) has gained significance in the academic literature and policy documents as a vital element of the planning process. CP has the scope of learning from the experience and knowledge who live within the context and area in question, whom Meroni calls “professionals of every day.” (Meroni, 2007). Public participation in planning and design allows planners and designers access to community expertise and local knowledge, which invariably produces better plans and designs. It also fosters social learning by creating circumstances where a diverse group can unite to discuss multifaceted societal and environmental issues and values (Crawford et al., 2018). Though community participation has become commonplace in many planning efforts, citizens and planners often evaluate the process as unsatisfactory (Maginn, 2007). The current theories render the argument on conducting a meaningful dialogue during a community participation process, the planner’s role, and how to diminish/reduce the knowledge and power gap during a conversation. Innes and Booher claimed that meaningful dialogue encompasses key stakeholders who are aware of the fact that their opinion and agreement matter, who believe that the task of collaboration among other parties bears significance, everyone’s voice is heard and valued, and the planners are in the role to bridge the knowledge gap among participants (Innes and Booher, 2010). According to Machler et al., the role of planners in CP is to bring multiple parties together who have a vested interest in the problem on the table and navigate a process where adaptable, lasting, meaningful solutions to the issue may come up in a collaborative way (Machler et al., 2015). Planners play the role of shaping the perception of the participants by picking selective words and selective information. Innes suggested planners to be consciously reflective and reflect on how their ways of communication and framing a problem to the audience might misrepresent information and hence strengthen power imbalances (Innes, 1998; Innes, 1995).
There are many ways to understand the types of community participation, such as Sherry Arnstein’s ladder of Citizen Participation, where the author stated, “The idea of citizen participation is a little like eating spinach: no one is against it in principle because it is good for you” (Arnstein, 1969). Based on this principle, community participation can be broadly categorized as informative, preparatory, and decision-making participation, counting on the residents’ degree of involvement (Lane, 2005). For meaningful community engagement in a community, a balanced combination of these three forms might bring the most desired result (Mapita, 2022). In the informative participation, the public is being informed about the upcoming changes, procedures, and government plans related to urban planning in their area. The benefit of this engagement is to increase public buy-in and transparency, which mitigates planning conflicts. The planners and people concerned with facilitating this type of engagement should carefully choose inclusive language to disseminate the information to people from different backgrounds and to non-experts. In the second type of engagement, preparatory and planning participation, the public provides their input on ongoing issues, shares ideas, and gives feedback for the proposed development and future projects (Reynolds, 1969). The residents become an active part of the planning process with their valuable information regarding the locality. In decision-making participation, the residents hold power to decide about future planning initiatives and the usage of resources.
In each type of CP, consensus building out of meaningful dialogue is crucial and considered the primary goal. While Habermas expanded on why CP is essential in planning (Mattila, 2020), Fisher and Ury in 1981 provided a framework on “how” the negotiation and facilitation centered around community participation may be applied to build consensus (Fisher and Ury, 1991). However, when there is no visible output or strong agreement from a community participation process, the process might have intangible benefits, such as new or stronger professional and personal relationships, genuine communication, trust build-up, and combined problem-solving (Healey, 1992). With visual communication components in CP, stakeholders also build shared intellectual capital, including shared definitions of the problem and mutual understanding of each other’s interests, and eventually, it reduces scopes of conflict.
Since the 1990s, when sustainable development and climate change issues came to the forefront, constructive discussion among the residents of different communities through CP got a push from a different dimension. Researchers acknowledged that since the larger climatic and environmental problems affect human beings worldwide, it needs to be addressed globally through a diverse group of experts. Also, they addressed that it was difficult for mass people to find a comprehensive solution for climatic and environmental problems to fix the issues since they were not aware of the severity of the problems in the first place (Clark and Dickson, 2003; Swart et al., 2004). At this point, in different types of community participation, theorists emphasized ways of transmitting information that would convince people about the problem and bridge the knowledge gap during a community participation process. Tornorth and Al-Kodamany expanded on using different hands-on methods and visualization to disseminate ‘difficult to communicate’ issues, gain public trust and organize conversations where participants learn, feel valued, and attached to the problems identified (Al-Kodmany, 2001; Törnroth et al., 2022).
Combining the knowledge of the surrounding, Tornroth et al. (2022) provided a framework to produce the desired outcome from a community participation process. In the process, the authors expanded on how freehand sketching plays a pivotal role in expressing participants’ concerns and ideas and discussing alternative solutions in a more collaborative, analytic, and organized way. The author argues this process allows richer and broader citizen engagement in the urban development process (Törnroth et al., 2022). Al-Kodmany used different visualization modes, including freehand sketching, GIS maps, and three-dimensional visualizations. He argues that different modes are appropriate for different stages of the community participation process (Al-Kodmany, 1999). Visualizations have also been used to establish design goals and modules and quantify the environmental, social, and economic benefits for CP based planning projects (Yang et al., 2020). Visualizations are especially beneficial to display the change in the built environment in an urban framework and how intervention in the built environment can impact climate change (Arnold et al., 2021).
While using visualization to lead a conversation may also not produce the best or strong consensus in CP, the iterative loop with visualization provides an open platform to hear different voices and alternative solutions (Al-Kodmany, 2001). This way, the planning and design proposals are refined until they reflect a consensus of preferences held by the various stakeholders involved. Visualizations provide an equal platform for everyone to participate and surpass the knowledge gap among participants by presenting complex issues comprehensively. Visualization is a key to effective public participation because it is the only common language to which all participants, technical and non-technical, can relate (DeCock-Caspell and Vasseur, 2021).
This study focuses on the impacts of visualizations in CP based decision-making process with a real-world project, which developed a climate adaptation planning in Marquette County, Michigan, in the USA, by conducting a post-project survey and interview among the project participants. While visualizations are widely used in the field of landscape planning and urban planning, there are few references regarding how photo visualizations can be utilized to maneuver climate adaptation planning in small rural areas in the U.S. through CP. The purpose of this study is to document the impact of visualizations used in different phases of the study project and how the overall project process has impacted the attitude of the project participants toward climate change adaptation planning.
Research Methods
Study area
The project’s focus area is Marquette, the largest county in the Upper Peninsula in Michigan, USA, with a total area of 4,682.69 square kilometers sitting along the shores of Lake Superior, where the county is undergoing severe climate-changing issues with several environmental, economic, and health challenges. Climate change in this region is remarkable, considering the change in ice cover, water level, temperature, and humidity. According to the most recent data, from 1951–2017, the average temperature, the frost-free season, total precipitation, and the number of heavy precipitation events have been significantly increased in this area (Great Lakes Regional Climate Change Maps | GLISA, 2023). Studies show that the temperature has risen by about 1.5°C in the western Upper Peninsula since 1951, and it may rise by an additional 1.7° −3.4° F by 2050 (National Climate Assessment | GLISA, 2023). Several key natural events are manifesting the effects of climate change. For example, during 1951–2016, the Great Lakes region’s precipitation level increased by 14%, while heavy precipitation events increased by 35% (National Centers for Environmental Information (NCEI), 2023). The climate change issues have brought several adverse effects in the lives of the people of Marquette, which fall under the categories of severe weather, air pollution, changes in vector ecology, increasing allergens, water quality impacts, water and food supply impacts, and extreme heat. The health issues stemming from these encroaching components include waterborne diseases, heat-related illnesses, asthma, cardiovascular diseases, cholera, harmful algal blooms, malnutrition, diarrheal diseases, respiratory allergies, mental health impacts, and heat-related illnesses. Marquette County Climate Adaptation Taskforce and Superior Watershed Partnership have been developing mitigation and adaptation strategies to reduce the consequences of climate change for this rural non-agriculture-based, geographically large area since 2013.
To respond to these challenges, Marquette Area Climate and Health Adaptation Planning (MACHAP) was developed as a pilot project conducted in 2017 to reduce and eliminate the health impact caused by climate change in that area. Through a partnership between the Michigan Department of Health and Human Services (MDHHS), the MACHAP, Michigan State University Extension (MSUE), the Michigan State University’s School of Planning, Design and Construction (MSU SPDC), the Marquette County Health Department (MCHD) and other local leaders including the Marquette County Climate Adaptation Task Force (CATF), this project with in-depth analysis and visualizations planning process resulted in a Climate and Health Adaptation Plan for Marquette County beginning in 2017. As part of this plan development effort, various health issues were identified by the residents of Marquette County, who participated in different phases of the project. After the issue identification, the project team proposed planning and design solutions in the later stages of the project and received feedback on their priorities and preferences.
Community participation process
The project was continually directed by public input through interviews, stakeholder meetings, and community engagement workshops. The overall framework of the undertaken project had three public workshops. In every phase of the project, the participants gave feedback on multiple issues, such as the impacts of climate change on health, preferences for design solutions, and what they are happy or worried about in the area/community. This feedback was documented, summarized, and presented in the project meetings, where the feedback was displayed in a word cloud, chart, or other graphical media. The responses with the higher frequencies were listed on top. The feedback loop continued for the entire project until the preferences for design solutions were identified. In this way, no single voice could dominate the conversations, everyone got their own space, and the ultimate findings or solutions could represent the highest number of participants. The project team used visuals that contributed to the community participation process by generating consensus at different project phases. The visuals made it easier for the facilitators to get input in an organized way, summarize and assemble them, and prioritize the high-frequency responses.
The first workshop, between the spring and summer of 2017, focused on identifying health risks in changing climates and the engagement of different stakeholders. The second workshop, between the fall of 2017 and the fall of 2018, included policy and metric recommendations for addressing the climate and health concerns of the county. In the third workshop, occurring from the winter until the fall of 2019, the implementation plan of short, medium, and longer-term strategies was identified to achieve specific goals. A “Marquette Area Climate and Heath Guidebook” was published upon completion of the meetings and workshops to address priorities on climate and health concerns in the study area. Later, an additional guidebook was published titled “The Michigan Climate and Health Adaptation Planning Guide for Michigan Communities” which communities in Michigan can adopt to develop a climate and health adaptation plan or integrate climate and health concepts into their existing initiatives.
Data collection
The data used for this study was collected through an online questionnaire survey and an in-depth interview after completing all the project phases. The questions in the surveys and interviews were designed to better serve the planners, local leaders, and researchers by providing insights on the project process, opportunities and challenges, focusing on the use of visualization. Michigan State University’s IRB review process approved the survey and interview questionnaire. The first survey was circulated in 2020, focusing on evaluating the effectiveness of the graphic components in delivering information about climate change and assessing the impact of visual communications on the public’s aptitude to participate in climate change plans in Marquette County. Twenty-six participants, including stakeholders, local elected and appointed officials, and community residents responded to the survey who participated previously in the project meetings and workshops. There were thirteen questions in total in a combination of open-ended and Likert scale questions. The survey has three generic questions related to the participant’s demographic information, four questions to assess the involvement and knowledge of the participants about the study project, and the other six questions to evaluate participants’ perception toward climate adaptation planning and their opinion of using visual communications during the decision-making process (Table 1).

Survey questions
After the online survey, an in-depth interview was conducted in 2021. The questions in the interview were centered around analyzing the impacts of the project process to more accurately understand how the project influenced the participant’s involvement in the community later, emphasizing the role of visual communication. Fourteen people including stakeholders, local officials and community residents participated in this interview from various groups of participants. For collecting data from the in depth interview, four open-ended questions related to the effectiveness of CP process and graphic materials were asked. All interviews were recorded with participants’ consent, and each interview session lasted around 45 minutes.
Data analysis
The data from the survey and interview were analyzed to run descriptive and content analyses based on themes with specific keywords. After the content analysis, the responses with higher frequencies were identified and analyzed with descriptive statistics. The survey and the interview responses are categorized under three sections: participants’ demographic informaiton, involvement and knowledge of the project via CP, and impacts of visualizations in CP. The survey and interview data are reported statistically in this paper along with quotations from the participants’ responses in the open-ended questions from the interview.
Results and Discussion
Demography of the respondents
A total of twenty-six participants completed the survey. The majority of the respondents live in Marquette County (92.31%). According to the status of residence, 92% of the participants own the place where they currently live. The majority of the respondents are public officials (29%), along with retired educators, self-employed interested citizens, and parents. In the interview, a total number of fourteen participnats’ responses are documented. The majority of participants worked for local governments (42.8%), while the rest of the participants worked in other professions in discrete sectors of Marquette County, such as higher education, non-profit organizations, health departments, community planning, and township boards.
Involvement and knowledge of the project
For the questions regarding the evaluation of the involvement of the participants in the climate and health adaptation project, survey results show that 97.67% of the respondents attended at least one of the previous workshops. The highest number of participants attended the third meeting (55.81%). All the participants who participated in the workshops could remember the graphic components introduced during the CP process for their discussion, whereas a higher percentage reported recalling the visualizations displayed in the third workshop (40%) (Table 2).

Involvement of the survey participants
Participants reported a higher mean score (6.13) regarding their level of interest in climate change issues, which means their interest in climate change issues increased after attending the workshops. Participants were asked about their level of knowledge about the impacts of climate change on health before attending the project meetings to identify if the project participation benefited them in climate change issues. Respondents indicated above-average mean scores (4.46 and 4.38, respectively) to the questions regarding their level of knowledge on the issue of the impacts of climate change on health and the different climate change and health adaptation practices, especially Green Infrastructure (G.I.). These scores indicate that while the participants had essential knowledge regarding the impact of climate change and climate adaptation practices before attending the project meeting, there was significant scope for improvement in their perception and knowledge (Table 3).
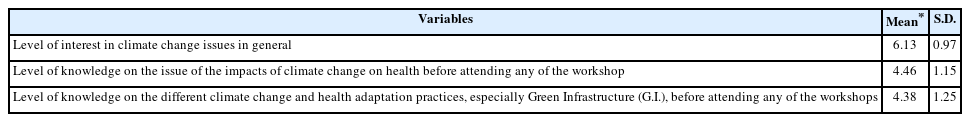
Level of knowledge of the survey participants regarding climate change before attending the meetings
Impacts of visualizations in CP
The survey participants noted that the overall process of the project with visual communication components was systematic, science-based, and research-oriented, rendering the process very legitimate (84.2%). Respondents were generally unanimous in their responses that the most important and valuable project materials were the visual presentations shown at the community meetings (86.4%). They answered that the project team provided a realistic visual to accompany the shared ideas, which strongly impacted a broad audience (73.6%). Other significant project materials that respondents included in their statement were statistics and detailed maps (58%). 84.21% of the survey participants reported that the visuals/posters presented in any of the workshops were helpful in the voting process for prioritizing the goals of the Marquette Area Climate and Health Adaptation project. Most respondents (72.73%) answered that the visuals/posters about climate change impacts and mitigation practices increase their inclination to participate in climate change adaptation planning in Marquette County (Table 4).

Frequency analysis result of the impact of visualization on CP
Most survey participants (76%) acknowledged that they became more knowledgeable about climate-related issues and well aware of their impacts and the measures that could mitigate the unpleasant effects after attending the meetings. In response to an open-ended question in the survey on how the visualizations helped the participants during the project meetings, most respondents addressed themselves as visual learners. They emphasized how they feel more attached to any issue with graphic content rather than lengthy texts (88.4%). One of the participants noted, “Visuals are always helpful to create tangible examples for what can be implemented. Visuals help inspire creativity and can spark ideas for adaptation planning and implementation of projects.”
In the survey, as shown in Table 5, respondents indicated a high mean score (5.08) about the posters/visuals being helpful in understanding the impacts of climate change on health (Table 5). Participants also responded with a higher mean score (5.54) for the posters/visuals that helped them understand the different climate change and health adaptation intervention practices. These scores indicate that the visuals were helpful for the participants to understand the climate change events, associated adverse impacts on health, and health adaptation intervention practices. In addition, the participants shared positive statements in the interview regarding gaining trust among participants and facilitators to address the community issues by utilizing visuals. The open ended questions in the interview provided data on personalized learning and subjective understanding of the participants. One of the interview participants responded, “My takeaway from the visuals/posters presented in the meetings would have to be that so many parts of our community and neighborhoods have an important impact on our climate.” The respondents identified that the professional grade presentations with visualization offered consistent information for stakeholders participating in workshops (58.6%).
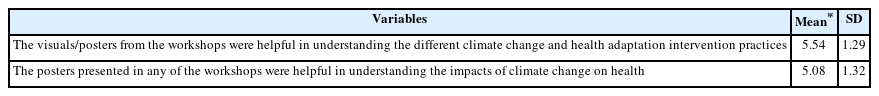
The impact of visualization on CP
In the interview, respondents shared their positive feedback in evaluating future vision plans with a series of renderings that demonstrated their community’s existing and future condition (72.3%). The interview laid the platform for the respondents to illustrate the advantages of visuals as a communication tool in detail, along with their observations and knowledge gain through the process. One of the interview participants mentioned, “I believe the changes to the design shown in the visuals are not drastic for the impact they would deliver.” Another noted, “I learned how ‘Green’ infrastructure is vital to mitigate climate change impacts from the posters.”
According to the in depth interview, respondents reported that the project with graphic components envisioning their future development gave the participants good management practices to move forward as development continues. Most of them complimented using visual examples as powerful methods of visualizing alternative futures (67.9%). With the knowledge and information gained from the visuals, the participants were motivated to continue to work on similar projects. The participants stated that this project worked as a way to further educate other members of the community from around the area. According to the survey, 92.9% responded that the materials including the visualizations provided by the MSU project team helped the local community progress toward becoming better adapted to deal with the health effects of climate change. Many respondents (61%) complemented the information as being in-depth and detailed. They added that the graphic presentation made the process easier to visualize and easier in terms of packaging it up to share any of their proposals with planning commissions efficiently. In the interview, one participant addressed that “This project and the deliverable materials have made it much easier to learn how to compile materials and deliver them to our local planning commissions.” The open ended questions in the interview also allowed the respondents to elaborate on their observations of the impacts of visuals during the project. Another participant noted, “This made me want to participate more because I am a very visual person, and when you can walk around a room and see your community in many different phases with potential possibilities for change, it was incredibly eye-opening.” Statements of the respondents imply the positive attributes of the visuals and how they immediately uplifted the participants’ perception during the community meetings and workshops.
Conclusion
The purpose of this research is to expand on the role of visualizations as a community engagement tool in a community participation process involving climate adaptation. The study shows that visualizations assist in knowledge dissemination, build trust among participants and project team members, and increase engagement and interest among the participants during the project meeting. The findings of this study show that the use of graphics, design renderings, and photos in presentations and on posters offer realistic visual representations of proposed designs and recommendations, allowing stakeholders and community members to visualize ideas in their communities. While descriptive information might make people feel disengaged during the meeting if they were presented through texts, visualizations made learning about the proposed solutions convenient. The presentation, the maps, and the visuals were very professional, research-based, and organized; therefore, they could gain the people’s trust and convince them to come forward to address the issue. Also, it reveals that well-made visuals can enhance participants’ capability to contribute to climate adaptation planning beyond the project scope. This trend only became more apparent over time, as the post-project interviewees frequently cited the visualizations as some of the most impactful pieces of the overall project. One limitation of this study is it is conducted in several communities from one county. So external validity may not be as strong as a study designed with multiple communities from different counties/regions. Another limitation is that this project topic focuses on built environments that impact climate change and health. If there is no need to deal with the built environment, graphic communication may not be as strong as we found. Despite these limitations, the study sheds light on the positive impacts of visualizations on community participation in climate adaptation planning, a comparatively new planning sector to invest in rural communities in the U.S.