Growth and Agronomic Traits of Green Onion under the Agrovoltaic System with Red Supplemental LED Lighting
Article information

Abstract
Background and objective
An agrovoltaic system is a power generation method applying photovoltaics (PV) to crops cultivated on a farm. Usually, the PV system covers less than 30% of the upper surface of crops on the ground. If the PV system covers the upper layer of the crops, the yield will decrease by 15–20% due to the shading of the PV module. This study was carried out to investigate the effects of red supplemental light-emitting diode (LED) lighting under the PV system on growth and agronomic traits of green onions.
Methods
To resolve the issue about decreasing yield, we constructed a 50 kW agrovoltaic system with the red (660 nm peak) LED dimming facility on the farm with 3 different plots for comparison. The 1st was PV + LED (two parts of dimming area: 3 hours and 6 hours). The second was only PV, and the last was a reference for comparison of yield (control plot). We transplanted uniform seedlings of green onions on three areas of the farm on June 23, 2020. We used red LED lighting for 3 hours and 6 hours after sunset and harvested green onions on October 25, 2020. We used less than 1% of electricity of total power generated by the agrovoltaic system for supplemental LED lighting.
Results
The result of harvesting under the agrovoltaic system with 3 hours of lighting showed that there was 38% more yield than the control plot. We also discovered the optimal amount of supplemental LED lighting because even 6 hours of lighting were not better than 3 hours.
Conclusion
Applying supplemental LED lighting after sunset can compensate for the yield decrease. The LED supplemental lighting for 3 hours is optimal for crop harvest. We expect that this system can be helpful to farmers who want to construct an agrovoltaic system.
Introduction
Agrovoltaics is a technology that enables both photovoltaic and agricultural activities simultaneously on one site, and can be applied to all farmlands including croplands, grasslands, and greenhouses. Such agrovoltaics is advantageous compared to simple terrestrial photovoltaics in terms of land use efficiency and advancement as well as resident acceptance of photovoltaic (PV) facilities. Thus, research and development are being conducted on various demonstration and application plans in Korea and overseas. There has also been some development in Korea from cultivating crops that grow in the shade under photovoltaic facilities to integrating with crops that grow in the sun such as rice, grapevine (Ahn et al., 2022), and kimchi cabbage (Min et al., 2022). The rice harvest of agrovoltaic facilities in Goseong, Gyeongsangnam-do was 85.9% of the harvest in the control group, indicating a partial decrease in agricultural productivity (Seo, 2019).
However, most of these demonstration and pilot projects in the past focused only on maximizing land utilization or economic feasibility, thereby just developing power generation systems such as solar structures and modules, or simply confirming the feasibility of cultivating crops. Due to this commercialization model centered on power generation projects, the value of agriculture has been damaged, such as the decrease in productivity and quality of crops and the unverified safety. This created an environment that makes it difficult for farmers to maintain farming and induced reckless development and real estate speculation that emphasized only economic benefits.
The government promoted the ‘Renewable Energy 3020 Plan’, which is a plan to increase the share of renewable energy generation from 7% in 2016 to 20% by 2030 (Ministry of Trade Industry and Energy, 2017). Among the detailed plans, the government is establishing and implementing the plan to supply 10 GW of solar energy in the agricultural sector. However, with the accelerating decline of farmland, renewable energy and agriculture are competing over land use for farmland that is important for food security, and a new agricultural photovoltaic business model is urgently needed to solve this problem.
As mentioned earlier, agrovoltaics, unlike general land-based solar power, enables both farming and electricity production simultaneously on the same site, thereby increasing profitability by at least 5 times compared to simple crop cultivation through efficient land use without reducing farmland. However, crop reduction rates of 15 to 20% have been reported under the existing agrovoltaic facilities that focus only on power generation without considering the productivity and quality of crops (Nam, 2018; Nagashima, 2018).
In order to maintain and improve agricultural productivity in agrovoltaics, it is necessary to apply supplemental LED lighting using generated output, recycle rainwater collected using solar panel, and develop production technology that minimizes crop reduction rate per unit area by adopting smart farming technology (Hong et al., 2012, 2014). This study investigates the growth and agronomic traits of green onions, a major open field vegetable, through the utilization of supplemental LED lighting technology for maintenance and improvement of agricultural productivity under the agrovoltaic system and monitoring of energy consumption accordingly. This study also develops a technology that enables both agriculture and energy production continuously by presenting an inspection and management plan for maintaining crop productivity.
Research Methods
Basic design
The smart solar pipe system rendered with 3D pipe bending technology was comprised only of 4 types of components (horizontal bar / SSP Ass’y / base plate / vertical bar), and 128 units of SSP Ass’y were used to form a 100 kW photovoltaic (PV) system, applying 2 commercial solar modules per SSP Ass’y. Fig. 1 shows the arrangement and assembly methods of components.

Agrovoltaic system installation process.
The schematic diagram of the red (660 nm peak) light-emitting diode (LED) light irradiation system and detailed designs of the agrovoltaic system are as shown in Fig. 2.
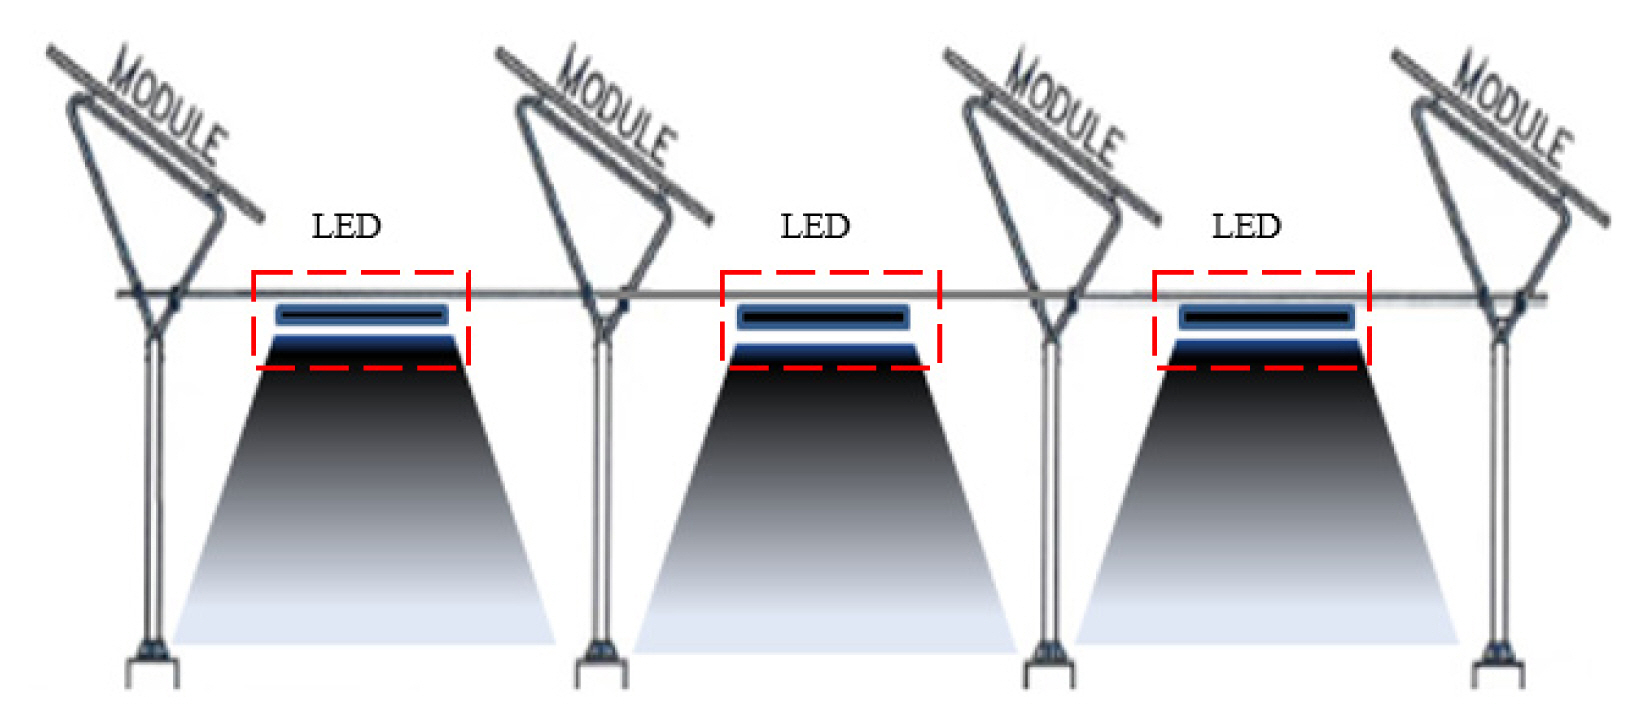
Design schematic diagram of red (600 nm peak) LED light irradiation system.
Installation of the agrovoltaic system
On November 6, 2019, smart solar pipes were installed by bringing in agrovoltaic system equipment on the Yeungnam University agrovoltaic demonstration site (35.81812929N, 128.76471619E) (Fig. 3). The total site area was 1,551 m2 (33 m × 47 m), and the open field (control plot) area was 462 m2 (33 m × 14 m). The area of the agrovoltaic system where the solar panels were installed was 1,089 m2 (33 m × 33 m). The agrovoltaic system was facing south and the solar panels were installed with a fixed-type 30-degree slope. The shading rate of the solar panels was 33%, and the inverter and connection boards were installed 2 m above the ground to prepare for flooding.
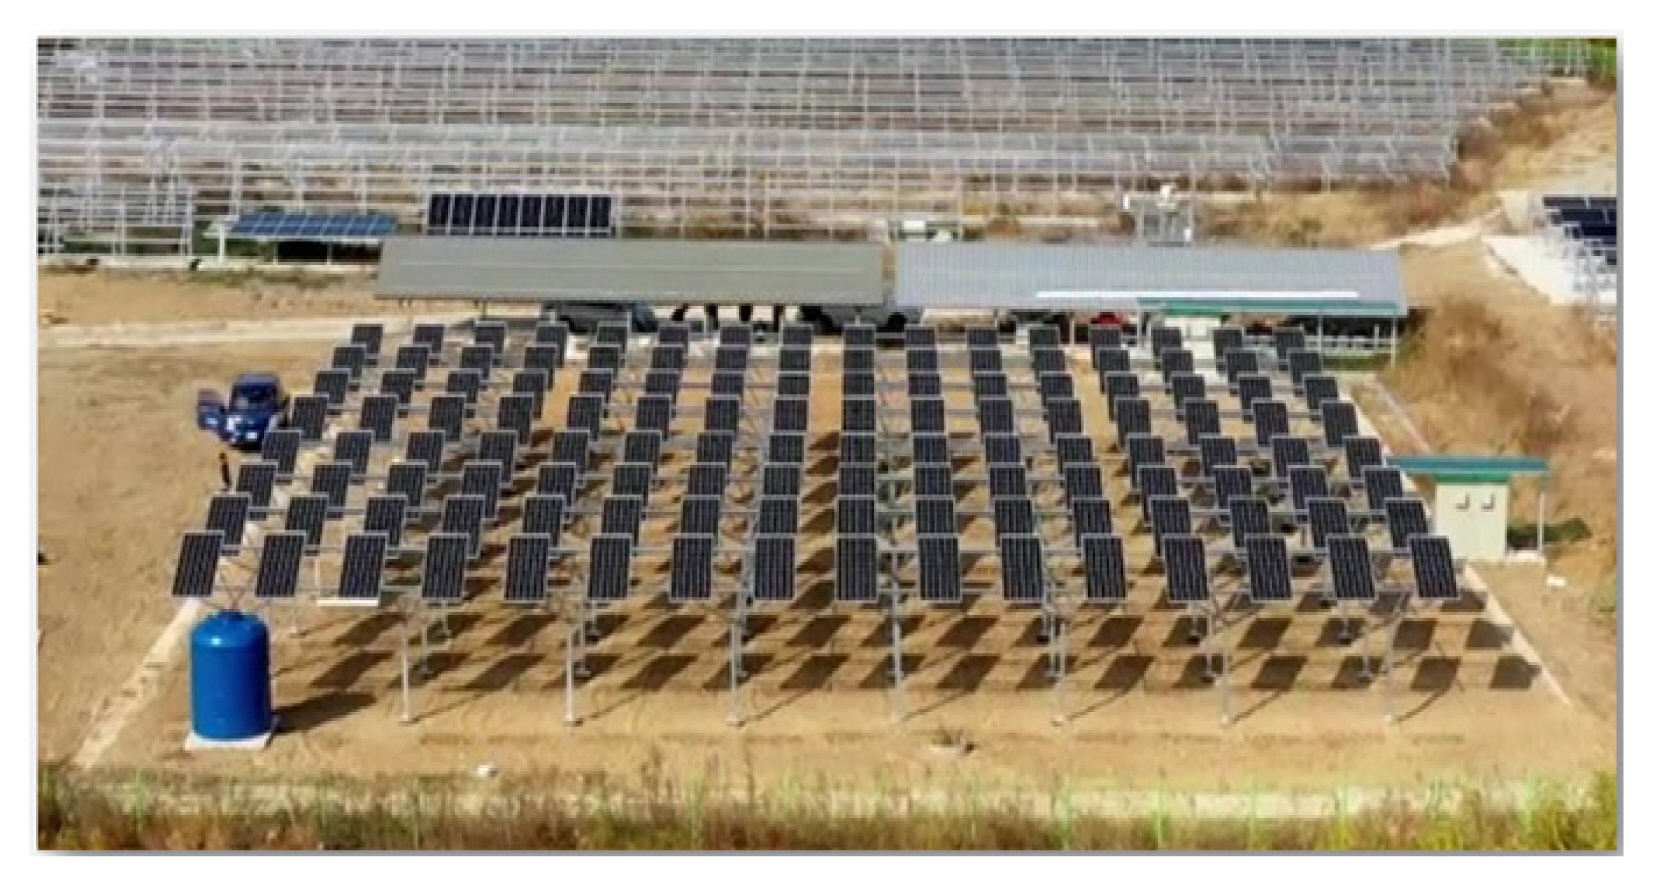
Agrovoltaic system site.
Installation of the supplemental LED lighting system
The supplemental LED lighting system installation area was divided into east and west so that there could be same conditions for solar irradiance, after which PV+LED was installed in treatment plot A1 and only PV was installed in treatment plot A2 (Fig. 4 ). Then, the dimmer was adjusted to 20% so that the illuminance of all parts was 5 lux or higher. The supplemental lighting time was adjusted to optimize supplemental lighting from 6:00 p.m. to 12:00 a.m. (6 hours). Fig. 5 shows that the 660 nm wavelength of 5 Lux or more was irradiated to the supplemental LED lighting section.
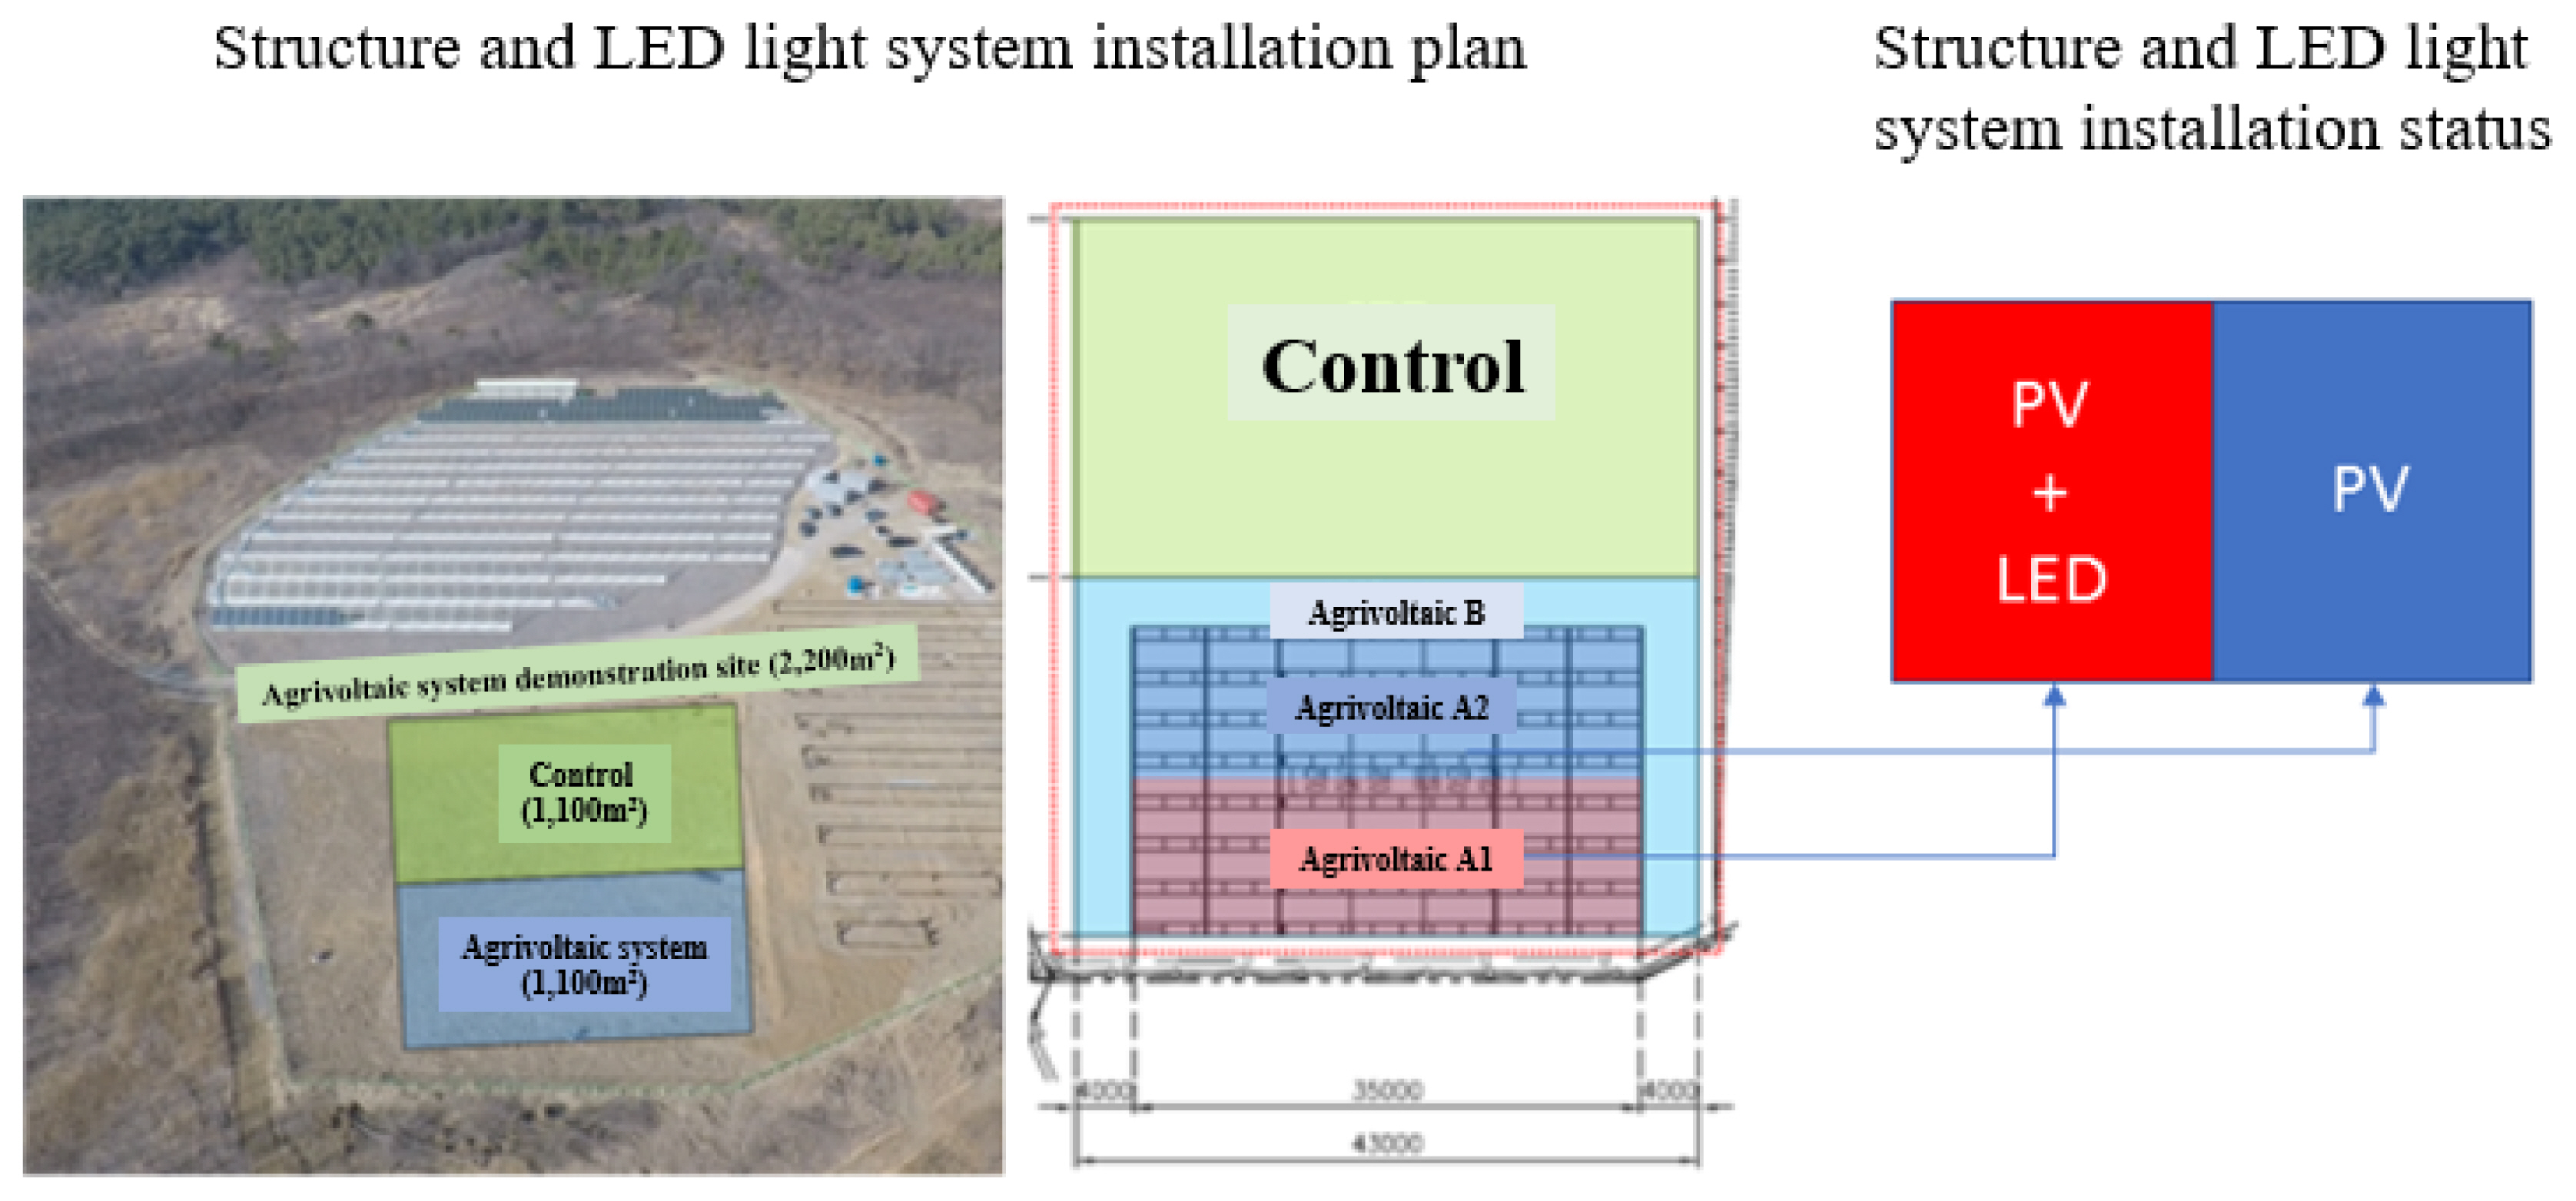
Structure and LED light system installation plan.

Red (660 nm peak) LED light system field.
Table 1 shows the cumulative integration of LED power consumption during the first green onion cultivation period (4 months).

Solar power generation by photovoltaic (PV) system and red (660 nm peak) LED power consumption by supplemental lighting during the green onion cultivation period of 4 months (June to October 2020)
Sowing and yield of green onions
Green onions were selected as summer crops under the agrovoltaic plant, and seedlings were planted on June 23, 2020 (Fig. 6). Green onions were planted with 20 cm between rows and 14 cm between stalks, and the seedlings were planted in 120 200-cell trays, thereby planting total 24,000 seedlings.
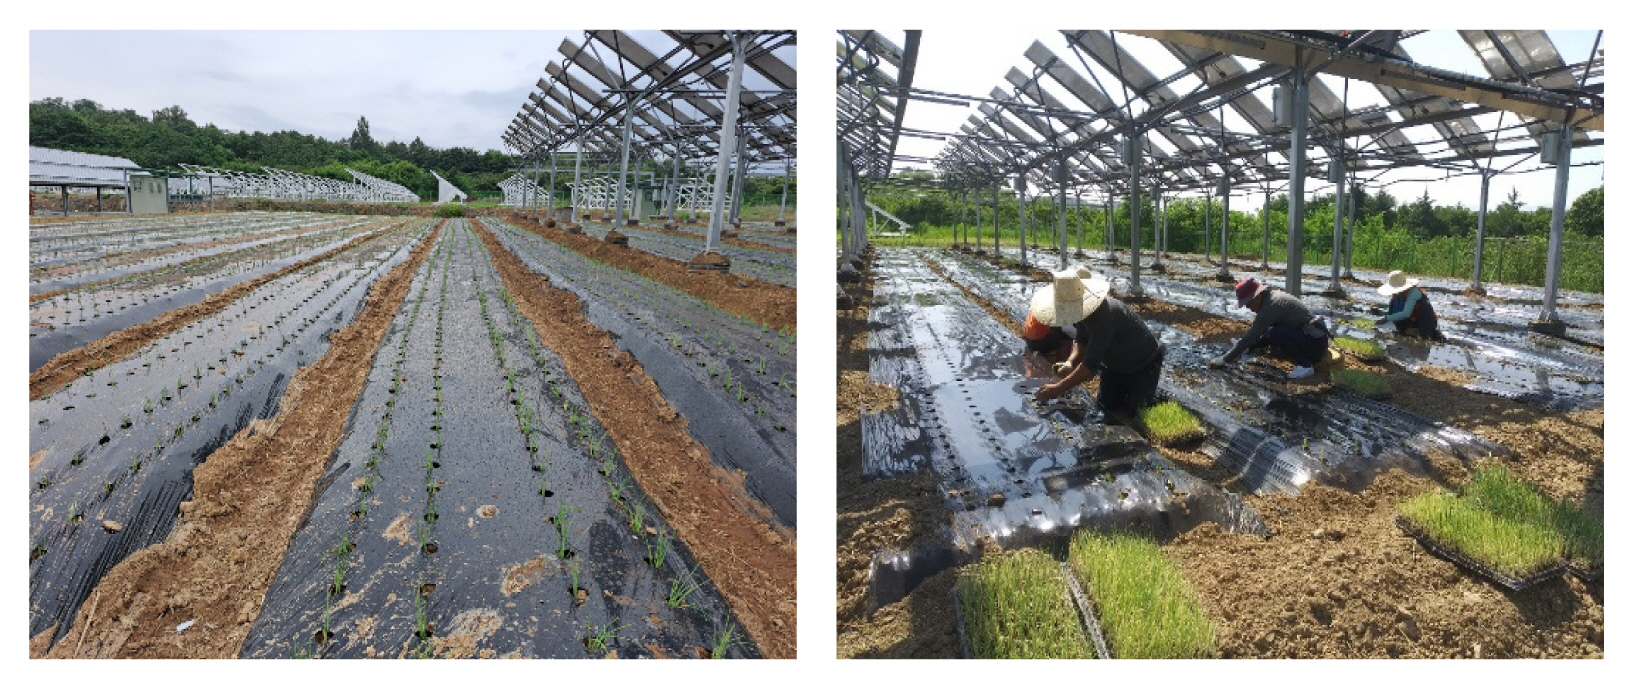
Planting work of green onion seedling on June 23, 2020.
During the period, green onions were managed by the conventional method (RDA, 2021), and they grew as shown in the figure below (Fig. 7).
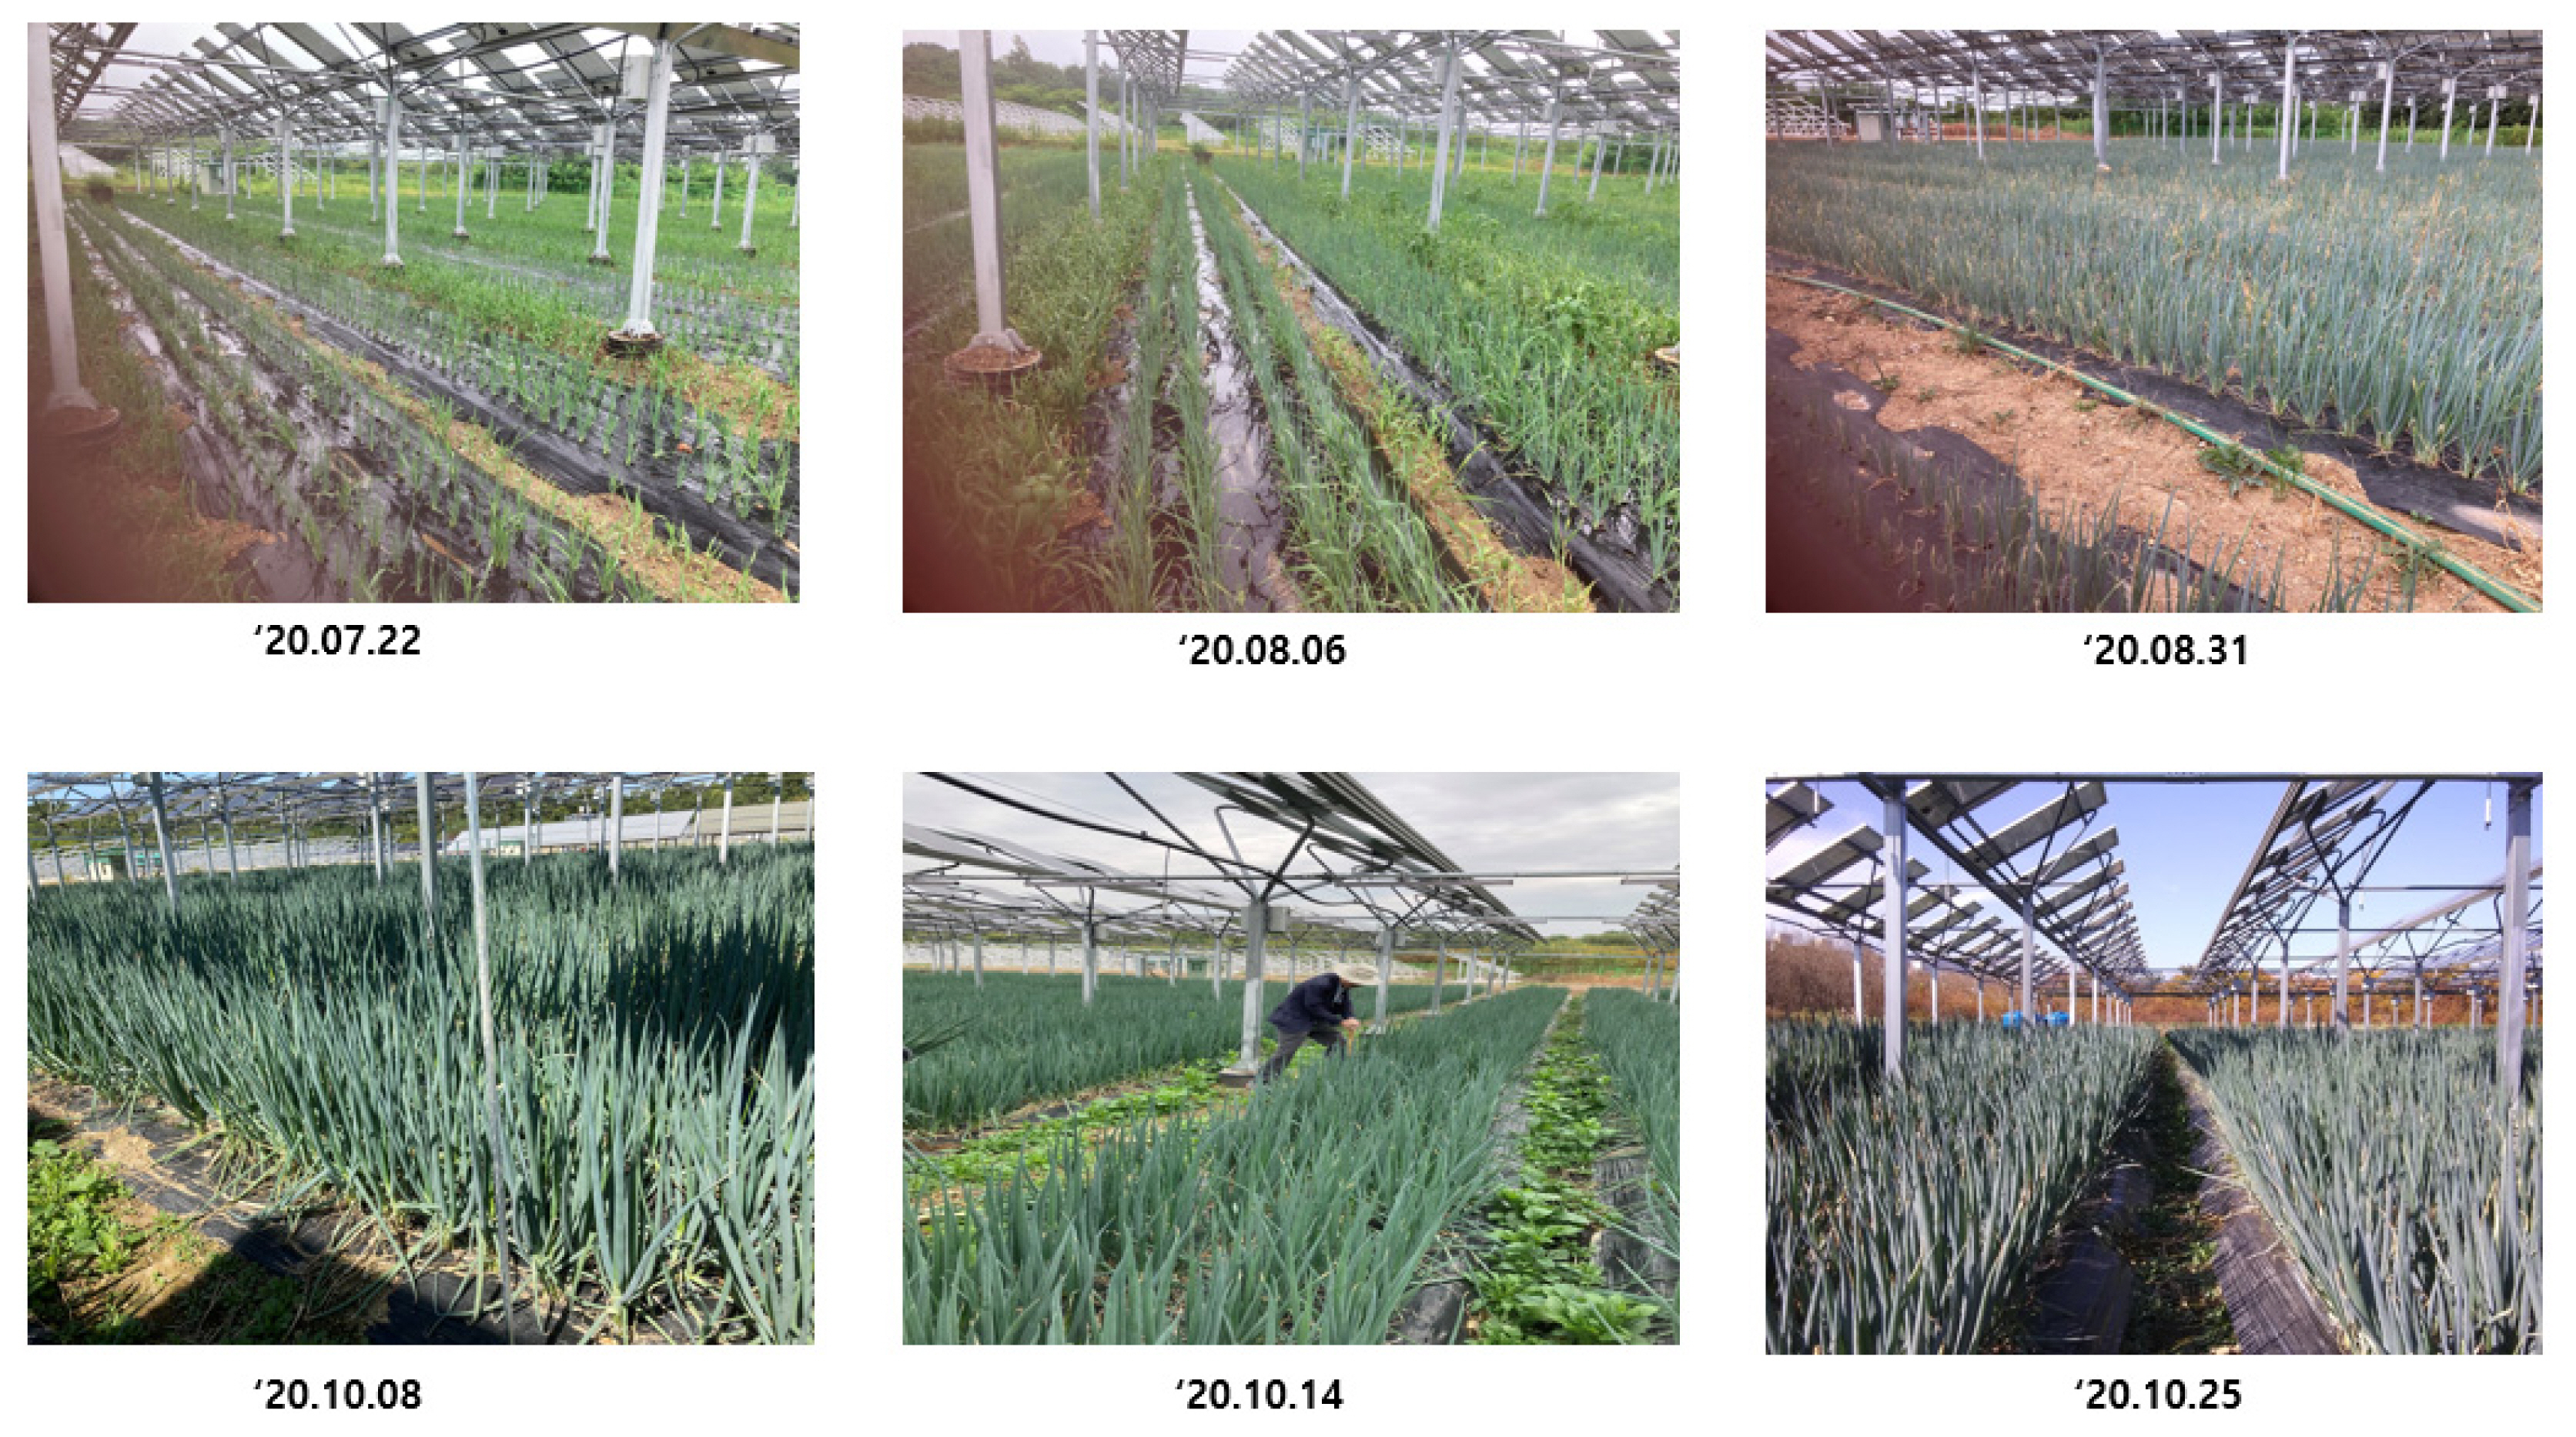
Green onion plants growing under photovoltaic system.
Green onion yield survey method
There was even cultivation in the open field, and the main samples of the center, left, and right were collected from the center of three areas where the shadow of the photovoltaic system did not reach at all. In the case of photovoltaic and photovoltaic + LED, the area around the support structure supporting the photovoltaic module seemed to show poor yield by the eye. Thus, total 6 sample areas such as 3 around the supports and 3 in the center between the supports were selected, and the average was calculated as the yield.
Climate and power monitoring for energy budget analysis
Climate monitoring was performed using the climate monitoring system of the Yeungnam University MW Test-bed center. As shown in Table 2, global horizontal irradiance (GHI), direct normal irradiance (DNI), diffuse horizontal irradiance (DHI), barometer, humidity, ambient temperature, wind direction, wind speed, and rainfall were measured every minute and saved in the database.

Example of climate monitoring data at 12:39 PM on June 03, 2020
The monthly total irradiance (PPFD) of natural light irradiated to crops during the cultivation period of green onions (June – October 2022, 4 months) is as shown in Fig. 8.
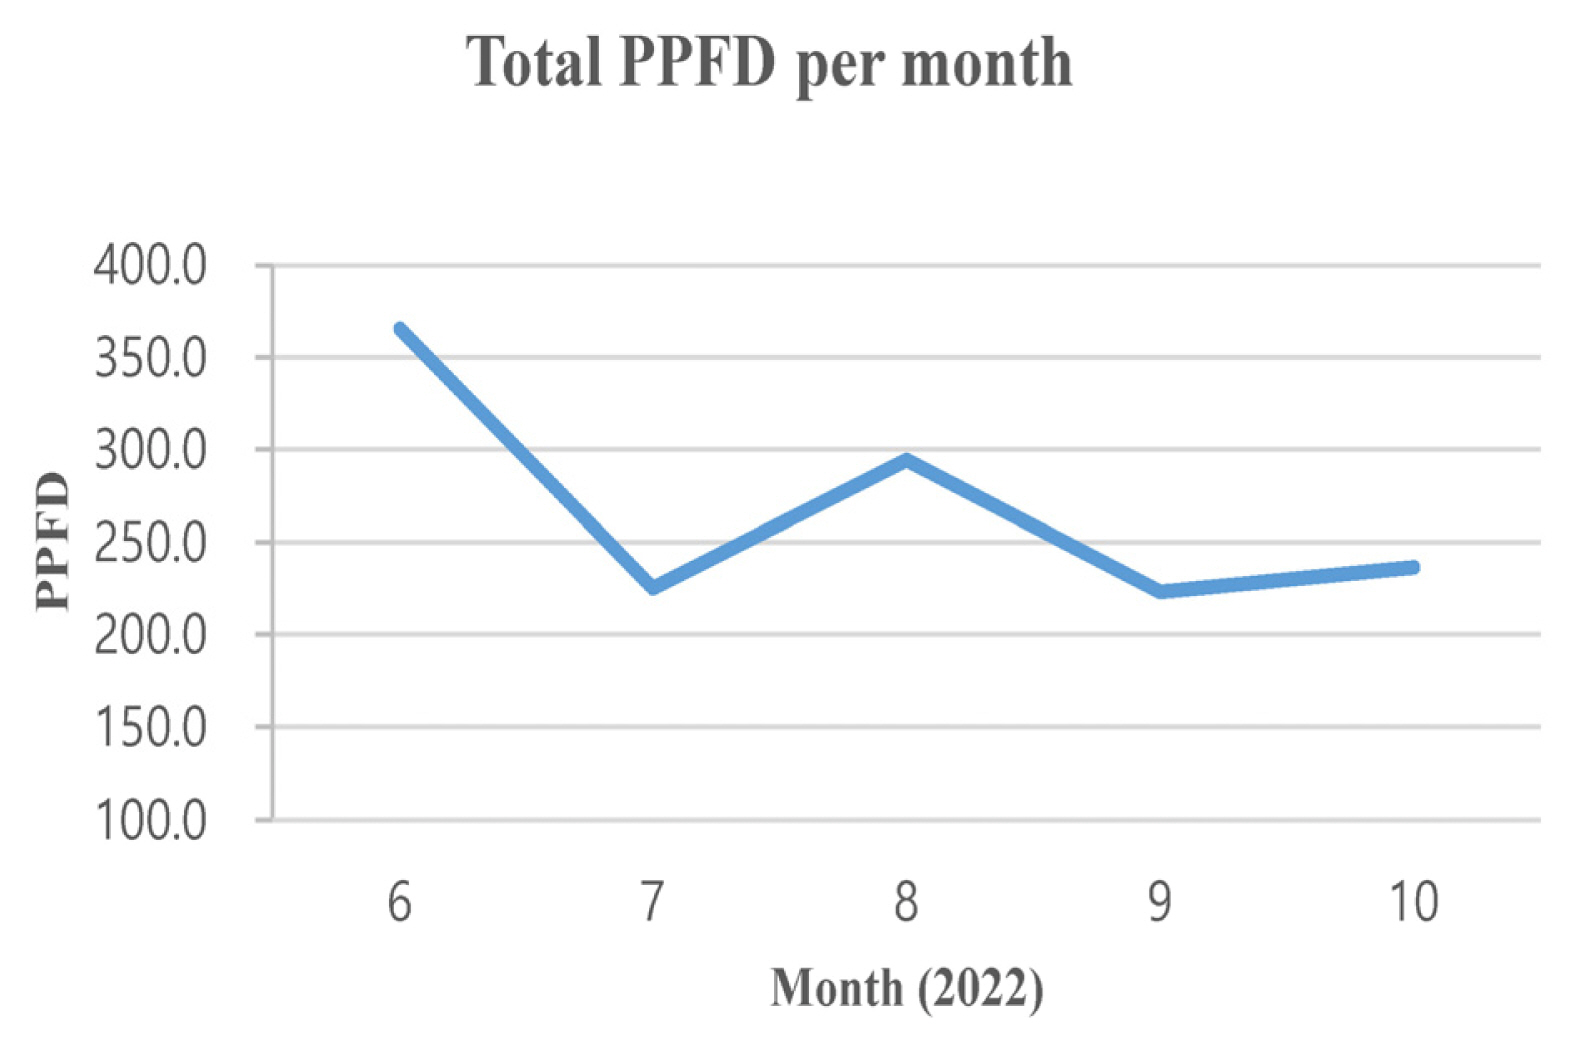
Total PPFD per month for cultivation period of green onion (2022 June to 2022 October).
Power consumption monitoring for energy budget analysis was performed using the power monitoring system of the Yeungnam University MW Test-bed center. As shown in Fig. 9, the voltage (V) and current (A) of 8 PV module strings were measured to calculate real-time amount of power, and this is accumulated to calculate the daily generation and monthly generation and save in the database.
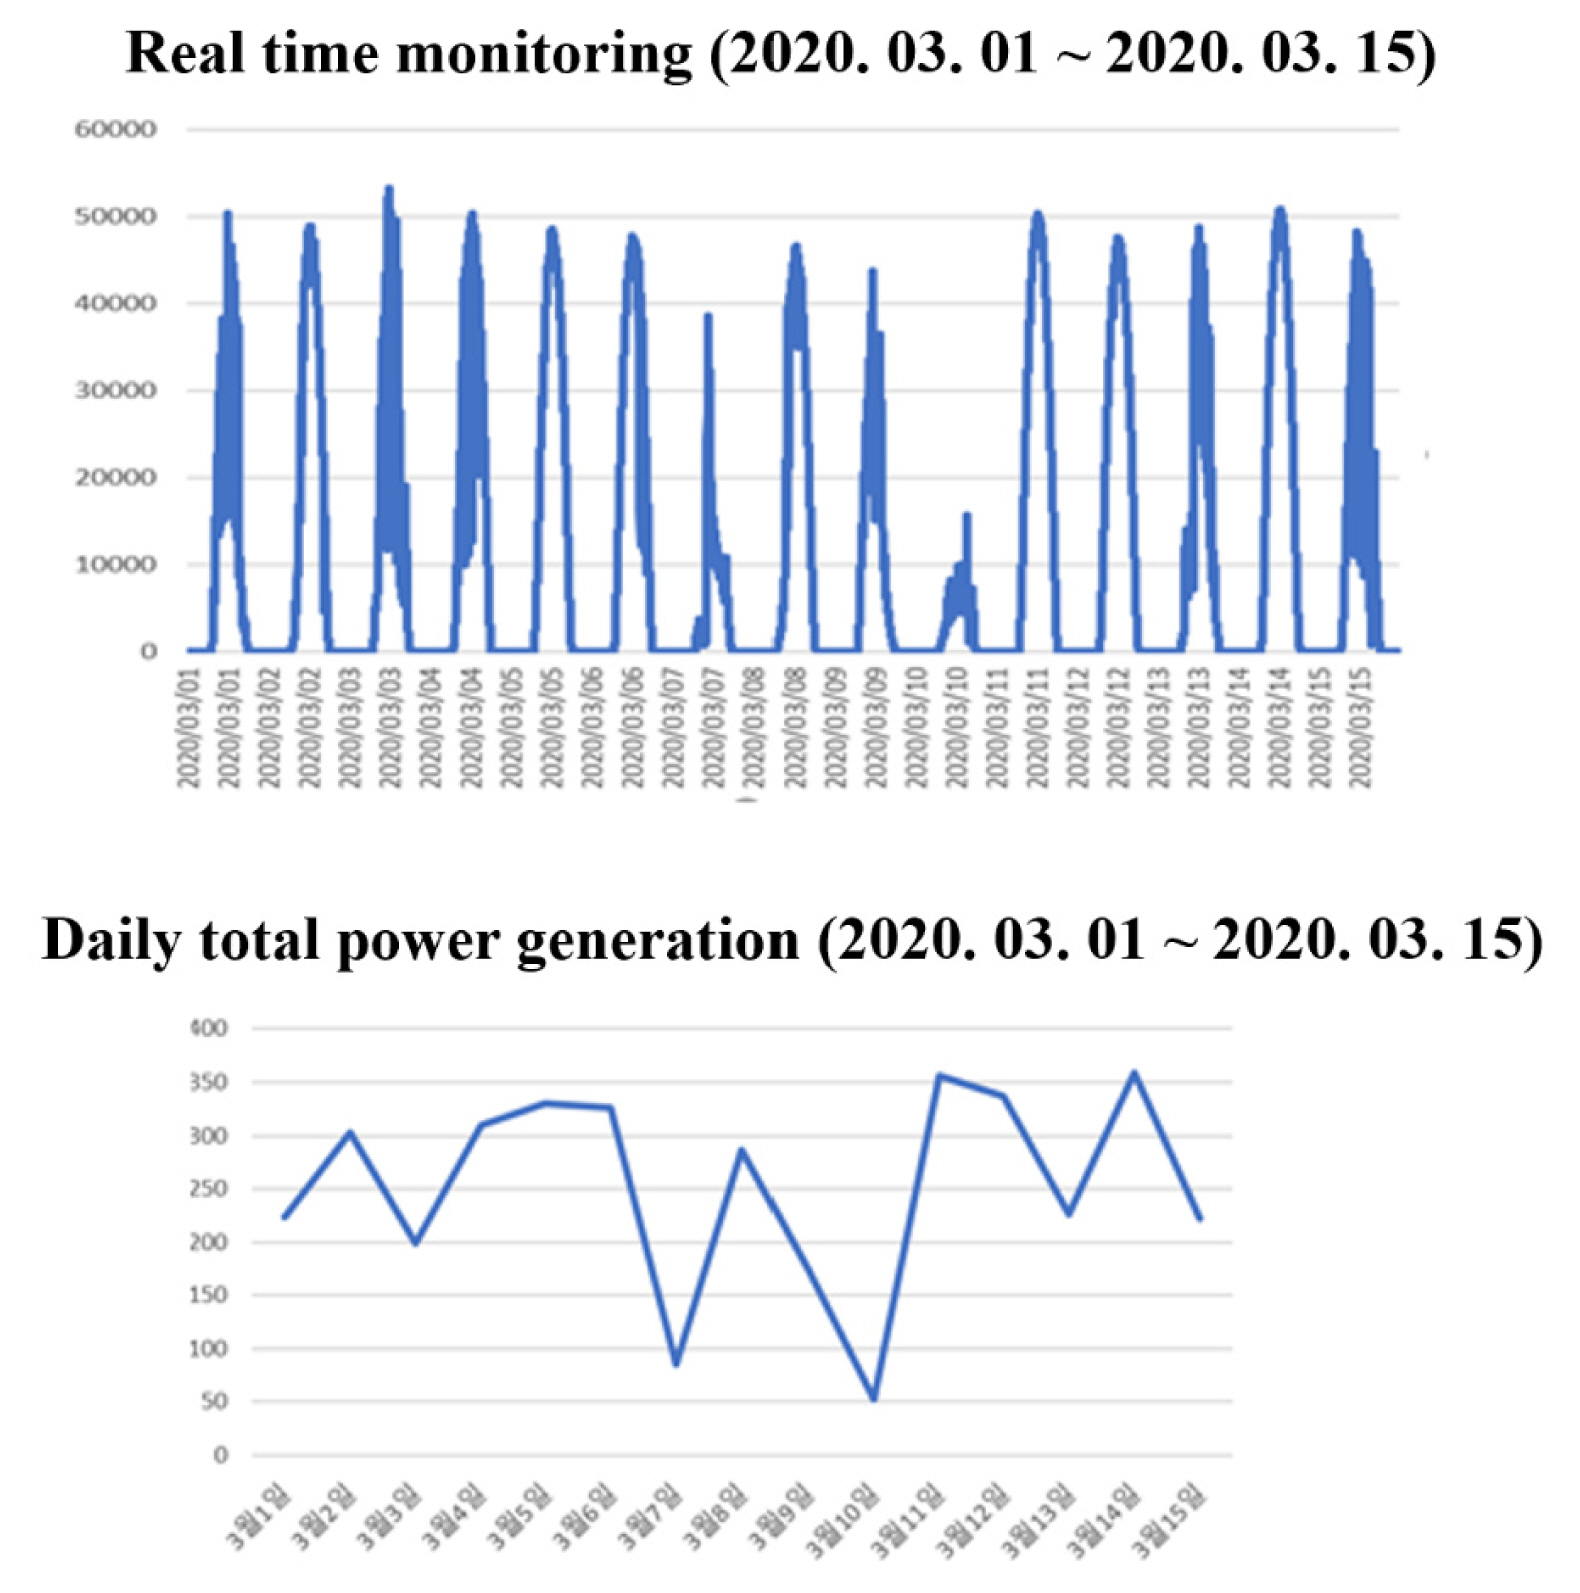
Electricity monitoring data for energy balance analysis.
Results and Discussion
Weather information and power generation
Unlike previous studies in Korea and overseas, this study not only identifies the yield decrease of agrovoltaics but also seeks how to overcome this decrease. Previous studies on agrovoltaic farming report what percentage of crops are yielded when the open field yield is set at 100%, when certain crops are planted at a certain time. However, there are no reports on exactly what climate the crops are yielded, and how to overcome the yield decrease. This study is even more significant as it may be the first to report the crop situation including a few real-time data of weather information necessary for agriculture in both Korea and overseas. The cumulative value of irradiance in particular can be the data that integrates rainfall, cloudy weather, and clear weather, and the cumulative data of total horizontal irradiance is the data that integrated the above. The monthly cumulative data of global horizontal irradiance (GHI) during the cultivation period of green onions in this study are as shown in Fig. 10. The monthly cumulative GHI and monthly gross generation are similar (Fig. 10), and this data show that there were many cloudy or rainy days in June and July, and there was the effect of a typhoon in September (Fig. 11).
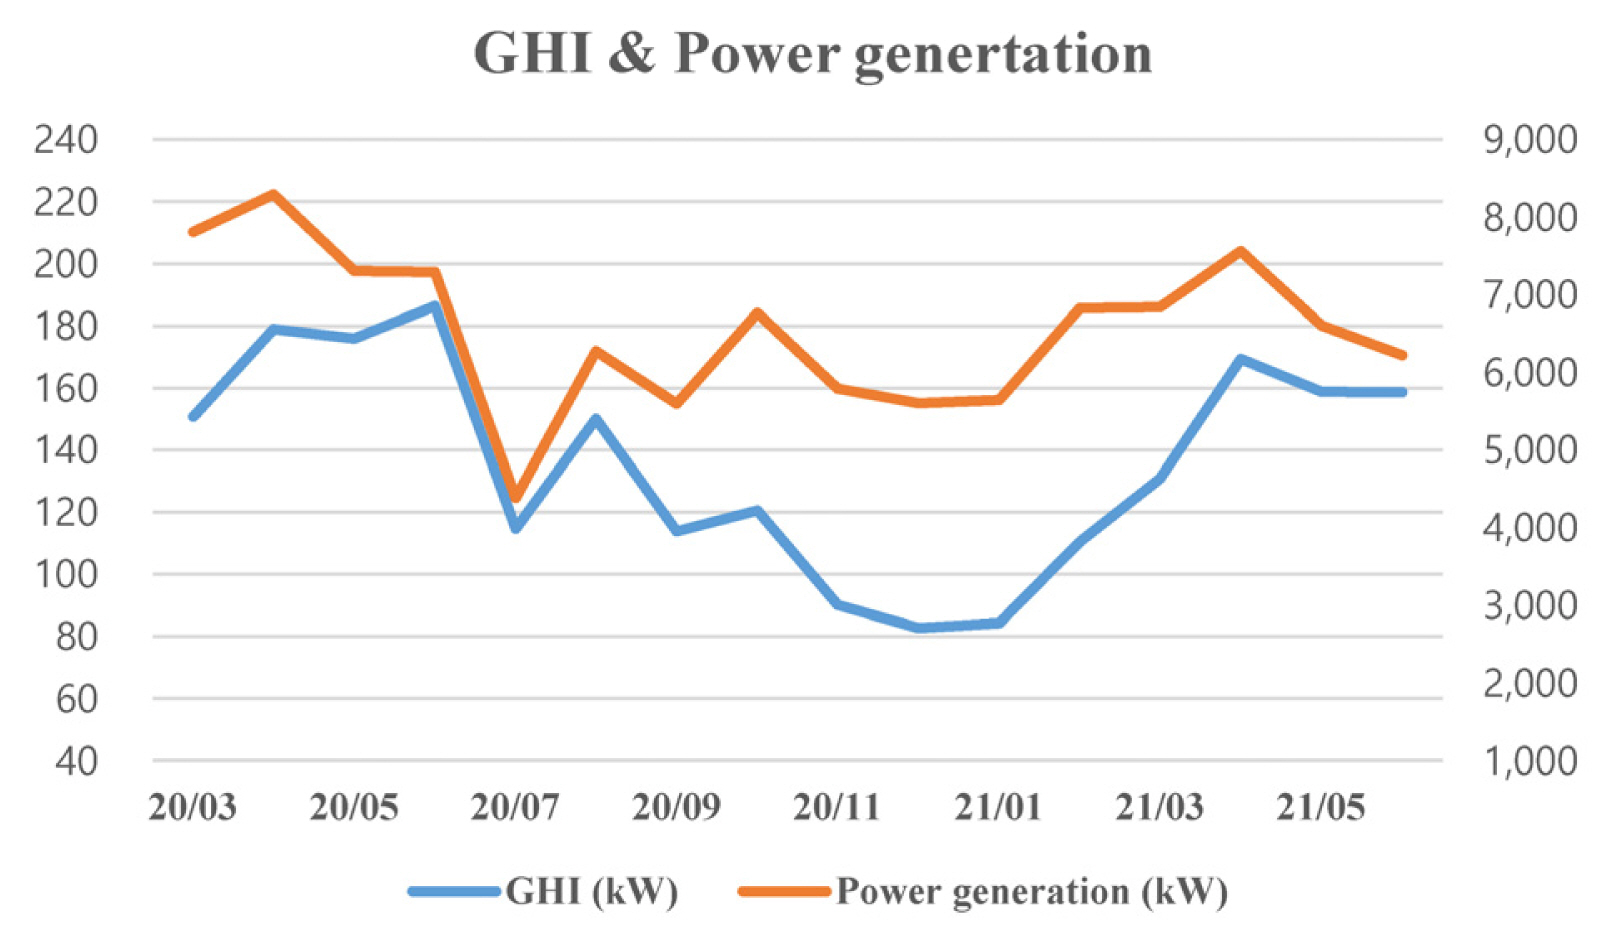
Monthly total solar radiation (GHI) accumulation and total power generation including green onion growing period (June 21 to October 21).
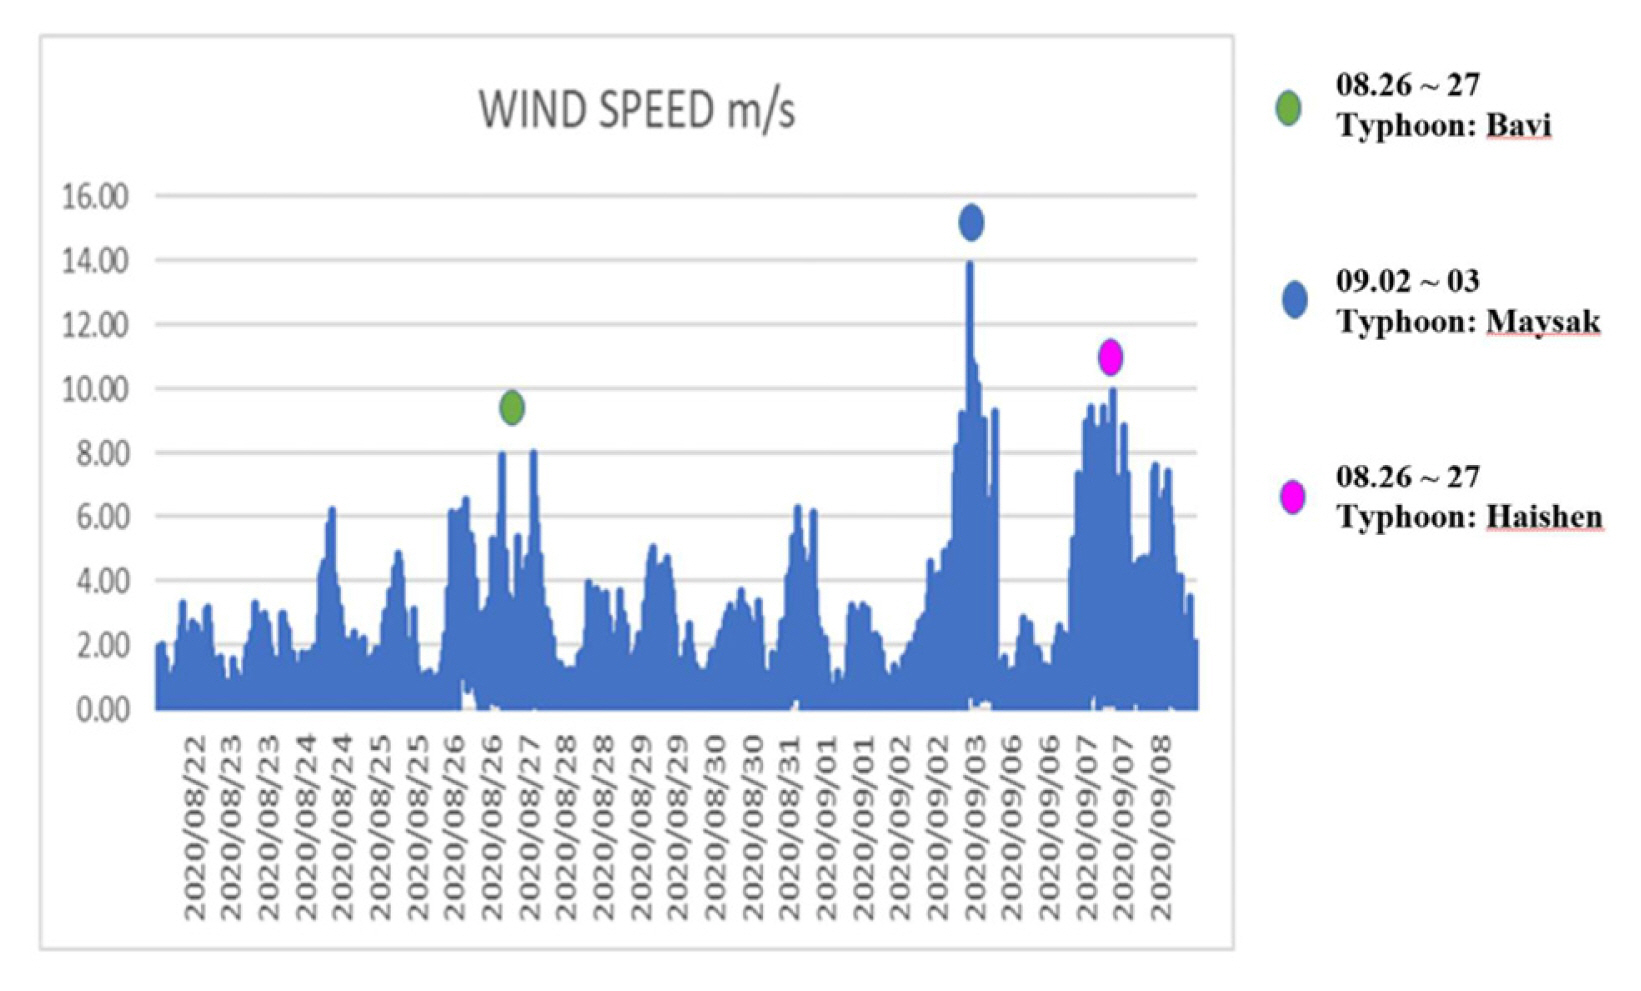
Real-time climate information monitoring - wind speed data per minute.
Gross generation including the green onion cultivation period is 123,732 kWh, of which the total LED power consumption is 706.79 kWh. LED power consumption compared to gross generation was 0.571 %.
Moreover, the total power consumption of LEDs in the green onion cultivator was 178.5 kWh, and the gross generation generated during this period (June 23 – October 25, 2020) was 27574.9 kWh. That is, the power used to operate the LEDs was less than 1% of the gross generation.
Green onion harvest results
In the case of green onions, after dividing the solar cell + LED plot into two parts, supplemental lighting was applied for 3 hours to one part, and for 6 hours to the other part, as an initial experiment to optimize the supplemental LED lighting time. In addition, the solidity of green onions was also inspected by measuring chlorophyll as well as total yield.
Chlorophyll content and agronomic traits of green onions
Chlorophyll a and b and total chlorophyll content were 27.7% higher in the solar cell + LED (6 hours) treatment plot compared to the control plot (Table 3). There was a slight increase in the case of solar cell and solar cell + LED (3 hours), but there was no statistically significant difference.

Growth and crop characteristics of green onions grown for (4 months) under photovoltaic (PV) system with red (660 nm peak) LED supplemental lighting (SL) for 0, 3 or 6 hours
The plant height and weight of green onions were heavier in the treatment plot compared to the control plot (Table 3). The plant height of green onions increased by 7.9% in the solar cell plot, 16.1% in the solar cell + LED (3 hours) treatment plot, and 18.7% in the solar cell + LED (6 hours) treatment plot compared to the control plot, showing a statistically significant increase.
The fresh weight of green onions increased by 38.7% and 26.6%, respectively, in the solar cell + LED (3 hours) and solar cell + LED (6 hours) treatment plots compared to the control plot (Table 3). In particular, since the solar cell + LED (3 hours) treatment plot is heavier than the solar cell + LED (6 hours) treatment plot, it seems that LED supplemental lighting for 3 hours under the solar cell is appropriate for cultivating green onions during this time. On the other hand, there was a 9.7% decrease in the solar cell plot without supplemental LED lighting compared to the control plot, but there was no statistically significant difference. The statistically significant increase in the yield of green onions by this supplemental LED lighting proved that the growth of green onions is promoted by supplemental LED lighting.
Conclusion
The 660 nm supplemental LED lighting system helped promote crop growth and productivity (Ref). Previous studies were only on the application of supplemental LED lighting technology in greenhouses. This study was the first on supplemental LED lighting in an open field. Only green onions were used as crops, but the effect was so clear that the study results have sufficient meaning. Since the agrovoltaic facility already existed, it was easy to add the LED supplemental lighting system using this facility, which also minimized the costs. The amount of electricity used for supplemental LED lighting is also less than 1% of the electricity produced by agrovoltaics, indicating that not much power was consumed. Accordingly, there will be no major problem in the overall economic evaluation even if the power generated by agrovoltaics is used through the secondary cell system. Thus, the use of the supplemental LED lighting system with the agrovoltaic system in the open field agrovoltaic system is highly recommended.
Previous studies have used high pressure sodium lamps or infrared lamps, and some reported various plant growths, although the crops were different (Moon et al., 2014; Graper and Healy, 1991). As such, it was revealed that supplementation of the light blocked during the daytime by the solar panel effectively compensated for the yield decrease using the LED system. Furthermore, production can also be increased compared to the open field by adequately optimizing the LED system. In particular, this study proves that LED light has excellent straightness and low diffraction, and thus it is effective even in open fields without much difference from greenhouses or indoors. This study provides the possibility of extensive application of supplemental LED lighting technology even in general open fields where facilities are not installed. This study used only 660 nm red LED light, but a device that can utilize all LED wavelengths in the visible light bandwidth of 400–750 nm is being developed; thus, it would be possible to apply supplemental LED lighting more efficiently in open fields (Son et al., 2017).