Difference in Emotional Evaluation according to the Preference of Coleus Cultivars
Article information

Abstract
Background and objective
This study investigated the preferences and repurchase intentions (loyalty) of respondents to 8 coleus (Coleus scutellarioides) cultivars potentially useful for tropical style streetscapes.
Methods
A survey was conducted on 148 general respondents, and the responses from 136 respondents were analyzed excluding 12 inappropriate copies.
Results
Through demographic analysis on plant gardening experience, plant preference tendency, and plant-related event, we discovered that plant preference tendency was lowest in the 20s and highest in the 60s and above, indicating that plant preference tendency significantly increased with age. Out of 6 factors on perceived importance of plants, environmental and emotional relaxation for improved quality of life were high. As a result of examining the emotional responses felt by looking at the images of 8 coleus cultivars, there was a statistically significant difference among cultivars. Major emotional words were ‘calm’ and ‘comfortable’. There was a positive correlation between loyalty to coleus, preference, Korean version of WHOQOL-BREF, plant gardening activity level, and the importance of plants, and a negative correlation with PSS-K (Korean Perceived Stress Scale). We conducted a multiple regression analysis including dummy variables to examine the effect of plant gardening activity level, PSS-K, and Korean version of WHOQOL-BREF on loyalty of survey respondents. The results showed that the effect was greatest in the order of plant-related event, physical health domain, age (50’s), covers, environment domain, male, and age (30’s).
Conclusion
Our results demonstrated that coleus could mitigate the psychological stress and depression. As ‘Lime Delight’ with simple green color showed the highest preference among cultivars, we recommend a green cultivar from the psychological point of view rather than combination planting of multi-colored cultivars.
Introduction
Recently, Korea is promoting an urban greening project to relieve helplessness and depression of citizens due to the prolonged COVID-19 pandemic and expand green spaces that are close to life (Kim, 2022). Plants are living organisms that give humans psychological functions such as stability, peace, and rest (Lee, 2014a). In particular, by frequently and visually encountering the natural environment such as natural plant leaves (Kaplan and Kaplan, 1989), people can have positive experiences such as mindfulness and immersion, and this also leads to recovery and healing in various other aspects by restoring attention (Lee, 2014b). Moreover, a plant gardening activity gives psychological satisfaction and provides interest in plants as well as positive effects by increasing interest, understanding, concentration, and creativity related to plants (Kim, 2001; Shin et al., 2007).
Recently, among the plants being test-cultivated for summer tropical style street flower beds carried forward by Rural Development Administration, coleus (Coleus scutellariaides) that is widely used for flower beds or potted flowers as a vegetative propagation system is being applied with interest. Coleus is of a tropical origin, and the optimum temperature for growth is 20–25°C, and it requires a temperature of 10°C or higher to overwinter, and withers below 5°C. Coleus is a foliage plant but when sown in February, the flower stalk rises and blooms from June to October, and it has colorful leaves and is suitable for potted flowers and flower beds (RDA, 2018). However, there is insufficient research on the psychological effects and coleus preferences that can be used when creating summer tropical style street flower beds. Coleus is a variegated plant with a unique leaf color with two or more colors combined such as green, pink, red, dark red, and purple, which changes sensitively to the area of each color depending on the change in the light environment (Garland et al., 2010). In particular, since more than 70% of information is received by sight among the five human senses (Whang et al., 1997), the various leaf colors of coleus are closely related to colors and emotions in the visual environment in image recognition (Janssens, 2001; Ou et al., 2004) and can be used importantly in understanding how the visual image of plants is perceived by users as a visual environment (Lee and Bang, 1996).
Accordingly, this study examined the preference and image sensibility for colors and shapes of coleus leaves to apply to flowers for tropical style street landscape when creating summer flower beds such as tropical style street flower beds in public facilities like museums, art galleries, and government office buildings in Korea similar to the exotic and diverse tropical climate.
Research Methods
Demographic background of respondents
A survey was conducted on 148 general subjects, and the responses from 136 subjects were analyzed excluding 12 inadequate copies of the questionnaire (Table 1). The mean age of all respondents was 42.34 ± 13.46, and 39 were male (28.7%) and 97 were female (71.3%). Most were in their 30s (27.9%), followed by 40s (20.6%), 20s (18.4%), 50s (17.7%), and 60s or above (15.4%). Most were university graduates (or students) (59.5%), followed by graduate school graduates (or students) (28.7%) and high school graduates (11.8%). For average monthly household income, most earned KRW 2 million or less (39.8%), followed by KRW 2.01–3 million (33.1%), KRW 3.01–4 million (17.3%), KRW 4.01–5 million (5.3%), and KRW 5.01 million or more (4.5%). For occupation, most were company employees (29.4%), followed by professionals (18.4%), others (16.9%), students (12.5%), agriculture/forestry/fishery (8.8%), self–employed (7.4%), and housewives (6.6%).

Characteristic of survey respondents (N = 136)
Analysis of psychological characteristics of respondents
The pant gardening activity level scale, Korean Perceived Stress Scale, and World Health Organization Quality of Life Assessment Instrument (WHOQOL-BREF) were used as assessment tools for psychological characteristics.
Plant gardening activity level
The plant gardening activity level scale was examined to find out the level of experience or awareness among the respondents about plants. This scale consists of total 12 items in 3 domains with 4 items each, such as plant growing experience, plant preference tendency, and plant-elated event (RDA, 2017; Jang et al., 2018a). The items were rated on a 7-point Likert scale (1 point: most negative - 7 points: most positive), with higher scores indicating a higher level of plant growing experience or awareness. The reliability coefficient (Cronbach’s α) in previous studies was .890 in the online survey and .947 in the offline survey. The Cronbach’s α of the plant gardening activity level scale used in this study was 0.898 for plant growing experience, 0.808 for plant preference tendency, and 0.859 for plant-related event.
Korean Perceived Stress Scale (PSS-K)
This study used the Korean Perceived Stress Scale (PSS-K) based on the PSS-10 (Perceived stress scale) by Cohen and Williamson (1988) adapted by Baek (2010). This scale consists of 10 items, and the scores of the responses are summed up to determine the level of stress in 4 levels, with higher total score indicating a higher level of perceived stress. Level 1 scores range from 0 to 13 and are considered ‘normal stress in which stress factors are not serious or accepted as good stress’, Level 2 scores exceed 13 and are considered ‘the level that began to be affected by stress’, Level 3 scores exceed 17 and are considered ‘the state likely to develop into a mental disease’, and Level 4 scores exceed 19 and a re considered ‘The state that requires professional help’. Each item is rated on a 5-point Likert scale (never 0 - very often 4). Cronbach’s α of this study is .803.
World Health Organization Quality of Life Assessment Instrument (WHOQOL-BREF)
This study used the short version of the Korean WHOQOL-BREF. WHOQOL-BREF consists of total 26 items in 5 domains. The domains are the overall quality of life domain (2 items), physical health domain (7 items), psychological domain (6 items), social domain (3 items), and living environment domain (8 items) (The WHOQOL group, 1995; Min et al., 2000). Each item is rated on a 5-point Likert scale (1 = never – 5 = very often), with higher scores indicating higher quality of life. The reliability coefficient (Cronbach’s α) in previous studies was .898, and the reliability of each domain was .593 in the overall quality of life domain, .777 in the physical health domain, .713 in the psychological domain, .583 in the social domain, and .765 in the living environment domain. The reliability coefficient (Cronbach’s α) of WHOQOL-BREF in this study was .948, and the reliability of each domain was .707 in the overall quality of life domain, .811 in the physical health domain, .799 in the psychological domain, .810 in the social domain, and .869 in the living environment domain.
Emotions on coleus using semantic differential (SD)
Semantic differential (SD) is widely used for landscape assessment or quantification of the relationship between emotional adjectives or major emotional factors extracted by factor analysis, which difficult to quantify depending on subjective preference and taste of individuals (Jang et al., 2011). The SD method suggested by Osgood et al. (1952) was used by extracting 13 pairs of emotional adjectives that can be related to plants among image adjectives for landscape assessment (Im, 2009) for emotional images that respondents feel when they see images of plants (Lee, 2006; Kim, 2009; Jang et al., 2011). 13 pairs of adjectives were presented in a 5-point Likert scale, and respondents were asked to rate them according to how they felt (Jang et al., 2011, 2014). In this study, the Cronbach’s α of 13 pairs of emotional words was .968
Preference and repurchase intention of respondents
Preference in coleus cultivars
Based on purchase accessibility, propagation, ease of transplantation and cultivation management, and diversity of leaf shape or color, we selected coleus (Coleus scutellarioides) cultivars such as ‘Lime Delight’, ‘Limewire’, ‘Pinkplosion’, ‘Electric Lime, ‘Henna’, ‘Indian Summer’, ‘Heartbreaker’, and ‘Dragon Heart’ (Fig. 1). Coleus was photographed in a glass greenhouse of the National Institute of Horticultural and Herbal Science in the same environment to investigate the preference in 8 coleus cultivars, and photos of each cultivar (5 cm in width and 7 cm in height) with clear leaf shape and color were presented in the questionnaire for respondents to rate the preference on a 5 - point Likert scale. In this study, the reliability coefficient (Cronbach’s α) of coleus plant preference was .847.
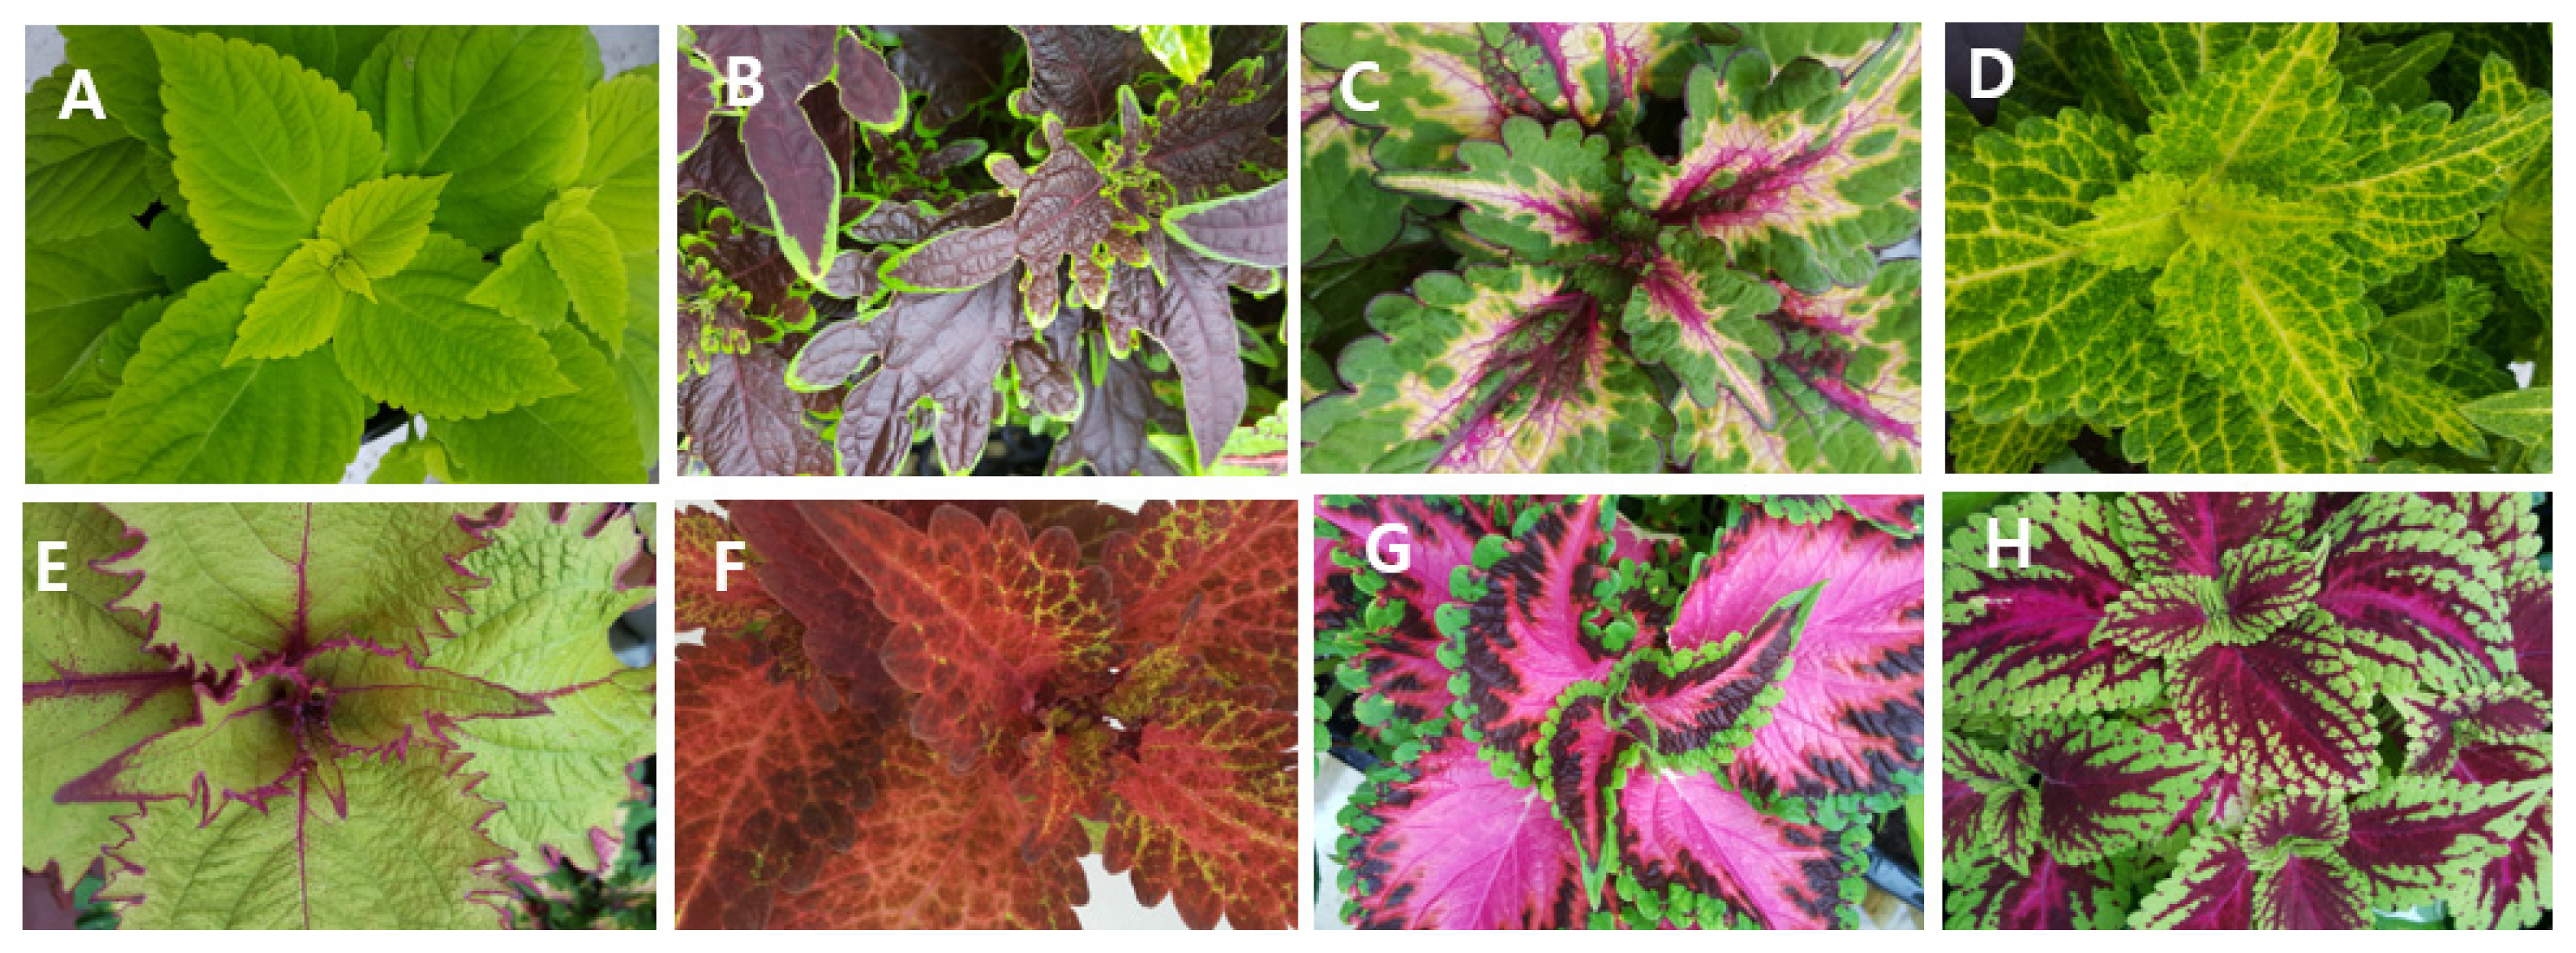
Experimental plant used in the survey. (A) Coleus scutellarioides ‘Lime Delight’; (B) ‘Limewire’; (C) ‘Pinkplosion’; (D) ‘Electric Lime; (E) ‘Henna’; (F) ‘Indian Summer; (G) ‘Heartbreaker’; (H) ‘Dragon Heart’.
Perceived importance of plants
The perceived importance of plants was measured based on related literature (Kwak, 2004), and in this study, we adjusted the scale comprised of total 22 items in 6 domains used by Jang et al. (2011) into total 18 items that are more suitable for this study, having each item rated on a 5 - point Likert scale. Cronbach’s α in previous studies was .882, and Cronbach’s α of the scale measuring 6 domains in this study was .835. The subfactors of 6 importance domains are: Factor 1 ‘emotional relaxation to feel stable and relaxed through plants’, Factor 2 ‘covers that can feel stuffy due to excessive green area or light blocked by plants’, Factor 3 ‘esthetics that can soften the artificial environment’, Factor 4 ‘naturalistic that makes one feel a sense of space and seasons like a forest by arranging plants’, Factor 5 ‘distinct emotion felt through the unique natural fragrance and color of plants’, and Factor 6 ‘environmental factor related to like space and air conditioning that can be obtained from plants’ (Jang et al., 2011).
Loyalty to plants
Loyalty used in this study is expressed as the consumer’s desire to repurchase, defined as the consumer’s commitment, and can be divided into emotional, cognitive, and behavioral loyalty (Oliver, 1999). Customers have repurchase intention if they are satisfied with such emotional or cognitive loyalty as they encounter coleus, and tend to recommend to people they know (Zeithaml et al., 1996). The loyalty scale used in this study was comprised of 5 items from loyalty A to E by readjusting the customer loyalty scale used by Gremler (1995) according to the condition of the coleus plant, with each item rated on a 5-point Likert scale (1: negative - 5: positive) (Zeisel, 1981). The Cronbach’s α of loyalty in this study was .889.
Statistical analysis
Statistical analysis of this study was conducted using IBM SPSS ver. 25.0. Reliability of the measurement tool was analyzed by calculating Cronbach’s α. One-way ANOVA was conducted for plant gardening activity level, PSS-K, WHOQOL-BREF, SD method, preference in coleus, and importance of plants, and Tukey’s multiple range test was conducted for post-hoc testing. Pearson’s correlation analysis was conducted on the correlation between key variables, image adjectives, emotional words, and preference. Frequency analysis was conducted on demographic characteristics. Regression analysis was conducted to analyze the effects of key variables such as plant gardening activity level and demographic variables on loyalty. In the survey on demographics, gender, age, education, occupation, and place of residence were surveyed on a nominal scale and thus were converted into dummy variables in regression analysis. For occupation, total 7 occupational clusters were converted into dummy variables, such as self-employed, professional, student, company employee, agriculture/forestry/fishery, and others. for education, high school, university, and graduate school were converted into dummy variables.
Results and Discussion
Analysis of psychological characteristics of respondents
Plant experience and awareness
As a result of surveying the experience and awareness about plants among the general public, plant-related event (4.79 ± 1.41) was the highest among three factors (plant growing experience, plant preference tendency, and plant-related event), followed by plant preference tendency and plant growing experience. As a result of Tukey’s post-hoc analysis to verify the statistical significance of plant experience and awareness by age (Table 2), there were no statistically significant results between groups in plant growing experience and plant-related event. However, in the plant preference tendency factor, there was a statistically significant result between the group in their 20s and the group over 60 (p < .05), and the mean of plant gardening activity level tended to be higher as the age increased. This result is supported by Jang et al. (2019) who reported in a survey on plant experience and awareness among visitors of a care farming center that older respondents tended to show a higher level of plant growing experience.
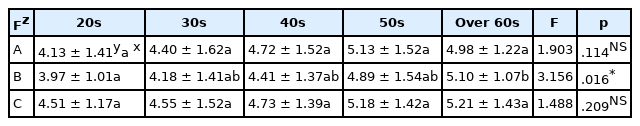
Difference in level of plant gardening activity by age of subjects
The results of examining plant experience and awareness by education showed that the three factors were not statistically significant among all groups (Table 3). As a result of examining plant experience and awareness by occupation (Table 4), in plant growing experience, students showed the lowest mean of 3.66/7, and professionals showed the highest mean of 5.27/7, showing statistically significant results between groups (p < .01).

Difference in level of plant gardening activity by education of subjects
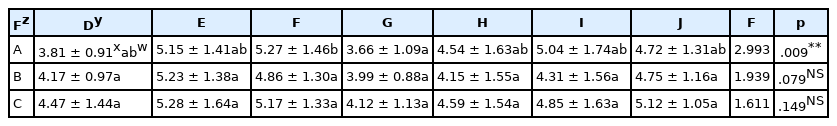
Difference in level of plant gardening activity by occupation of subjects
Korean Perceived Stress Scale
As a result of examining the stress level of respondents with the total score of all items, it was found that most of the demographic matters were not statistically significant (Table 5). As a result of the analysis, there was no statistical significance between groups, but the total scores of most respondents tended to be too high. When these results were interpreted using the stress level questionnaire analysis method, the groups in their 20s to 40s, excluding the group in their 50s, scored a total of 19 points or higher in the four levels, thereby considered ‘the state that requires professional help’. By average monthly income, the group earning KRW 4.01–5 million scored a total of 13 and higher and was lowest in Level 2 considered ‘the level that began to be affected by stress’. The group earning KRW 2–4 million or KRW 5.01 million or more also scored a total of 19 and was in Level 4, ‘the state that requires professional help’. By occupation, housewives scored the lowest at 17.44, followed by self-employed, students, and professionals scoring a total of 17 and higher in Level 3, ‘the state likely to develop into a mental disease’. Company employees and the agriculture/forestry/fishery group scored a total of 19 and higher in Level 4, ‘the state that requires professional help’.
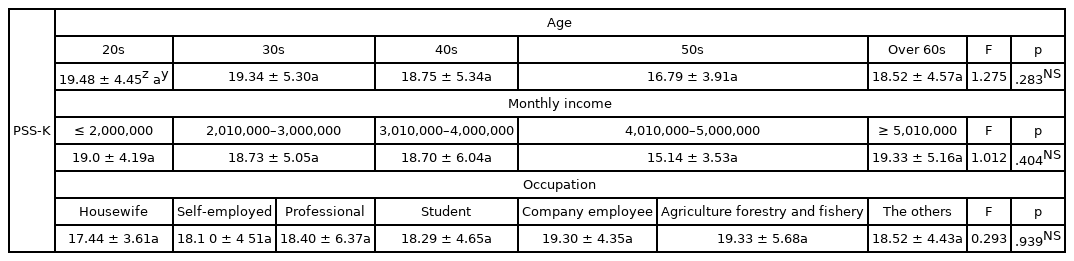
Difference in Korean Perceived Stress Scale by age, monthly income and occupation of subjects
Therefore, the results of this study proved that many people are recently affected by the era of ‘COVID-19 blues’ in which they are suffering from depression or helplessness. The Ministry of Health and Welfare reported in 2021 that the 20s and 30s showed the highest ratio of depression risk at 30.0%, followed by the 40s at 20.5%, 50s at 19.5%, and 60s at 14.4%, which supports this study claiming that the 20s–40s are suffering from severe stress (Ministry of Health and Welfare [MOHW], 2021). However, the report by Jang et al. (2020b) that plant gardening activity had the effect of reducing stress level in a study on the satisfaction and stress of participants in care farming at a care farm suggested that using plants would be very useful in reducing stress that appears to be a severe problem among people today. Furthermore, the report by Urich (1984) and Cimprich (1993) that the use of nature affects stress relief, healing of diseases, and positive emotions supports the need for the analysis results in this study such as interest, importance, and loyalty toward plants.
Korean version of WHOQOL-BREF
As a result of examining the difference in quality of life according to demographic characteristics through WHOQOL-BREF, the average quality of life of 136 subjects was 3.38 ± 0.61. Moreover, 5 domains such as overall quality of life, physical health, psychological, social, and living environment domains were analyzed according to demographic characteristics. The results showed that there was statistical significance in the social domain among 5 domains by age and place of residence. There was no statistical significance between groups by education, average monthly income, occupation, and type of residence (Table 6). By age, the 20s showed higher scores than the 60s in the social domain. By place of residence, metropolitan cities showed higher scores than Seoul with statistical significance (Table 7). This result is supported by Jang et al. (2020a) who reported that 20s and 30s showed higher scores than 50s in physical and social domains in the preference and psychological assessment of plant types and colors for gardening activities of firefighters, which indicated that younger people are more socially active.

Differences in World Health Organization Quality of Life Assessment Instrument by age of subjects
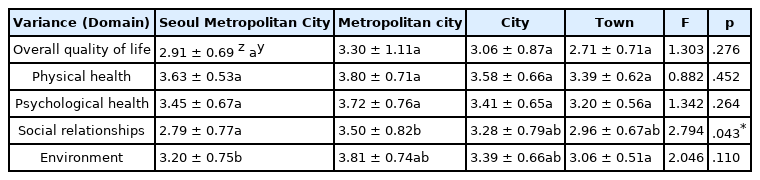
Differences in World Health Organization Quality of Life Assessment Instrument by age of subjects
Perceived importance of plants
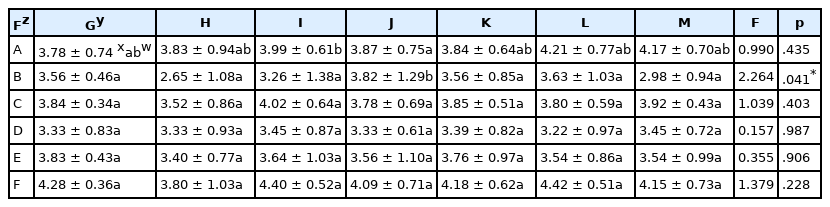
As a result of examining the perceived importance of plants (Table 8–12), environmental (mean 4.20 ± 0.66) and emotional relaxation (mean 3.96 ± 0.70) showed high importance. In particular, the environmental factor was higher in the 30s and 40s than in the 60s or older, and higher in those who graduated graduate school than those who graduated high school. The covers factor was higher in the 30s than 60s or older, in students than self-employed, in the group earning KRW 2 million or less than KRW 5.01 million or more, and in those living in metropolitan cities than Seoul, showing statistically significant differences. This result is supported by the study on importance of foliage plants according to visual elements by Jang et al. (2018b), which reported that the 40s considered the environmental factor most important and thus there is a difference in factors considered important when dealing with plants depending on age.
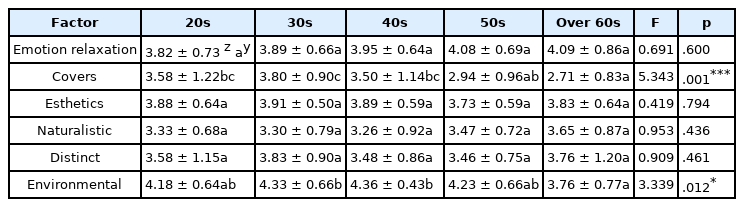
Difference in level of importance by age of subjects
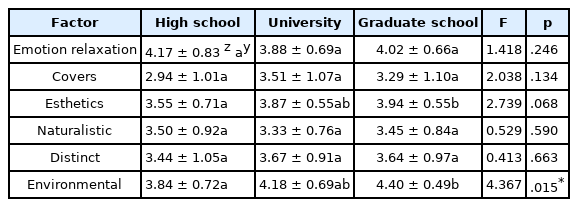
Difference in level of importance by education of subjects
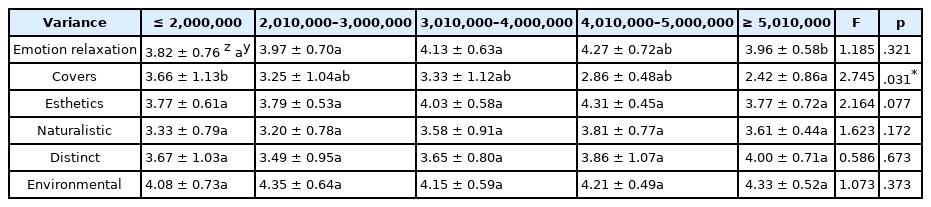
Difference in level of importance by monthly income of subjects
Difference in level of importance by occupation of subjects
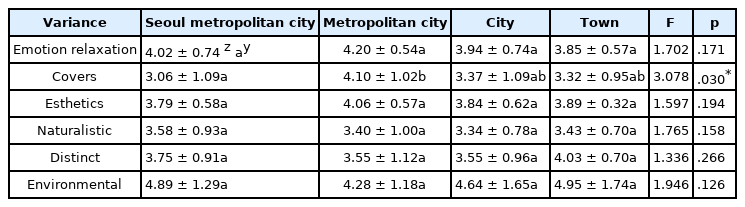
Difference in level of importance by living area of subjects
Emotional response by coleus cultivar
As a result of examining emotional responses to 8 coleus cultivars on a 5-point Likert scale using 13 pairs of emotional adjectives that can be used to express plants (Table 13 and Fig. 2), there was a statistically significant difference in the emotional responses of respondents toward each coleus cultivar (p < .05). C. scutellarioides ‘Lime Delight’ was expressed by emotional words such as ‘calm’, ‘comfortable’, and ‘like’; ‘Limewire’ by ‘fancy’, ‘dark’, and ‘concentrated’; and ‘Pinkplosion’, ‘Henna’, and ‘Heartbreaker’ by ‘fancy’, ‘bright’, and ‘spirited’. ‘Electric Lime’ was expressed by emotional words such as ‘fancy’, ‘bright’, and ‘relaxed’; ‘Indian Summer’ by ‘fancy’, ‘warm’, and ‘distracted’; and ‘Dragon Heart’ by ‘fancy’, ‘spirited’, and ‘warm’. ‘Lime Delight’ that showed highest preference among 8 coleus cultivars was expressed by emotional words such as ‘calm’, ‘comfortable’, and ‘like’ (Table 13 and Fig. 2). These results are consistent with the report by Yoo (2007) that ‘calm’ and ‘comfortable’ appeared as common adjectives in green plants like Spathiphyllum spp. and Rhapis excelsa in the study of imaging indoor plants by space type for indoor landscape design. As such, feeling calm and comfortable when encountering plants is similar to this study in which ‘calm’, ‘comfortable’, and ‘like’ turned out to be the main emotional responses to ‘Lime Delight’ in which all leaves are green among 8 coleus cultivars.

The difference of emotional words among eight coleus cultivars
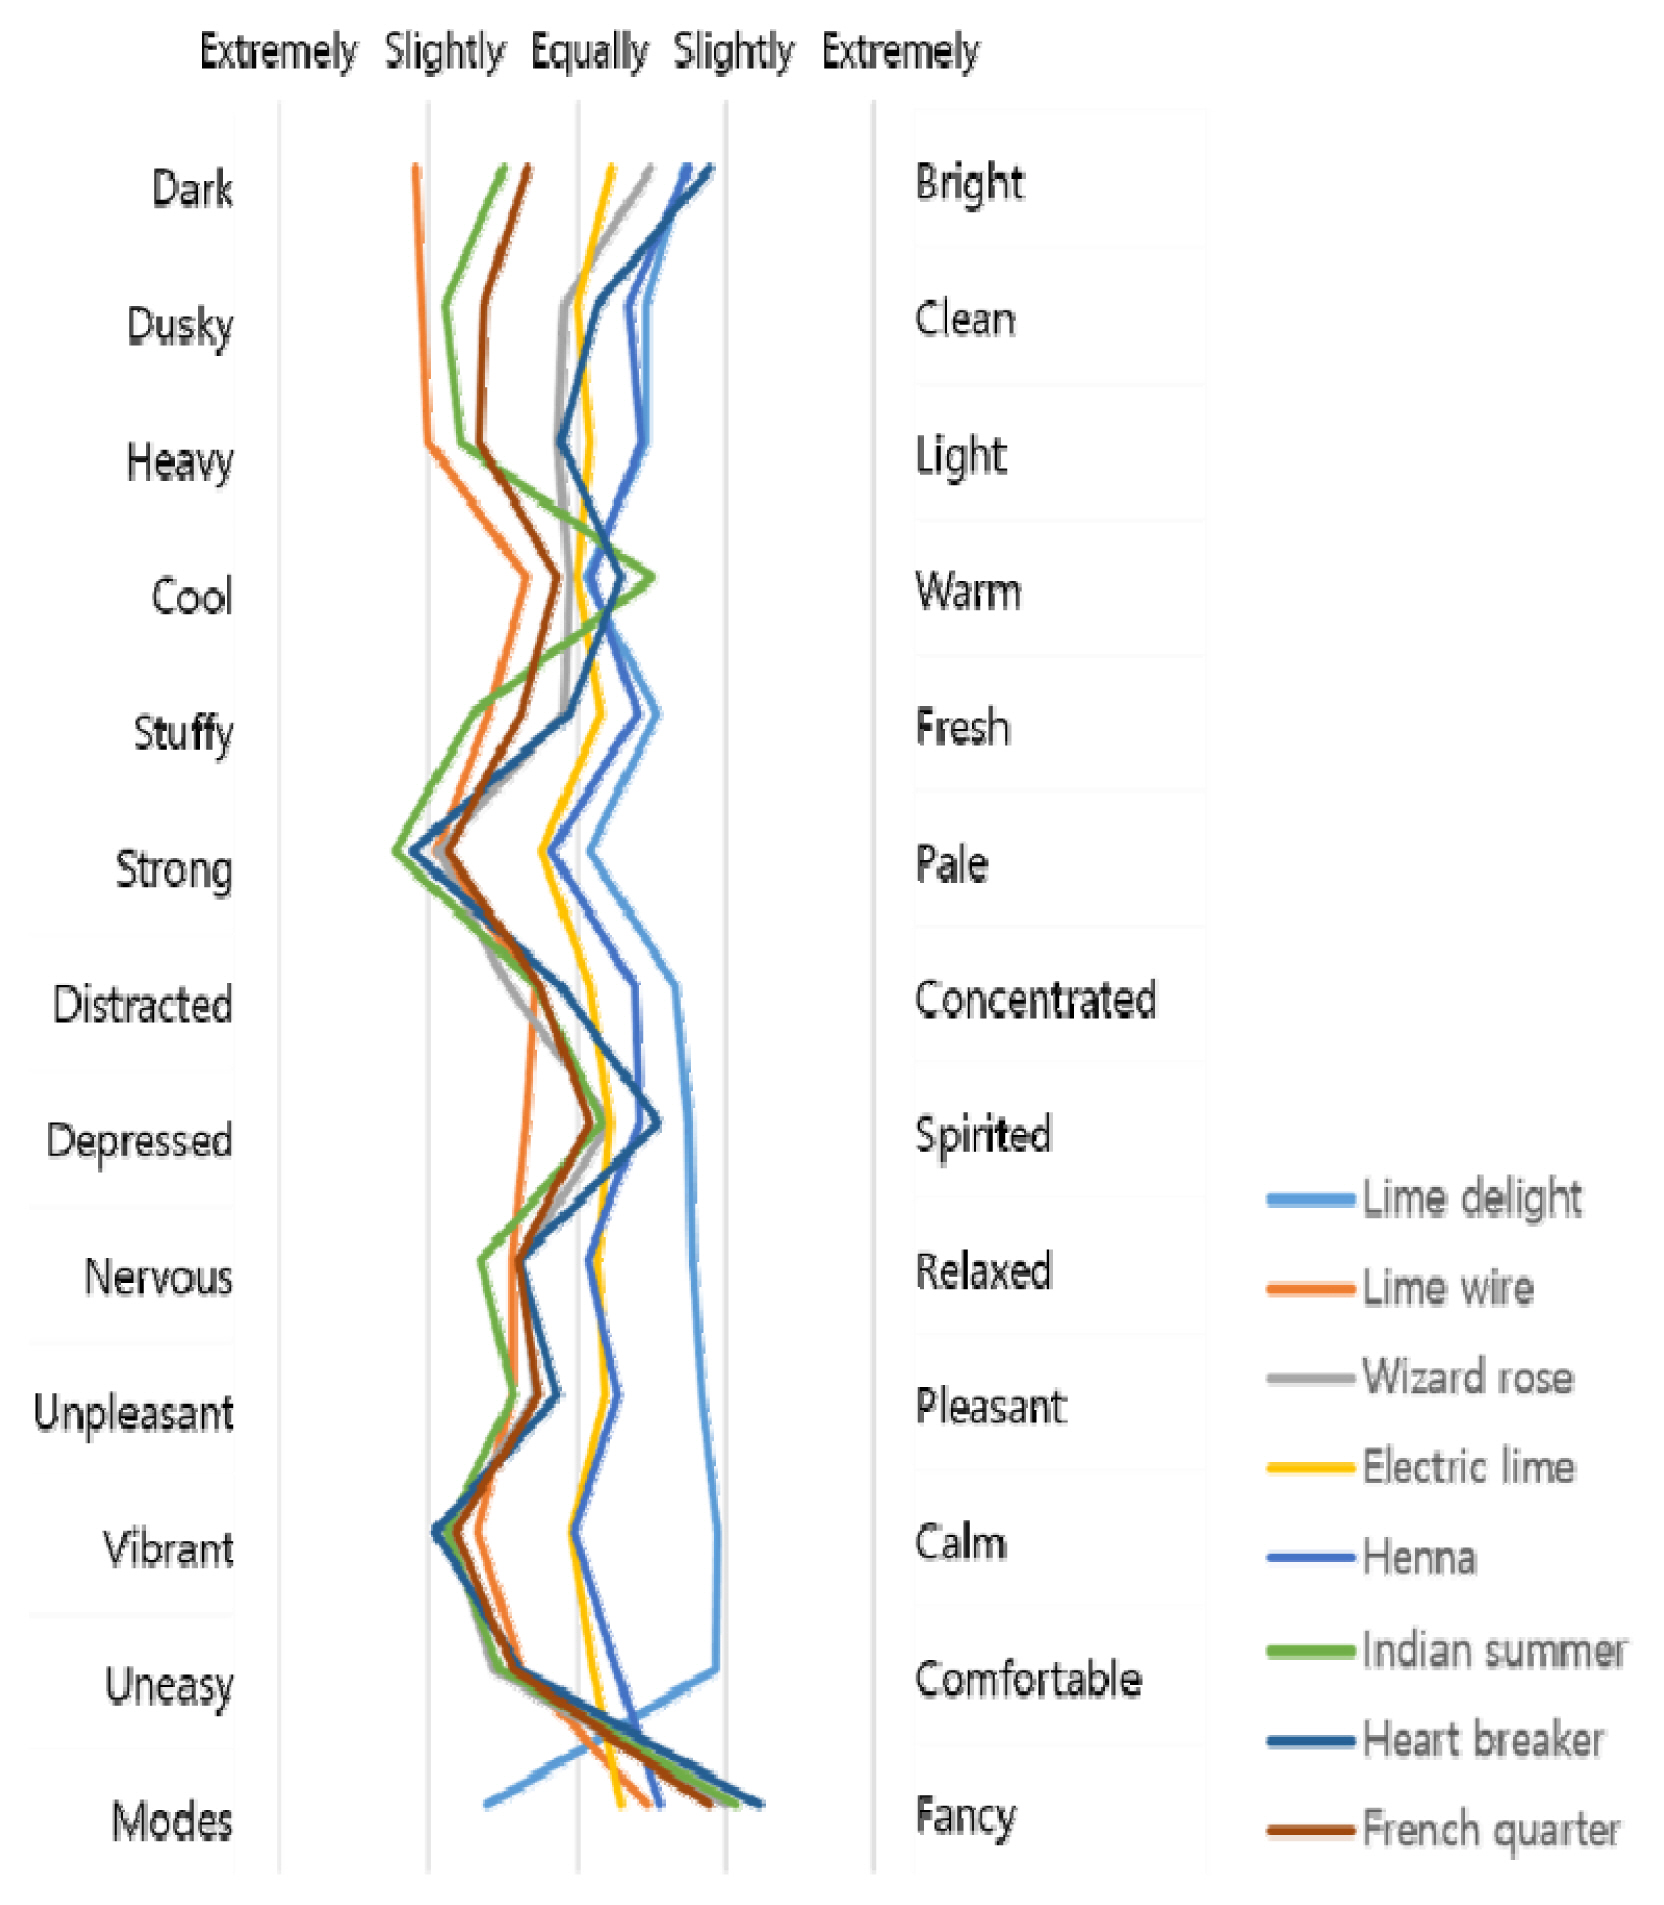
The difference of emotional words between the eight plants kinds of plant.
Correlation between preference by coleus cultivar and emotional words
As a result of examining the correlation between the preference of 8 coleus cultivars and emotional words (Table 14), there was mostly a positive correlation between coleus cultivar preference and emotional words. As a result of examining the correlation between coleus cultivar preference and emotional words, C. scutellarioides ‘Dragon Heart’ showed the highest positive correlation of .8 or more with ‘dislike - like’ among 8 coleus cultivars, and high correlation of .6 or more with ‘depressed - spirited’ and ‘uneasy - comfortable’. ‘Lime Delight’, ‘Pinkplosion’, and ‘Henna’ showed high positive correlation with ‘dislike - like’ and ‘stuffy - fresh’; ‘Limewire’, ‘Electric Lime’, and ‘Indian Summer’ with ‘dislike - like’, ‘uneasy - comfortable’; and ‘Heartbreaker’ with ‘dislike - like’ and ‘depressed - spirited’ (Table 14). Higher preference for 8 coleus cultivars leads mostly to more positive emotional words such as ‘like’, ‘calm’, ‘fresh’, and ‘comfortable’, and lower preference leads to more negative emotional words such as ‘dislike’, ‘uneasy’, and ‘depressed’. Jang et al. (2014) who reported in a psychological effect analysis on green offices that higher green interior effect leads to the positive correlation of higher pleasure and calmness supports the results of this study that higher preference for 8 coleus cultivars leads to higher emotions such as ‘like’, ‘calm’, ‘fresh’, and ‘comfortable’.

Correlation between preference of Coleus scutellarioides and emotional words
Respondent preference for 8 coleus cultivars
As a result of examining the respondent preference for 8 coleus cultivars (Table 15), F-value was 14.743 and p-value was .001, showing a statistically significant difference in respondent preference for 8 coleus cultivars. C. scutellarioides ‘Lime Delight’ showed the highest preference at 3.41, followed by ‘Henna’ > ‘Electric Lime’ > ‘Heartbreaker’ > ‘Dragon Heart’ > ‘Pinkplosion’ > ‘Indian Summer’ > ‘Limewire’. ‘Lime Delight’ with highest preference has the single color of green, and the result of this study is supported by many color preference studies (Janssens, 2001; Chong et al., 2004; Ou et al., 2004) proving that blue and green show high emotional preference.
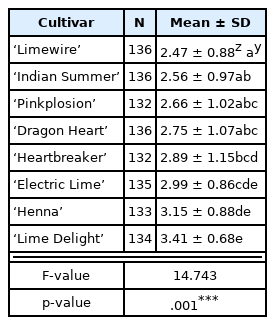
The preference of eight cultivars of Coleus scutellarioides to the objects
Correlation among key variables related to coleus
The correlation among coleus preference, Korean Perceived Stress Scale (PSS-K), Korean version of WHOQOL-BREF (World Health Organization Quality of Life Assessment Instrument), plant gardening activity level, and plant importance and loyalty ranged from −.24 to .68, indicating that there is relevance among variables. Coleus preference, quality of life, plant gardening activity level, and plant importance and loyalty showed a negative correlation with stress level, indicating that higher plant preference, PSS-K, plant gardening activity level, importance, and loyalty lead to lower stress level. In particular, plant loyalty and plant gardening activity level showed a high positive correlation of .68 or higher (Table 16). Yoon (2021) reported in the study on the necessity and preference for urban flower landscape that there were many opinions that ‘flower landscape is highly needed’ and ‘flower landscape is highly preferred’, and thus citizens show high expectations, interest, and favorability toward the role of flowers in urban landscape. This supports the results of this study that there was highest correlation between plant loyalty and plant gardening activity level. In particular, the result of the survey on the necessity and preference for places to apply flower landscape provided that out of 8 places, the need for street landscape was 4th and the place preference was highest (Yoon, 2021), which supports the need for tropical style street flower beds pursued in this study.
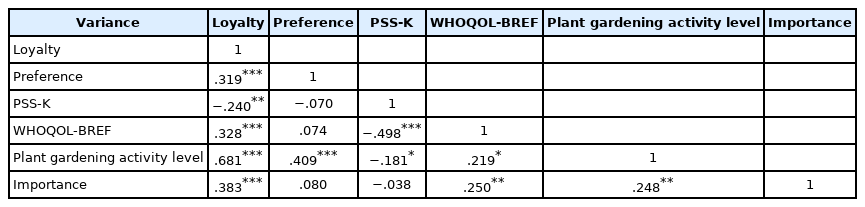
Correlation between preference, Korean Perceived Stress Scale (PSS-K), WHOQOL-BREF, level of plant gardening activity, importance and loyalty of subjects
Effect of respondents’ key variables and demographic variables on loyalty
Multiple regression analysis was conducted to examine the effects of key variables and demographic variables such as plant gardening activity level and stress level on the loyalty of the survey respondents (Table 17). The tolerance and VIF of the collinearity statistic were close to 1 in the multicollinearity diagnosis to see if each independent variable is independent, and thus the correlation between independent variables was low, thereby proving that there was no multicollinearity. Durbin-Watson test that shows autocorrelation was close to 2, thereby proving that there was no autocorrelation. Moreover, the adjusted R2 in this study was all at least 0.2, thereby showing sufficient explanatory power (data not shown). Therefore, we conducted a multiple regression analysis including dummy variables to determine the effect of plant gardening activity level (3 factors: plant gardening activity, plant preference tendency, and plant-related event), PSS-K, importance (6 factors: emotional relaxation, covers, esthetics, naturalistic, distinct, and environmental), Korean version of WHOQOL-BREF (5 factors: overall quality of life and satisfaction domain, physical health domain, psychological domain, social domain, and living environment domain), and control variables such as demographic variables on loyalty. The results showed that plant-related event out of 3 factors of the plant gardening activity level scale, covers out of 6 factors of importance, and psychological domain and living environment domain out of 5 factors of the Korean version of WHOQOL-BREF, male respondents, and respondents in their 30s and 50s turned out to be the variables affecting loyalty. In other words, more plant-related events, higher psychological domain and living environment domain, and 30s and 50s respondents showed higher loyalty. As for importance factors, high covers and male respondents showed lower loyalty. Control variables of respondents such as education level, average monthly income, occupation, and place of residence did not have an effect on loyalty.

The effect of level of plant gardening activity, importance, Korean Perceived Stress Scale, WHOQOL-BREF and demographic variables on loyalty
These variables explain loyalty by about 66%, and plant-related event of plant gardening activity level shows highest explanatory power at 49%, which increased by 8% and 3% each when adding the physical health domain of WHOQOL-BREF and age (50–59), and by 2%, 2%, 1%, and 1% each when adding covers, the living environment domain of WHOQOL-BREF, gender (male), and age (30s), thereby having total 66% explanatory power. Moreover, F-value 35.17 was significant at p < .001, showing that the regression equation below is suitable. Therefore, the relative explanatory power for independent variables affecting loyalty of respondents showed highest effect in the order of plant-related event, physical health domain, age (50s), covers, living environment domain, gender (male), and age (30s), and plant-related event out of 3 factors of the plant gardening activity level scale was the most influential variable.
When a certain environment has many attractive elements, it naturally captures attention without effort (Kaplan, 1993), and encountering the natural environment helps recover attention and reduces negative impacts such as stress (Lee, 2007). These studies support the usefulness of the results of this study proving that plant gardening activity level, stress, quality of life, plant preference, and importance affect respondent loyalty to plants.
Conclusion
This study was conducted to examine the preferences and repurchase intentions of respondents for 8 coleus (C. scutellarioides) cultivars for the application as flowers for tropical style street landscape. A survey was conducted on 148 general respondents, and the responses from 136 respondents were analyzed excluding 12 inappropriate copies. The average age of all respondents was 42.3 ± 13.5, and there were 38 male and 97 female respondents. We analyzed the psychological indicators of plants with demographic variables of respondents for 3 factors of the plant gardening activity level, such as plant growing experience, plant preference tendency, and plant-related event. The results showed that plant preference tendency was lowest in the 20s and highest in the 60s and above, indicating that plant preference tendency increased with statistical significance in older age groups. Out of 6 factors on perceived importance of plants, environmental factor and emotional relaxation factor for improved quality of life were high. By age, the 30s–50s considered the environmental factor important, showing a statistically significant difference. As a result of examining the emotional responses felt by looking at the images of 8 coleus cultivars, there was a statistically significant difference among cultivars, and ‘calm’ and ‘comfortable’ were representative emotional words, and ‘Lime Delight’ showed the highest cultivar preference. There was a positive correlation between loyalty to coleus, preference, Korean version of WHOQOL-BREF (World Health Organization Quality of Life Assessment Instrument), plant gardening activity level, and plant importance, and a negative correlation with PSS-K (Korean Perceived Stress Scale). We conducted a multiple regression analysis including dummy variables to examine the effect of plant gardening activity level, PSS-K, and Korean version of WHOQOL-BREF on loyalty of survey respondents. The results showed that for relative explanatory power for independent variables affecting loyalty of respondents, the effect was greatest in the order of plant-related event, physical health domain, age (50s), covers, living environment domain, gender (male), and age (30s). Among 3 factors of the plant gardening activity level scale, plant-related event turned out to be the most influential variable. This result supports the usefulness of plants such as stress relief, emotional relaxation, and psychological stability through plants in a situation with high environmental or emotional stress such as particulate matter. Furthermore, considering that the preference for single-color green coleus was highest rather than mixed-color coleus, it seems more desirable to use green that relaxes people rather than mixing strong colors in plantation. Therefore, the results of this study are expected to be used as a reference for expanding the use of coleus. Adopting flower street landscape will help reduce environmental issues such as the serious particulate matter nationwide or other negative elements such as stress and depression that have increased since the outbreak of COVID-19. It will also help increase added values for those involved in relevant industries such as flower farms or flower garden businesses and improve the quality of life for citizens. Moreover, by commercializing summer tropical style street flower beds into new business that can involve relevant workers in plant rental or management, it would be possible to exert a positive impact on creating new jobs.
Notes
This study was supported by the 2022 Horticultural and Herbal Science Program of the National Institute of Horticultural and Herbal Science of the Rural Development Administration (PJ01602401).