Analyzing the Effect of River Ecosystem Fragmentation by Bridges on Changes in the Wintering Population of Whooper Swans (Cygnus cygnus): Targeting the Nakdong River, Busan
Article information

Abstract
Background and objective
Fragmentation of river ecosystems is expected to affect biodiversity loss, but bridge construction is proceeding without consideration in urban areas. This study was conducted to determine the effect of internal environmental factors and river ecosystem fragmentation caused by bridge construction on the population of wintering whooper swans (Cygnus cygnus) in the Nakdong River of Busan Metropolitan City, a key wintering site for whooper swans.
Methods
To compare the wintering population according to the distance between bridges, we surveyed and analyzed the current status of the population by period, distance between bridges, and land cover. One-way ANOVA and post-hoc test were conducted to confirm whether the differences in the environmental factors of the wintering sites, such as the distance between bridges, land cover status, and the number of wintering individuals, were statistically significant.
Results
83.6–94.7% of the wintering population in the lower Nakdong River were observed in Sec. 2 (Nakdong River Estuary Bank-Seobusan Nakdong River Bridge, 5.3 km) and Sec.4 (Gamjeon-Iron Bridge-Nakdong River Hwaengdansugwan Bridge, 3.6 km). As for the distance between the feeding and resting places of whooper swans and the bridges, whooper swans used the waterside and wetlands at an average distance of 1,147.5 m (10.9–2,611.2 m) from the bridge.
Conclusion
Considering the weight of male swans and the presence of young individuals, as well as disturbance factors such as the noise and speed of vehicles crossing the bridges, it is necessary to maintain at least a 4 km distance between bridges for stable wintering. In addition, since fragmentation of river ecosystems has been confirmed to have an adverse effect on biodiversity, it would be desirable to keep the ecosystem intact and connected.
Introduction
Habitat loss and fragmentation caused by various developments around the world are not only constant but also occurring on an unprecedented scale, accelerating biodiversity loss (Betts et al., 2017; Haddad et al., 2015; Hansen et al., 2013). In particular, due to natural habitat loss, fragmentation, and devastation occurring in the northern hemisphere where development is concentrated (Kuipers et al., 2021; Luther et al., 2020), there has been not only biodiversity loss and potential trophic degradation (Terborgh et al., 2001) but also the loss of ecosystem services (Dobson et al., 2006; Layman et al., 2007; Groffman et al., 2014). Moreover, IPCC (2014) claimed that in a scenario where about 14–29% of species would become extinct when the Earth's temperature increased by 1.5–3°C, wetlands would capture about 2.5–5 times more carbon than forests, grasslands, and rainforests, which is why they have great importance as a storage (www.visualcapitalist.com). Furthermore, the rich nutrients of wetlands can induce diversification of species composition by increasing plant species diversity and providing habitats for rare or uncommon species, while also providing habitats for nesting, spawning, bedding, and brooding of wild birds as well as space for food, rest, protection, and social interaction (Stewart, 2001).
Despite their importance as a carbon repository and habitat, it is estimated that 64–71% of wetlands have been damaged in the 20th century, although the percentage varies among countries, and the damage continues to this day (Gardner et al., 2015). The United States lost more than 30% of coastal and freshwater wetlands as Europeans began to settle since the Industrial Revolution in the 18th century, and China lost about 25–30% due to development over 35 years, during which the population of wild birds also began to decrease (Dahl, 1990; Craft, 2016). Since such loss can threaten the livelihoods of local residents who depend on ecosystem services in addition to causing problems such as species reduction or extinction, it is necessary to set conservation goals at the biosphere and regional level (Gregory and van Strien, 2010). In particular, since rare and endangered species are vulnerable to habitat isolation (Luther et al., 2020), it is important to keep the ecosystems intact as environmental changes and habitat fragmented induced by humans bring severe threats to survival.
Meanwhile, Cygnus spp. wintering in the wetlands of China, Korea, and Japan located in East Asia have been increasing since 1970. This is due to the increased public interest along with the designation of breeding areas as protected areas, adequate protection such as excluding human interference, and feeding in wintering areas (Haapanen et al., 1977; Rees et al., 1997; Jia et al., 2016; BirdLife International, 2016, 2019). Population growth is a global trend, affected by the legal protective measures adopted in the early 20th century and the transition of food from aquatic plants to high-energy crops in the late 20th century (Laubek, 1995; Rees et al., 2019). In addition to protection policies and food supply, efforts such as changes in crops and harvest methods due to climate change and economic purposes (Nilsson, 2014) and creation of open water surfaces in farmlands to provide as rest and feeding areas also contributed to the increase (Earnst, 1991; Laubek et al., 2019; Rees et al., 2019). This shows that while legal regulation is also important in protecting endangered species, immediate on-site measures to cope with the changed environment are also important.
Whooper swan (Cygnus cygnus) is a Least Concerned (LC) species of the International Union for Conservation of Nature and Natural Resources (IUCN), and in Korea, it is designated as Natural Monument No. 201 and Class II Endangered Wildlife along with tundra swan (C. columbianus) and mute swan (C. olor) (Birdlife International, 2016). Including coscorob swan (Coscoroba coscoroba), there are a total of 8 species of Cygnus spp. and approximately 1.5–1.6 million individuals alive (Rees et al., 2019). Earlier studies have estimated that there are 266,543 individuals of whooper swans, about 56% of which are in northwestern Europe (Laubek et al., 2019), and about 30,000 in East Asia (Rose and Scott, 1997). However, as the monitoring location and method are improved, the accuracy has increased, revealing that there are up to 42,000–60,000 individuals (Miyabayashi and Mundkur, 1999; Rees et al., 2019; Jia et al., 2016; Ao et al., 2020). As pointed out by Laubek et al. (2019), the population gap occurs due to underestimation in some regions. It is true that the Cygnus spp. population increased due to the climate that turned milder in breeding and non-breeding areas, but there are differences among countries. The population of whooper swans in Korea increased to 4,296 ± 42.66 since the monitoring of wintering birds began in 1999, but that of tundra swans decreased (Jia et al., 2016; Choi et al., 2018).
Meanwhile, out of 28 wintering sites that are important in East Asia, 6 are located in Korea including Nakdong Estuary and Seohaean (West Coast), and the population is increasing (Ao et al., 2020). However, the population rapidly decreased by −0.77% a year for 18 years in the estuary of the Nakdong River taking up about 26.22% of wintering individuals (Choi et al., 2018). This is caused by the disconnection to freshwater due to the formation of the estuary bank and the reduction of Flatstalk bulrush in mudflats (Choi et al., 2018; Ao et al., 2020). The Nakdong River can be divided into estuary that borders on the open sea and downstream that is on the upper part of the estuary bank, and the decreasing population of whooper swans in the estuary leads to the increase in the downstream. However, the population in the downstream of the Nakdong River was fluctuating greatly due to disturbances such as maintenance work due to the Four Major Rivers Project, fragmentation by bridges in the metropolitan area, and use of riverside or water surface.
For the population of wintering whooper swans in the downstream of the Nakdong River, distance between bridges turned out to have a crucial impact on reduction (Hong, 2020), and despite this result, a new bridge construction plan is in progress. Therefore, a detailed investigation on the location as well as flight distance for surface deviation is required to suggest an adequate distance between bridges in addition to the impact that the distance between bridges and surrounding environmental factors have on the wintering of whooper swans. Accordingly, this study verified the effect of environmental factors of each section and river ecosystem fragmentation caused by bridge construction on the population of wintering whooper swans in the Nakdong River of Busan Metropolitan City.
Research Methods
Overview of research sites
The Nakdong River is a river about 496.7 km long, rising from Hwangji Pond in Taebaek and flowing into Namhae (South Sea) (Kim, 2018). The estuary and downstream where the dunes are widely developed were designated as natural monument on July 23, 1966 as a sanctuary of migratory birds inhabiting endangered species such as whooper swans, tundra swans, Grus vipio, Ciconia boyciana, Platalea minor, Aquila chrysaetos (Cultural Heritage Administration, 2019). It had been Gimhae in terms of administrative district, but since being included into Busan Metropolitan City in 1978, farmlands and forests decreased and urban land use such as industrial complexes, residential areas, and roads increased, which began to damage the habitat functions (Hur et al., 1999; Lee and Hong, 2008; Lee, 2008). Currently, the 87,279,741 m2 land of 197 Pyeonggang-ro 171beon-gil, Gangseo-gu, Busan (Daejeo 1-dong) is designated as Natural Monument No. 179, and also as special management coastal zone (1982), natural conservation area (1988), and wetland protection area (1999) due to its value as an estuary ecosystem to protect biological resources.
However, some areas were released from the sanctuary of migratory birds after the Nakdong River estuary bank dam was constructed from 1983 to 1987 with the population increase in Busan Metropolitan City. Artificial migratory bird habitats were created in the southernmost area such as Sinho-dong and Daemadeung as compensation for habitats damaged by industrial complex development in 1997 (Hur et al., 1999; Lee, 2008), and Eulsukdo Island Ecological Park was created in 1999 (Lee, 2008). Development activities targeting mudflats and surrounding areas such as estuary bank construction, reclamation, housing development, and industrial complex formation after designation as natural monument reduced the area from 103,271,909 m2 (adjusted in 2008) at the point of designation to 87,279,741 m2. Even after that, reclamation of Sinpyeong-Jangnim General Industrial Complex and Dadae-Myeongji area, new port construction, and Seobusan (western Busan) area development according to designation of Free Economic Zone all reduced the feeding and resting places for winter migratory birds (Hong, 2004a, 2004b; Hur et al., 1999), which may have ended up damaging wildlife habitats.
The Nakdong River branches into the West Nakdong River and the Nakdong River as it enters the Busan Metropolitan City and Gimhae districts. But according to Hong (2004a), there are fewer than 10 whooper swan individuals in the entire West Nakdong River area, and thus it was excluded from research. The first bridge across the Nakdong River in Busan Metropolitan City was Gupo Bridge installed in 1932 and demolished in 2008. Then 12 more bridges were built, such as Gupo Nakdong River Bridge in the 1970s, Seobusan Nakdong River Bridge, Nakdong River Estuary Bank, and Nakdong River Hwaengdansugwan Bridg(N.D.H.D.S.G Bridge) in the 1980s, Gupo Bridge and Gangseo Nakdong River Bridge in the 1990s, Busan Metro Line 3, Eulsukdo Bridge, Myongji Bridge, Gamjeon-Iron Bridge, Daedong Hwamyeong Bridge, Gangbyeon Bridge, and Nakdong River Bridge after 2000 (Hong, 2020). After that, plans are made to newly construct Daejeo Bridge, Sasang Bridge, and Eomgung Bridge to deal with increased logistics flow and traffic volume. Since bridge construction may lead to river ecosystem fragmentation and habitat loss, it is necessary to review the impact on wildlife inhabitation.
The sizes of the bridges across the Nakdong River are as follows (Table 1). The width was 8–51 m, and the length was 973–5,052 m; and Daedong Hwamyeong Bridge was the latest bridge to be constructed in 2012. The heights of the bridges, streetlights, and pylons affecting the migration of whooper swans are as follows. The bridge height was 10.0–23.8 m excluding N.D.H.D.S.G Bridge at 8.9 m, streetlight was 7–11.5 m, and pylon in Daedong Hwamyeong Bridge was 65.5 m. The total height was 20 m or higher except N.D.H.D.S.G Bridge (9.6 m) and Gamjeon-Iron Bridge (14.0 m).

Current status of length, width, and height of bridges constructed in the downstream section of the Nakdong River
Meanwhile, whooper swans are the biggest birds that are relatively easy to observe, and they are a useful indicator species to identify the trend of population change due to the statistical changes of the population and changes in the regional environmental conditions (Rees et al., 2019). Due to these characteristics, whooper swans are considered a suitable species to study how disconnection of the river ecosystem by bridges affects biodiversity loss.
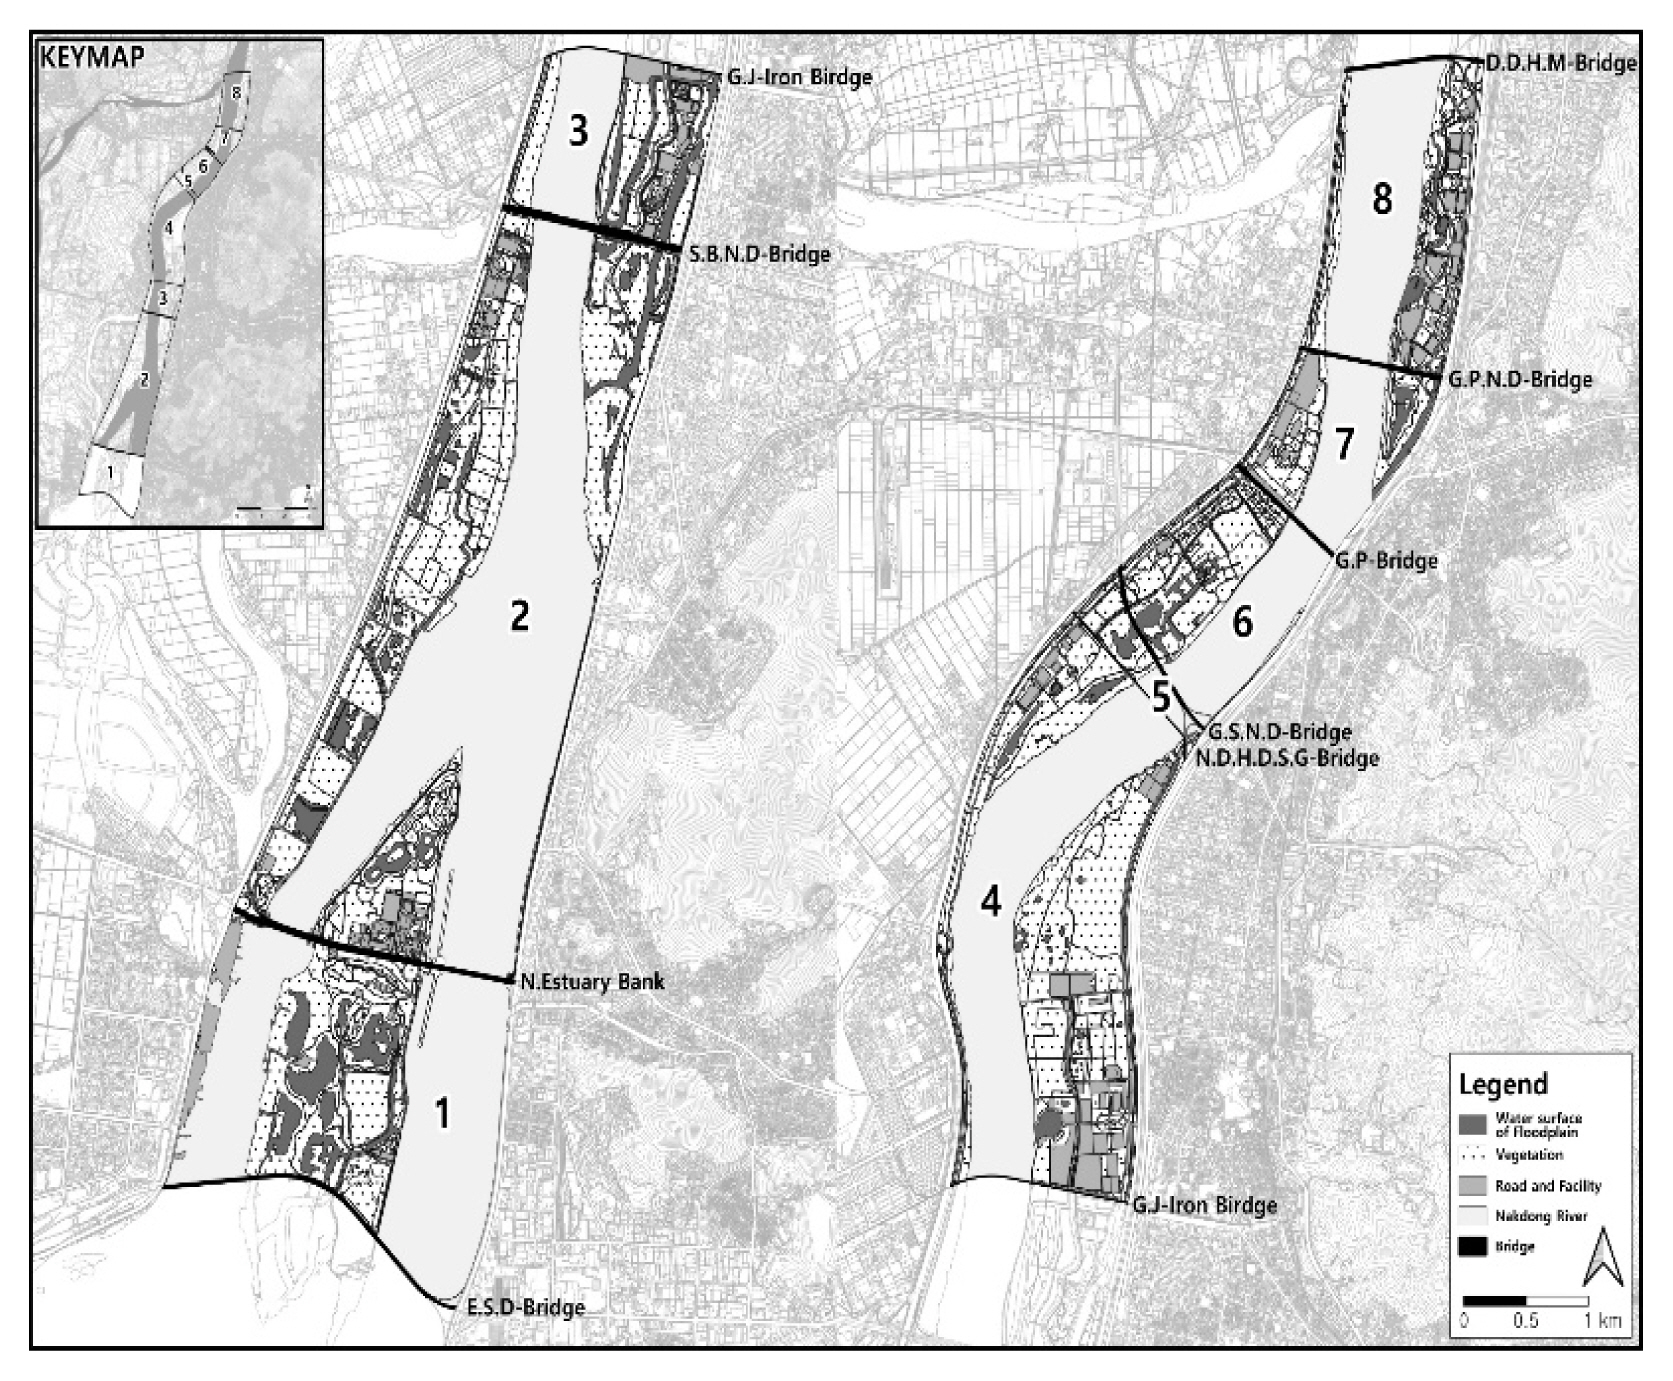
The research sites are classified into Eulsukdo Bridge-Nakdong River Estuary Bank bordering on the estuary (Sec. 1), Nakdong River Estuary Bank-Seobusan Nakdong River Bridge (Sec. 2), Seobusan Nakdong River Bridge-Busan-Gamjeon-Iron Bridge (Sec. 3), Gamjeon-Iron Bridge-N.D.H.D.S.G Bridge (Sec. 4), N.D.H.D.S.G Bridge-Gangseo Nakdong Bridge (Sec. 5), Gangseo Nakdong River Nakdong Bridge-Gupo Bridge (Sec. 6), Gupo Bridge-Gupo Nakdong River Bridge (Sec. 7), and Gupo Nakdong River Bridge-Daedong Hwamyeong Bridge (Sec. 8) (Table 2). We surveyed and analyzed the impact that the distance between bridges and internal environmental factors have on wintering of whooper swans in total 17.3 km distance between Daedong Hwamyeong Bridge at the northern end and Eulsukdo Bridge at the southern end. By section, Sec. 2 (Nakdong River Estuary Bank-Seobusan Nakdong River Bridge) was longest at 5.3 km, followed by Sec. 4 (Gamjeon-Iron Bridge-N.D.H.D.S.G Bridge) at 3.6 km, Sec. 1 at 2.2 km, and Sec. 8 at 2.1 km, while the rest were under 1.5 km. The length of N.D.H.D.S.G Bridge-Gangseo Nakdong River Bridge was short at 0.3 km, but it was selected as an independent section to compare with others since whooper swans using the water surface formed on the floodplain as feeding place were wintering there.

Start and end points of each section's bridge name and distance at the downstream Nakdong River in Busan
See Fig. 1 for bridge abbreviation.

Survey site location and section setting (abbreviation: D.D.H.M-Bridge: Daedong Hwamyeong Bridge, G.P.N.D-Bridge: Gupo Nakdong River Bridge, G.P-Bridge: Gupo Bridge, G.S.N.D-Bridge: Gangseo Nakdong River Bridge, N.D.H.D.S.G-Bridge: Nakdong River Hwaengdansugwan Bridge, G.J-Iron Birdge: Gamjeon-Iron Bridge, S.B.N.D-Bridge: Seovusan Nakdong River Bridge, N.Estuary Bank: Nakdong River Estuary Bank, E.S.D-Bridge: Eulsukdo Bridge).
Data collection and analysis method
Despite the decrease of the whooper swan population in the estuary of the Nakdong River, at least 56% still tend to prefer brackish water zones such as estuaries, coasts, and reclaimed lakes (Owen et al., 1986; Choi et al., 2018), which is why the estuary still has high value and need for protection as a wintering pond. The whooper swan population in each wintering period at the estuary and downstream of the Nakdong River seems to have a complementary relationship, with the downstream increasing when the Flatstalk bulrush tubers of mudflats are exhausted, and the population increases when there is a longer distance between bridges and decreases when there is a shorter distance (Hong, 2020). Despite these results, Busan is planning to construct a bridge between Nakdong River Estuary Bank-Seobusan Nakdong River Bridge (5.3 km) and Gamjeon-Iron Bridge-N.D.H.D.S.G Bridge (3.6 km) preferred by whooper swans.
Even though river ecosystem fragmentation is far from the research interest, bridge construction is a disturbing factor that destroys the continuity of the water surface that is a resting area and the waterfront that is a feeding area. Not only the distance between bridges but also the development and reclamation status, hydrological changes, and usage pressure in the surroundings may threaten the inhabitants (Junk et al., 2013), and land cover status by section may also affect the population of migratory birds wintering near the streams. Therefore, severance of continuity by bridges may have an adverse effect on the wintering environment, which is why it is necessary to identify how the distance between bridges and other environmental factors affect wintering individuals.
To compare the population of wintering whooper swans depending on the distance between bridges, we surveyed and analyzed the population status by period, distance between bridges, and land cover status. We examined the population of whooper swans wintering at or stopping by the downstream of the Nakdong River total 17 times, once a week from November 2020 when they begin to move south to March 2021 set as one season. Whooper swans feed during the day, and although different in size, Anser albifrons fly to the feeding ground between 7 and 9 a .m., which is why the survey began after that (Park and Won, 1993). It seems desirable to apply the line transect method, observing with the naked eye and binoculars by following the path that is set (Bibby et al., 2000). However, there may be issues such as difficulty in accessing the waterfront, breakaway due to survey activity, or population redundancy when migrating to a different section, which is why the point census method was applied to minimize disturbance. For each section, we selected the point where the entire scene can be observed and identified the population after approaching the birds along the trails for water surfaces formed within the floodplains. We drew the locations of appearances to not only compare the population according to the distance between bridges but also check at what distance from the bridge the birds rest and feed. The period for analysis may vary depending on the weather conditions, but we applied the classification by Johnsgard (1983) who stated that birds migrate from breeding areas to wintering ponds until November and from wintering ponds to breeding areas from February. In light of this, we classified the period until November as early wintering phase or migration phase, December and January as mid-wintering phase or stable phase, and after February as late wintering phase or migration phase to compare the changes.
Whooper swans prefer shallow water depths rich in emergent plants such as Typha orientalis, Phragmites australis, and Phragmites japonicus (Jia et al., 2019; Jeon and Cho, 2006). In these areas, they mostly feed at the depth of 0.5 m or less, which is a shallow depth that can submerge only up to the beak or head in terms of vigilance vulnerability and energy efficiency (Choi et al., 2010). Accordingly, the water surface formed naturally or artificially inside the floodplain was classified into a feeding place, and the water surface of mainstream into a different category considering that it may play a key role as a resting place. Moreover, since whooper swans tend to rest on the water surface and waterside (Rees et al., 1997), parks and green spaces, dry grasslands, and areas dominated by woody plants were classified as vegetation since they may not be used. Roads and facilities were classified as the same type since they area factors inhibiting habitation of wintering wild birds, such as vehicles, human use, and access to waterside. One-way ANOVA was conducted to verify whether there is statistical significance in terms of environmental factors of wintering ponds such as distance between bridges, land cover status, and difference in the wintering population. Welch's ANOVA was conducted on items that did not pass the assumption of homogeneity of variance. Post-hoc test was conducted to verify and analyze the difference between bridges using R4.0.5.
Results
Characteristics of wintering habitats by section
As for land cover characteristics by section (Table 3, Fig. 2), Sec. 5 was the biggest with 57.7% of vegetation including floodplain farmland and dry grassland, followed by Sec. 3, 4, and 6 exceeding 40%, while the rest were under that. For roads and facilities including roads, bike lanes, and parking lots, Sec. 3, 4, 7, and 8 had at least 10%, while the other sections had around 5%. For wetlands and water surfaces in the floodplains, Sec. 3 was the biggest with 10.6%, followed by Sec. 1 and 5 around 8% and Sec. 2, 6, and 7 around 5%, while the rest were under 5%. For water surface of mainstream, Sec. 1, 2, and 8 had more than 50%, Sec. 6 and 7 had more than 40%, and the rest around 30%. For land cover according to the distance between bridges, Sec. 2 with a wide distance (5.3 km) showed a high ratio of the water surface of mainstream (52.2%), whereas it showed a relatively narrow water surface of floodplain (6.2%). Sec. 4 (3.6 km) showed a narrow water surface of mainstream (39.3%) and water surface of floodplain (3.0%). Sec. 5 with a narrow distance between bridges (0.3 km) showed a wide water surface of floodplain (8.6%) but a narrow water surface of mainstream (27.12%). Sec. 1 (2.2 km) and 7 (2.1 km) had a wide water surface of mainstream and water surface of floodplain, but the other sections had either a wide water surface of mainstream or a wide water surface of floodplain.
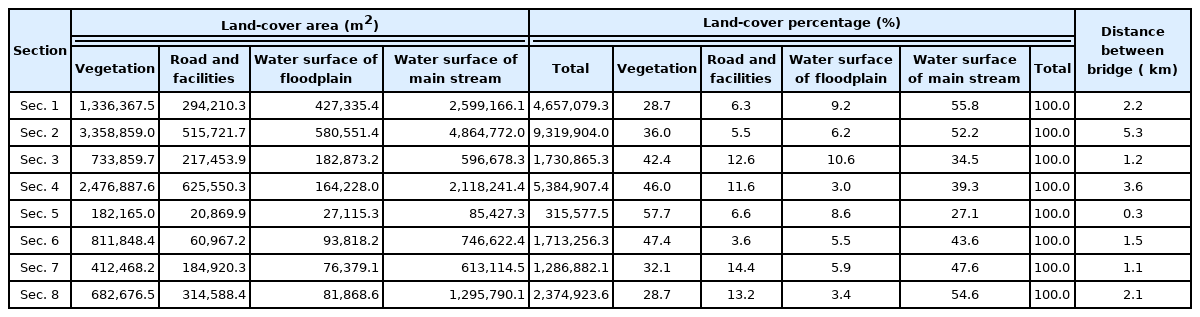
The area and ratio of land-cover type in each section at the downstream of the Nakdong River
Change in the population of whooper swans in the estuary and downstream of the Nakdong River
Total population change
The population of wintering whooper swans at the estuary and downstream of the Nakdong River can be compared as follows (Fig. 3, Wetlands and Birds Korea, 2014). After reaching its peak at 4,219 individuals in December 2011, there were 3,722 in December 2013, 3,195 in February 2016, and 3,381 in November 2020, with more than 3,000 individuals appearing, but the population tended to decrease down to below 1,500 individuals in the rest of the wintering period. There were 0 individuals in 2010 at the downstream of the Nakdong River and have since been around 100 individuals up to 2018, but the population tended to increase since 2019, exceeding 300 individuals. The population at the estuary and downstream of the Nakdong River increased at the downstream when decreased at the estuary, and decreased at the downstream when increased at the estuary (Fig. 3).

Year-to-year variation in the number of wintering whooper swan (Cygnus cygnus) populations in the estuary and downstream of the Nakdong River.
Fig. 4 compared the population of wintering whooper swans by month from 2004 to 2020 (Wetlands and Birds Korea, 2014), showing that the decline is retained except in February when whooper swans moved north. More than 3,000 individuals appeared in 2016 and 2020 for November when they migrate south to the wintering ponds, but they decreased during the rest of the period. The annual decline was reduced in December and January as well compared to November, but it tended to decrease. There was a huge gap in annual fluctuations in November and December during the early wintering period compared to January and February, but the general decline remained consistent regardless of the month. The population that was high during the early wintering phase toward the recent period tended to decrease as the birds migrate to other places in the later phase.
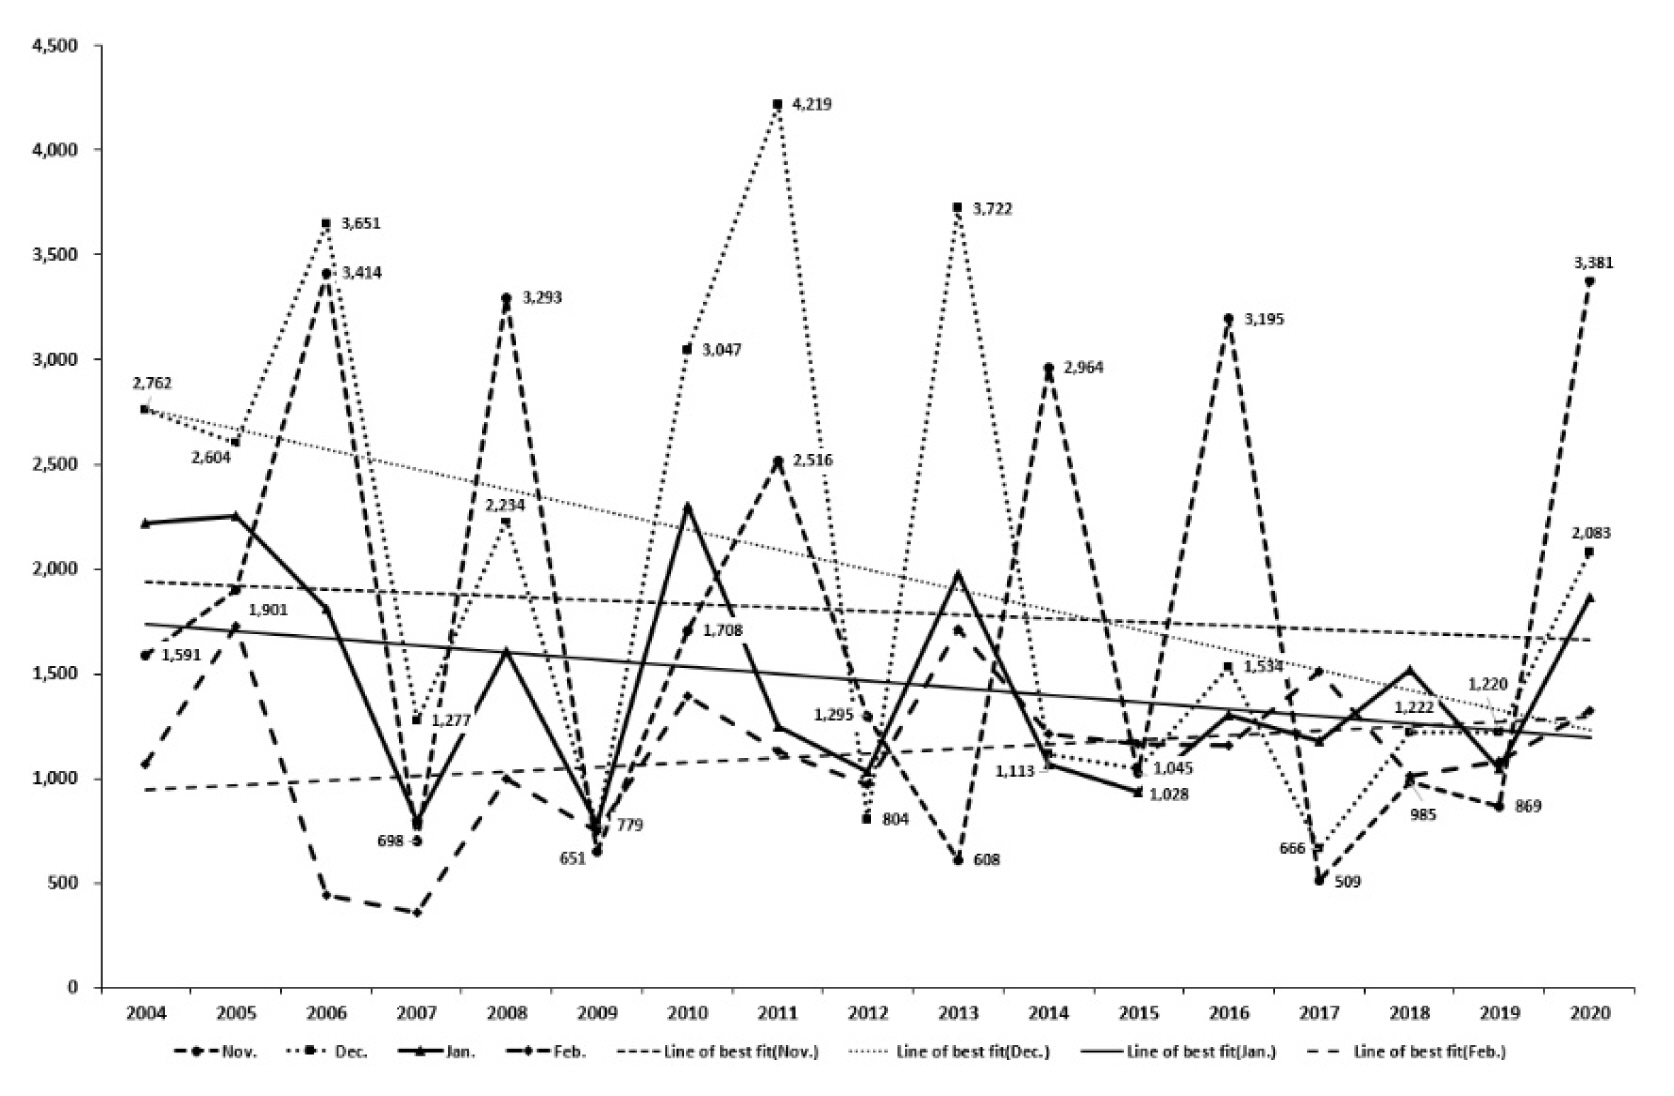
Year-to-year and monthly variation trends in the number of wintering whooper swan (Cygnus cygnus) populations in the estuary and downstream of the Nakdong River.
Population by section at the downstream of the Nakdong River
The wintering population in each section is as follows (Table 4): 222.4 (20–349) individuals in Sec. 2, 24.2 (2–104) individuals in Sec. 3, 71.1 (4–306) individuals in Sec. 4, 4.6 (1–7) individuals in Sec. 5, 8.7 (1–26) individuals in Sec. 6, 10.7 (5–14) individuals in Sec. 7, 10.3 (4–26) individuals in Sec. 8, and total 320.8 (37–588) individuals. By wintering phase, whooper swans began to appear in late November and reached the peak around 500–600 individuals in mid-December. The population rapidly decreased to around 200 individuals in January and maintained this number until early February, after which it gradually decreased from mid-February when migration began and rapidly towards the end. However, since the area cannot perform its role as a resting and feeding place when the water surface freezes depending on the weather conditions, whooper swans moved away from the downstream and then recovered the original population after the surface melted. Meanwhile, the population decrease after mid-January is not a natural decline, but rather caused by constant disturbance due to the operation of ships by Busan Metropolitan City or Korea Water Resources Corporation for garbage collection, fishing, and walking along the waterside, which is why management is necessary.

The number of whooper swan (Cygnus cygnus) populations and the ratio by wintering period according to each section, downstream of the Nakdong River
By section (Fig. 5), whooper swans were not observed in Sec. 1, and they began to appear from the early wintering phase in Sec. 2, reaching the peak in January at over 300 individuals and retaining the number above 200 individuals until February, after which it rapidly declined in March. Fewer than 5 individuals were observed in Sec. 3 in December, and the number reached its peak at about 44 individuals in January, after which it decreased to 10 individuals in February and March. However, in mid-January when most of the water surface was frozen, over 100 individuals were observed feeding inside the unfrozen natural lake of Sec. 3, but the number decreased to around 30 individuals after thawing. In Sec. 4, the population reached its peak at over 100 individuals in December and 300 individuals from late December to early January since arriving from the early wintering phase, but rapidly decreased after mid-January due to disturbance by ships. There were fewer than 7 individuals in the narrowest Sec. 5, but they seemed to have migrated to feed after landing on the water surface in the floodplain connected to Sec. 6. Sec. 6 and 8 showed many whooper swans in February and Sec.7 in January when there is insufficient food in the estuary and mainstream. 83.6–94.7% of wintering individuals at the downstream of the Nakdong River were concentrated in Sec. 2 (5.3 km, Nakdong River Estuary Bank-Seobusan Nakdong River Bridge) and Sec. 4 (3.6 km, Gamjeon-Iron bridge-N.D.H.D.S.G Bridge) from November to February, confirming that there are more individuals appearing with wider gap between bridges.
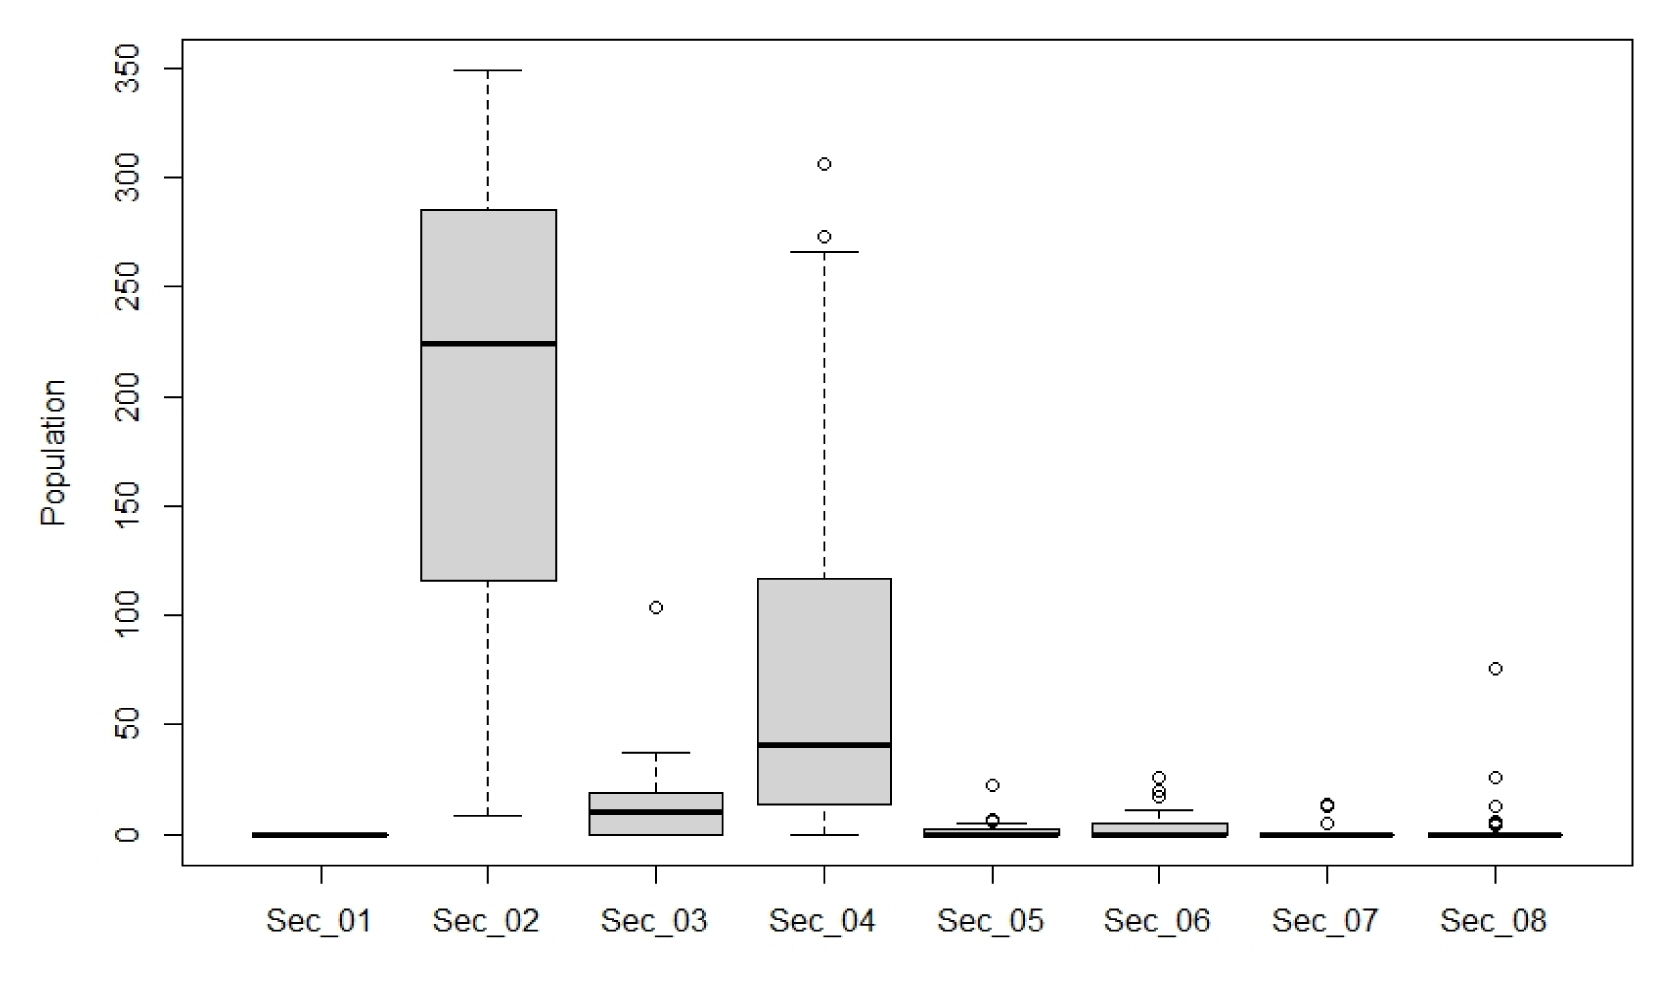
Population statistics by section (maximum, minimum, average, and outlier).
Location of appearance and distance from bridge
The distance between bridges and the resting and feeding places of whooper swans is as follows (Figs. 6, 7). In the case of Sec. 2, which is the widest, whooper swans were feeding or resting on the waterside or water surface at an average distance of 1,362.7 m (median 1,394.5 m) from the bridge. In Sec. 3, they maintained an average distance of 384.5 m (median 431.7 m). In Sec. 4, they wintered at an average distance of 1,074.5 m (median 1,031.6 m) from the bridge. In Sec. 5, they approached closest to the bridge at an average distance of 78.6 m (median 93.2 m), but the population was only 1.6% (8 individuals). In Sec. 6 and 7, whooper swans were mostly found at an average distance of 191.2–249.8 m (median 191.9–221.2 m). In Sec. 8, they were observed at an average distance of 851.2 m (median 865.9 m). They were observed feeding in the natural lake in Sec. 3, and in the wetland of floodplain in Sec. 5. In other sections, they used areas maintained as natural lake-front or rested in the floodplain or water surface of mainstream. Some individuals were using spots close to the bridge in Sec. 2 and 4 as well (Fig. 7), but this may be because there was enough space on the other side of the bridge that facilitated landing and leaving. There were various distances between the bridge and the feeding and resting places of whooper swans among sections, but when analyzed in relation to the population, about 80–90% of individuals were concentrated in Sec. 2 (5.3 km) and 4 (3.6 km) with a wide space between bridges, proving that the distance between bridges affects the population.

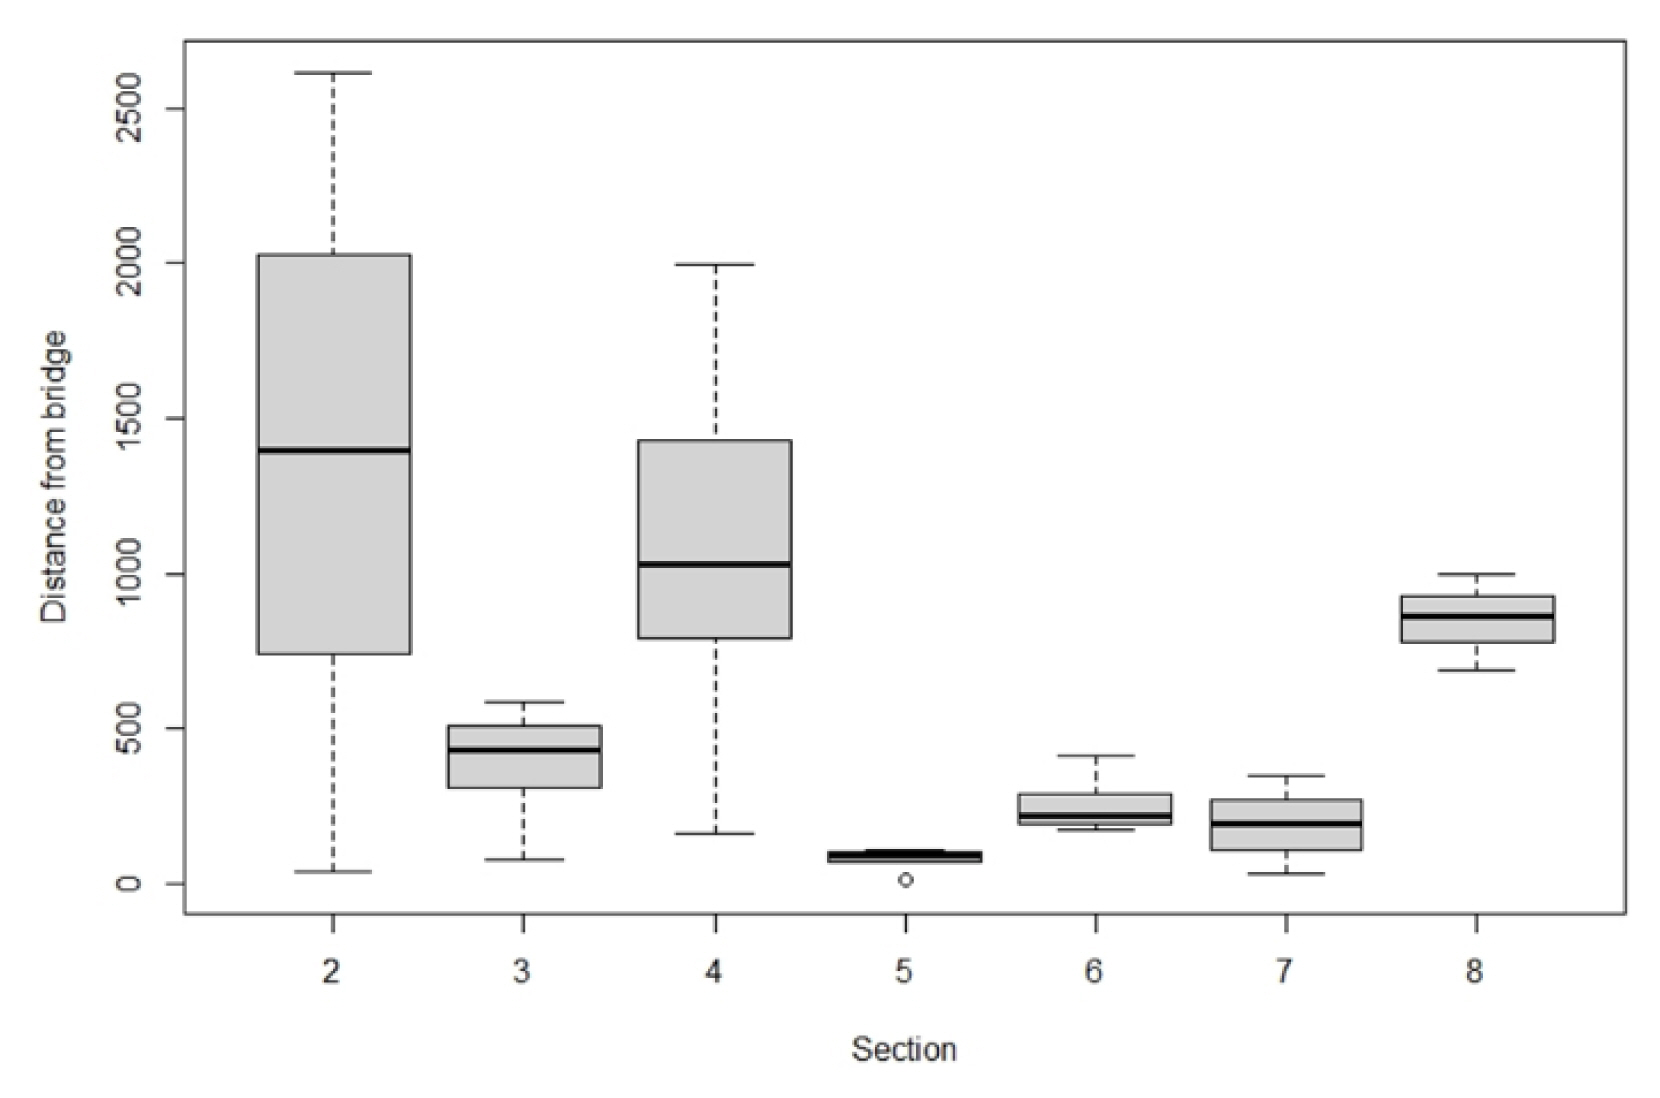
Analysis of the distance between the bridger and the point of resting and feeding of whooper swan (Cygnus cygnus), at the downstream of the Nakdong River.
Correlation and regression analysis with environmental factors
Fig. 8 shows the results of correlation analysis with environmental factors such as distance between bridges, vegetation, water surface, and facilities that are expected to affect the population of wintering whooper swans. The population showed a positive correlation (0.73) with the distance between bridges and a low but negative correlation (under −0.20) with road area and water surface area of floodplain, indicating that urban land use and water surface are hindrances to wintering. However, there was a positive correlation (0.17) with the area of the water surface of mainstream, although with little importance. The population of wintering whooper swans tended to increase along with the distance between bridges at the downstream of the Nakdong River. Although the correlation coefficient was low, the population tended to increase as the area of the water surface was wide or the water surface of roads, facilities, and floodplains was narrow, but the effect was insignificant.
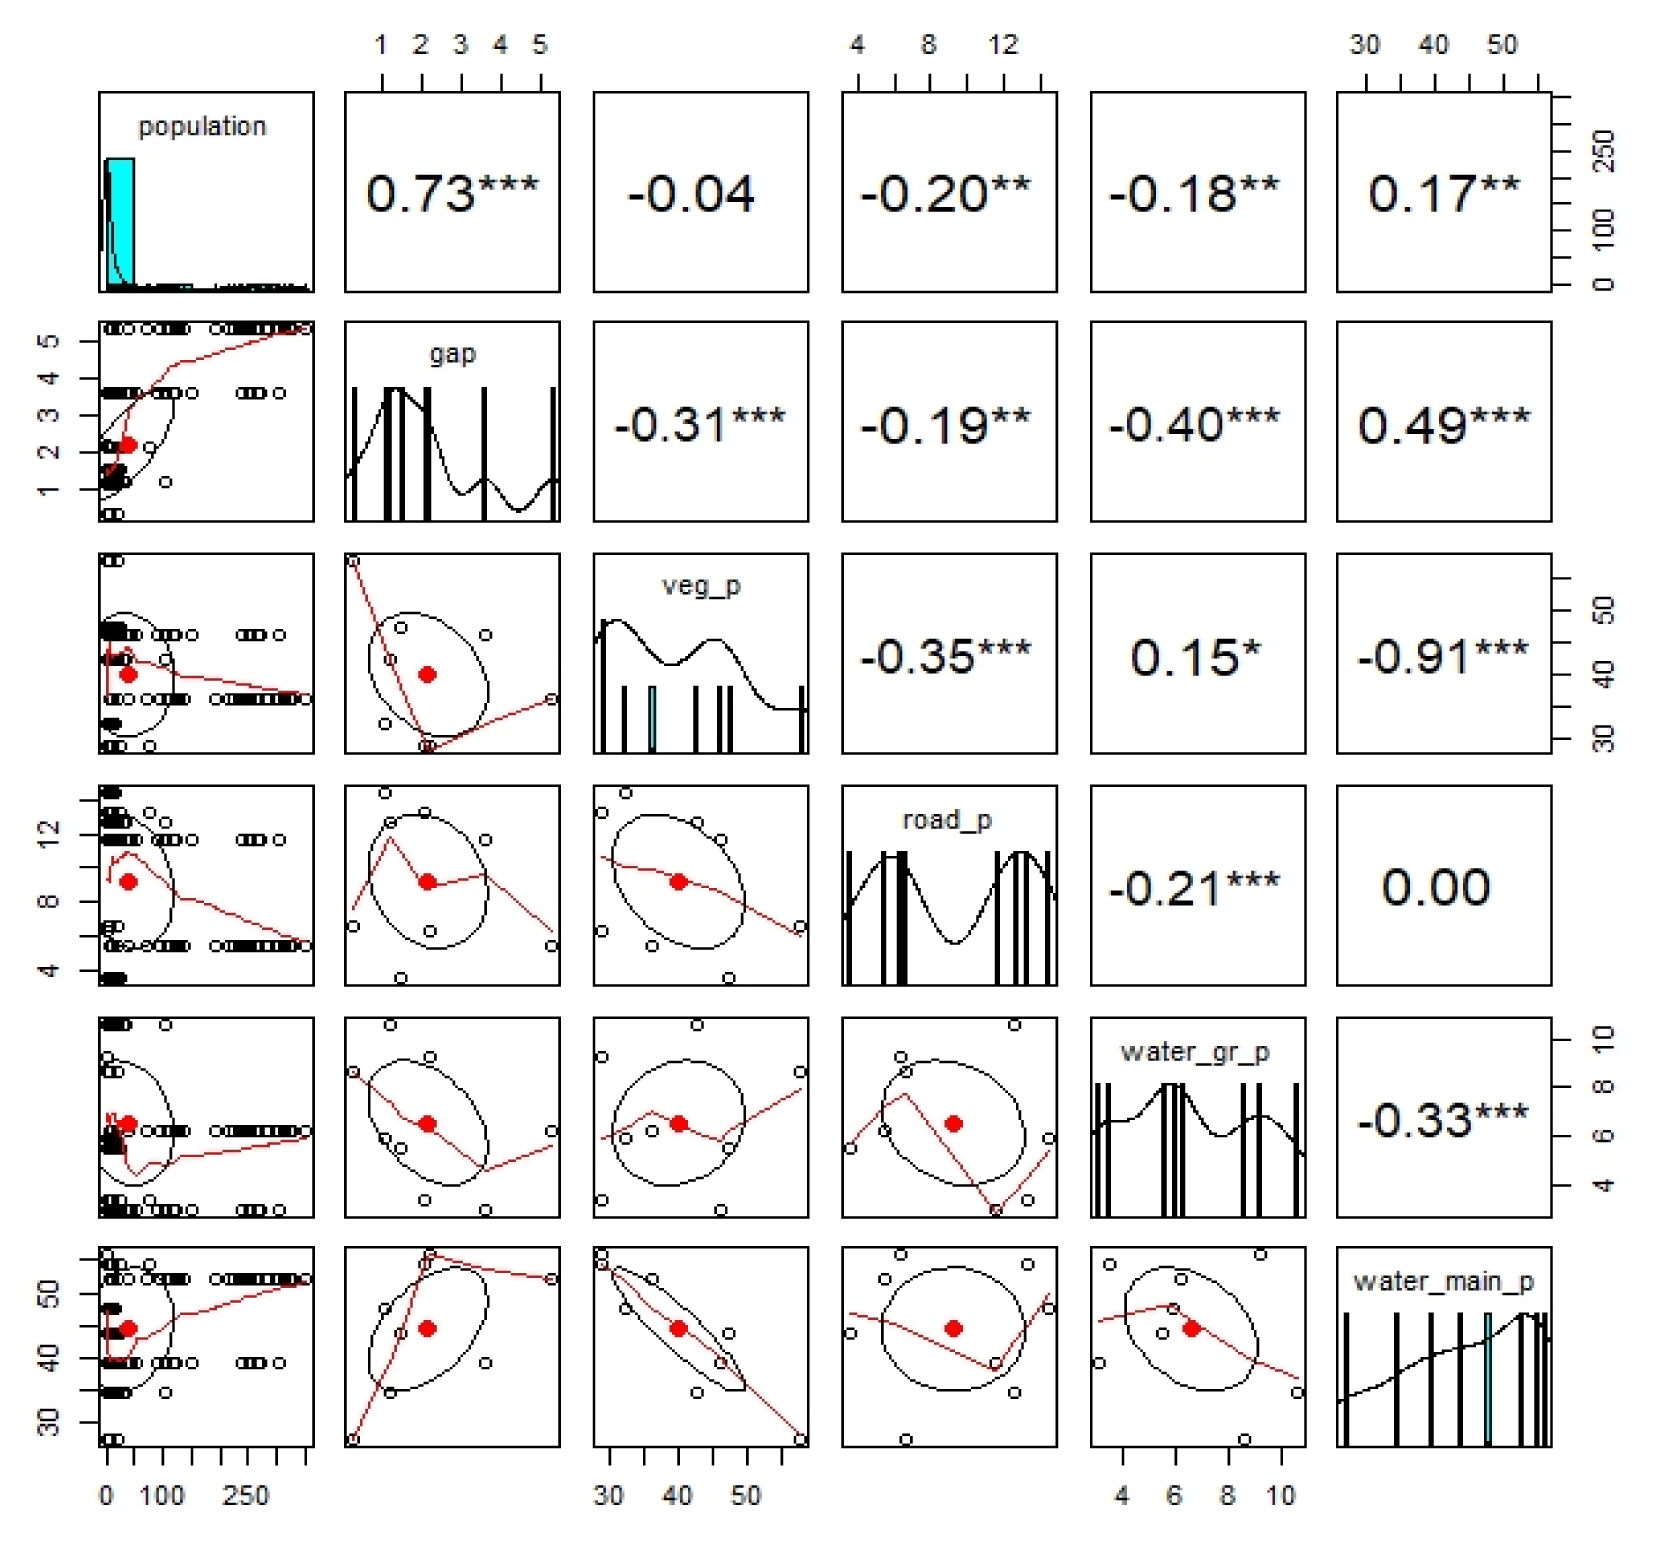
Correlation analysis between the number of wintering whooper swan (Cygnus cygnus) populations and environmental factors of their wintering habitat.
ANOVA and multicollinearity analysis were conducted to verify whether the population difference by section was significant. As a result of comparing the population between bridges (Table 5), p < 2e-16 at the 99% confidence level, rejecting the hypothesis that there is no mean difference between groups. The result of analyzing multicollinearity was p = 0.1427, not rejecting the hypothesis that there is no correlation between groups. However, as a result of testing the independence of the dependent variable (Durbinatson test), normality (Shapiro-Wilk normality test), and homogeneity of variances (Bartlett test of homogeneity of variances), p < 2.2e-16 and thus not satisfactory. Accordingly, a non-parametric test called Kruskal-Wallis Rank Test was used, and the result was p < 2.2e-16, proving that there is a population difference between bridge piers.
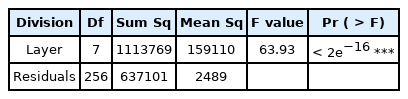
The analysis of One-way ANOVA for testing the difference in growth before and after planting
Since the hypothesis that there is no difference in the population between bridge piers can be rejected, a post-hoc test was conducted to test the difference between groups through Tukey multiple comparisons of means (Table 6). There were around 30 individuals observed in Sec. 1, Sec. 3, and Sec. 5–8, showing there was no difference with p-value 1.000 at the 95% confidence level. In Sec. 2 and 4, there was a difference from all sections with p-value 1.000 at the 95% confidence level. As a result of grouping the population and the sections between bridges through Duncan's multiple range test, it was found that Sec. 1, Sec. 3, and Sec. 5–8 were grouped as one, and Sec. 2 and 4 were grouped as different groups. As a result, regardless of other environmental factors, except for Sec. 2 and Sec. 4 where the distance between bridges is at least 3.6 km, the other sections were unsuitable as a wintering environment.
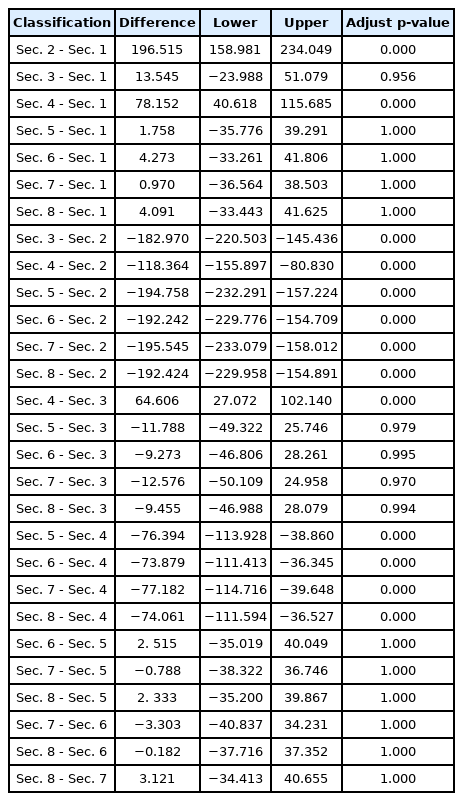
Posthoc multiple comparisons of means for the difference in growth between 2009 and 2010–2013: Fisher LSD 95% family-wise confidence level
Discussion
Whooper swan is designated as a Least Concerned (LC) species of the IUCN (Birdlife International, 2016) and as Natural Monument No. 201-2 and Class II Endangered Wildlife in Korea. Approximately 266,543 individuals are breeding and wintering in northwestern Europe and East Asia (Rees et al., 2019; Laubek et al., 2019; Won, 1981). In East Asia, 42,000–60,000 individuals breed in sub-arctic Mongolia, northern China, the Russian Far East, and inland wetlands such as taigas (Wernham et al., 2002; Rose and Scott, 1997; Miyabayashi and Mundkur, 1999; Rees et al., 2019; Jia et al., 2016; Ao et al., 2020). The Cygnus spp. population in East Asia is constantly increasing since 1970 due to the milder climate in breeding and non-breeding areas (Jia et al., 2016; BirdLife International, 2016). There is a difference in the population trend among nations by species, and in Korea, whooper swans were increasing while tundra swans were decreasing (Jia et al., 2016; Kang et al., 2008; Choi et al., 2018).
However, in the estuary of the Nakdong River, one of the key wintering grounds, the population reached its peak at 4,219 individuals in December 2011, after which there were more than 3,000 in December 2013, February 2016, and November 2020, but the population decreased to under 1,500 during the rest of the wintering period (Wetlands and Birds Korea, 2014). This is because various developments and uses, fishing, construction activities, and noises taking place in the mainstream and estuary of the Nakdong River have threatened the wintering habitat (Hahm and Kim, 2001; Choi et al., 2015; Hong, 2020). In particular, the irregular fluctuations in freshwater discharge and blockade of seawater inflow after the construction of the Nakdong River Estuary Bank not only reduced the resting environment of whooper swans but also changed the water levels and sedimentation of the estuary (Kim, 2011; 2013; Song et al., 2014), which expanded the area of Phragmites australis communities and reduced the density of Flatstalk bulrush tubers, while also affecting the population decrease (Yoon et al., 2007; Yi et al., 2011). Reduction of mudflats habitat due to estuary bank construction and development of residential and industrial complexes is also one of the causes of population decrease, which is why there is an urgent need for conservation and management (Hur et al., 1999). Recently, whooper swans tend to feed not only in natural wetlands but also farmlands, but the wintering environment will become poorer at the estuary of the Nakdong River due to the river disturbance as well as the decrease in surrounding farmlands.
Meanwhile, the downstream of the Nakdong River showed around 100 individuals until 2018 since 9 individuals were observed in 2004, and more than 300 individuals have appeared since 2019. This is mostly caused by the deterioration of the estuary environment. Since the distance between bridges constructed downstream may also restrict the wintering of whooper swans, it is necessary to limit the construction of new bridges (Hong, 2020). The population of wintering whooper swans at the estuary and downstream of the Nakdong River is in a complementary relationship, with the decrease at the estuary resulting in the increase at the downstream, and vice versa.
In rivers, bridges connect logistics and transportation while causing fragmentation to biological habitats. There are total 10 bridges at the downstream of the Nakdong River in Busan Metropolitan City, resulting in fragmentation. Aside from these bridges, Busan is planning to newly construct bridges to deal with increased logistics flow and traffic volume, such as Daejeo Bridge and Eomgung Bridge between Nakdong River Estuary Bank-Seobusan Nakdong River Bridge (Sec. 2, 5.3 km) and Gamjeon-Iron Bridge-.D.H.D.S.G Bridge (Sec. 4, 3.6 km). In general, reduction of intact habitats due to roads and developments may result in biodiversity loss and potential nutrient degradation (Terborgh et al., 2001) as well as loss of ecosystem services related to the quality of life (Dobson et al., 2006; Layman et al., 2007). New bridge construction is a key factor that causes fragmentation of continuous river habitats, which may change the wintering environment, and thus it is necessary to predict and evaluate the impact in advance. Accordingly, this study verified the impact that the distance between bridges has on the population of wintering whooper swans by dividing the bridges constructed between Eulsukdo Bridge and Daedong Hwamyeong Bridge into total 8 sections (17.3 km, distance between bridges: 0.3–5.3 km).
Meanwhile, factors that may have effect other than the distance between bridges were the arrangement of the floodplain, artificial disturbance factors, and differences in land cover types. Regarding the arrangement of the floodplain, one of the left and right banks had a wide floodplain, and the other side was bordering on the embankment or had a narrow width. As for the artificial disturbance factors, there were no high-rise buildings inland that could affect the takeoff, landing, or flight of whooper swans. However, the disturbance intensity was similar because the operation of ships, fishing, or walking that could disturb wintering on the water surface and waterside was found throughout all sections. By land cover type in each section, Sec. 2 with a wide distance showed a high ratio of the water surface of mainstream (52.2%), but a relatively narrow water surface of floodplain (6.2%). Sec. 4 showed a narrow water surface of mainstream (39 .3%) and water surface of floodplain (3.0%). Sec. 5 with a narrow distance between bridge piers showed a narrow water surface of mainstream (27.1%) but a relatively wide water surface of floodplain (8.6%). Factors that may have effect aside from the distance between bridges and the ratio of area by land cover type in each section did not show a pattern depending on the distance between bridges.
The wintering population in each section is as follows: 222.4 (20–349) individuals in Sec. 2, 24.2 (2–104) individuals in Sec. 3, 71.1 (4–306) individuals in Sec. 4, 4.6 (1–7) individuals in Sec. 5, 8.7 (1–26) individuals in Sec. 6, 10.7 (5–14) individuals in Sec. 7, and 10.3 (4–26) individuals in Sec. 8. By wintering individuals in each section of the downstream of the Nakdong River, 83.6–94.7% of individuals were found from November to February except when 68% of individuals were found in March during the migration phase in Sec. 2 (Nakdong River Estuary Bankeobusan Nakdong River Bridge, 5.3 km) and Sec. 4 (Gamjeonron Bridge-N.D.H.D.S.G Bridge, 3.6 km), showing that more individuals appeared when there is a wider distance between bridges. This may be because the wider the distance between bridges in the downstream of the Nakdong River where the width is consistent, the fewer obstacles there are caused by bridges, lights, and vehicles. This is similar to the results by Jeon and Cho (2006) suggesting that whooper swans prefer reeds and wetlands that can serve as hiding places on the waterside as well as water surface that can be recognized from the air and a space with few obstacles. In addition, population differences by section are related to habitat loss (Rushing et al., 2016), land use level (Gill et al., 2007), and artificial changes (Both et al., 2006). Since species that are sensitive to environmental changes such as rare and endangered species are vulnerable to habitat isolation (Luther et al., 2020), they tended to prefer wide areas where the ecosystem was relatively intact.
As for the distance between the feeding and resting places of whooper swans and the bridges, whooper swans used the waterside and wetlands at a distance of 1,147.5 (10.9–2,611.2) m in all sections, 334.1 (10.9–995.3) m under 2 km, and 1,265.2 (36.3–2,611.2) m over 2 km. Whooper swans, one of the heaviest species of wild birds, need an undisturbed open space to avoid disturbance or move to feeding and resting places. According to Cramp et al. (1977), whooper swans fly high for long migrations and low or medium heights for short migrations in wintering grounds. In particular, when migrating over the water surface, they fly at an average height of 31±3 m, but the median and mode were less than 10 m (Griffin et al., 2011), implying that installing obstacles such as wind power generators or bridges in the path may serve as threats (Wilcove and Wikelski, 2008; Bright et al., 2006; Griffin et al., 2010). According to Pennycuick et al. (1996, 2013) who studied migration to overcome heights, female whooper swans (8.9 kg) migrate at the speed of 16.2–27.7 m ⋅ s−1 and height of 0.33 m ⋅ s−1 without disturbance. The total height of the bridges, streetlights, and pylons installed downstream of the Nakdong River was more than 20 m, excluding the N.D.H.D.S.G Bridge and Busan-Gimhae Light Rail Transit, which required a distance of 736.3–1,678.8 m to overcome. However, since not only the height of the bridge but also the noises, speed, and visual disturbance generated by large trucks using the bridge have a negative effect on migration (Choi et al., 2015), a wider distance will be required considering these disturbance factors and young individuals in calculating the departure distance. In addition, Hong (2020) stated that the distance between bridges must be at least 4 km to ensure a safe boundary and gliding distance. The fact that about 80–90% of individuals were concentrated in the section above 3.6 km indicates that the distance between bridges is closely related to the maintenance of the wintering population.
As a result of the studies by Pennycuick et al. (1996) and Hong (2020), it is necessary to maintain at least a 4 km distance between bridges for the stable habitat of wildlife in the river ecosystem, considering disturbance factors such as size, noises, and speed of vehicles crossing the bridge, along with the concentration of population at over 3.6 km of distance, weight of males, and young individuals included in the wintering period. Rare and endangered species such as whooper swans are vulnerable to not only habitat isolation but also energy loss in frequent short-distance migrations due to disturbance (Powell and Engelhardt, 2000; Luther et al., 2020). Thus, it is necessary to minimize disturbances caused by ships, fishing, and strollers during the wintering season and to secure wide spaces.
Betts et al. (2017), Haddad et al. (2015), Hansen et al. (2013), Kuipers et al. (2021), and Luther et al. (2020) have revealed that fragmentation on land may have adverse effects on biodiversity protection. This study proved that river ecosystem fragmentation also has adverse effects on wildlife survival. Habitat reduction and fragmentation may lead to biodiversity loss and potential trophic degradation (Terborgh et al., 2001), as well as loss of ecosystem services connected to the quality of human life (Dobson et al., 2006; Layman et al., 2007). Accordingly, Luther et al. (2020) emphasized the importance of keeping the ecosystem intact by preventing fragmentation in order to prevent extinction of rare and endangered species that are vulnerable to habitat isolation.
Meanwhile, since coastal habitat reduction including estuaries threatens long-term prospects of long-distance migratory species (Wood et al., 2018; Piersma et al., 2016), it is important to protect wetlands used as stopover sites or wintering ponds. Moreover, the fact that only whooper swans do not winter under 2.2 km or only 6.3–16.4% of the entire whooper swan population appear downstream proves that fragmentation of the river ecosystem may have adverse effects on biodiversity. The estuary of the Nakdong River serves as a wintering and stopover site for wild birds linked to Japan and as far away as Australia, New Zealand, and Russia. Therefore, it is important to maintain the current state even if the protected area cannot be expanded, because damage to these areas can lead to the extinction of migratory waterbirds using Korea in the long run. Since localized extinction may be accompanied by the global population decrease, there is a need for long-term monitoring studies on how the decrease in the whooper swan population will affect the estuary and downstream of the Nakdong River. However, since this study did not determine the flight distance based on direct research on the flight paths of whooper swans, additional research must be conducted on flight height and distance required to depart from the existing bridges.