Urban Heritage and its Socioeconomic Impacts in Seoul, South Korea: An Empirical Study Using Residential Environmental Satisfaction and Housing Price as Indicators
Article information

Abstract
Background and objective
Recent research has highlighted the need for urban heritage conservation due to rapid urbanisation, especially in Asian cities; however, few studies have investigated the socioeconomic impacts of heritage assets in urban contexts. This study examined urban heritage sites in Seoul Metropolitan City from the perspective of residents’ environmental satisfaction and housing prices.
Methods
A spatial regression model was developed to examine the associations between urban heritage sites and their corresponding protected areas as the independent variables (nationally assigned cultural heritage, city-assigned cultural heritage, nationally registered cultural heritage, nationally assigned cultural heritage protected area, and city-assigned cultural heritage protected area) and residential environmental satisfaction and housing prices as the dependent variables. The model investigated how urban heritage sites influence housing prices through the mediating effect of residential environmental satisfaction.
Results
The results confirmed the impact of urban heritage sites on housing prices and the mediating effect of residential environmental satisfaction. Moreover, depending on their urban heritage classifications, noticeable differences were evident in the impact of urban heritage sites.
Conclusion
These findings provide an intellectual foundation for public policies, offering insights into how they might achieve an optimum balance between private and public interests in matters of heritage conservation.
Introduction
More than two-thirds of the world’s population now lives in urban areas (UNESCO, 2019, 2020). Urban heritage sites are under considerable pressure due to rapid urbanisation and development. Growing literature demonstrates that urban heritage sites in Asian cities are particularly vulnerable to rapid urbanisation because public policies tend to favour building infrastructure rather than preservation projects (Kiruthiga and Thirumaran, 2019; Logan, 2020; Pai, 2013; Tan and Ti, 2020). Urban heritage is often targeted for transformation during rapid transitions to urbanisation (Kiruthiga and Thirumaran, 2019). Similarly, uncontrolled development dramatically impacts urban areas, leading to the fragmentation and deterioration of heritage sites and seriously impacting their value (UNESCO, 2019).
Considering this intense pace of demolition and redevelopment (Tan and Ti, 2020), urban heritage sites need special attention to maintain the identity of cities and preserve their history (UNESCO, 2020). Urban heritage conservation has emerged as an essential part of government regional policy worldwide, recognising the economic, social, and cultural contributions of urban heritage to society (UNESCO, 2019). Several studies have investigated the role of heritage assets in urban contexts, especially their socioeconomic benefits to residents that are highly contextual and often dependent on local planning acts and residents’ preferences (Franco and Macdonald, 2018; Rudokas et al., 2019; Sagger et al., 2021). This means urban heritage sites have varied impacts on their local areas (Franco and Macdonald, 2018). Consequently, scholars have begun to take multi-level approaches to measure their multi-dimensional benefits (DCMS, 2021; Sagger et al., 2021).
However, the relationship between the social and economic impacts of urban heritage sites in their geographical and legal contexts remains unclear (DCMS, 2021; Reilly et al., 2018; Rudokas et al., 2019; UNESCO, 2020). Furthermore, because South Korea has experienced rapid urbanisation since the 1980s, resulting in more than half its population residing in Seoul and the surrounding urban areas (Kim, 2020), this study explored the socioeconomic benefits of heritage sites to evaluate the impact of urban heritage assets on city development using Seoul as a case study. This study categorises urban heritage sites and their corresponding conservation areas in line with the South Korean Cultural Heritage Protection Act (2018) to measure the influence of different urban heritage types and corresponding protected areas in Seoul.
Urban heritage sites tend to interact with neighbouring amenities, yielding socioeconomic benefits for residents and stronger adjacency effects within neighbourhoods (Franco and Macdonald, 2018). This includes a significant positive effect on residents’ environmental satisfaction, which influences residential housing prices (Rudokas et al., 2019; Sung and Ki, 2021a, 2021b). This study focused on housing prices and residents’ environmental satisfaction as indicators of the socioeconomic benefits of urban heritage sites and examined how these interrelationships play out locally by considering the geographical and local legal contexts of heritage sites. To ensure holistic assessment of the spatial impacts of urban heritage sites, spatial regression models were developed to conduct in-depth analyses.
Using Baron and Kenny’s (1986) method to explore the relationship between social and economic benefits of urban heritage sites, this study investigated how they influence housing prices and residents’ environmental satisfaction; it also evaluated the impact of urban heritage on city development to present policy recommendations. It aimed to reduce the current research gap in the valuation of urban heritage and the application of valuation methods in the policy arena (Riganti and Throsby, 2021). To do so, it addressed the paucity of mechanisms for measuring the socioeconomic benefits of urban heritage and defined residential environmental satisfaction according to three types: housing, social, and educational.
Research Methods
Study framework
Previous research emphasises that effective planning and management of urban heritage can support and enhance economic development. Urban heritage supports local tourism and grants unique identities to local areas, both of which promote higher housing prices (Franco and Macdonald, 2018; Greffe, 2004; Maeer et al., 2016; Mason, 2008; UNESCO, 2013, 2019). Managing heritage resources appropriately drives business within historically conserved spaces (Shipley and Snyder, 2013).
Urban heritage provides a unique local identity to areas, improving international visibility to residents, tourists, and investors (Murzyn-Kupisz, 2013) as well as influencing housing prices (Franco and Macdonald, 2018; Greffe, 2004; Mellen, 2021; Shipley and Snyder, 2013). Therefore, housing prices are considered an important indicator of the economic benefits of urban heritage. However, steep housing prices and concomitant costs may cause local businesses and residents to relocate (Mellen, 2021; Silva, 2014). Heritage tourism can also gentrify an area or only benefit the affluent (Silva, 2014); employing housing prices as an indicator of urban heritage’s economic impact fails to consider these issues. Thus, Throsby (2019) argues that the field of heritage conservation needs to explore the considerable array of social benefits of urban heritage sites to consider their holistic impacts.
Existing literature focuses on increasing public awareness of urban heritage by developing a greater understanding of its social benefits (ICOMOS, 1994; Ruiz and Hernández, 2007), including ways in which urban heritage can foster social cohesion by linking people to their roots, creating desirable environments, and improving quality of life and well-being (ICOMOS, 2010; Logan, 2020; Veldpaus and Pendlebury, 2019). Urban heritage also offers tangible evidence of past-present continuity (ICOMOS, 2010; Logan, 2020; Smith, 2006), facilitates group identity (Blake, 2000), and enhances community-based social interactions and cohesion (Feilden and Jokilehto, 1998), an essential contribution to current society’s fragmented families and communities (Perkin, 2010; UNESCO, 2013; Edinburgh World Heritage, 2021).
Urban heritage generates considerable social welfare, and buildings’ historical characteristics account for nearly 15% of property values (Ruijgrok, 2006). Visiting heritage sites also significantly and positively affects life satisfaction (Fujiwara et al., 2014; Maeer et al., 2016), health, and well-being (Reilly et al., 2018). Reported life satisfaction in an area also influences housing prices, and access to culture and heritage improves well-being, at both individual and community levels (DCMS, 2021; Rudokas et al., 2019; Sagger et al., 2021). However, urban heritage may also cause envy and competition (Silva, 2014), or support aggressive assertions of specific groups’ national or ethnic identities (Blake, 2000; Light, 2000). Urban heritage that fosters division and dissonance can negatively influence residents’ perceptions of an area (Blake, 2000; Light, 2000; Silva, 2014).
Consequently, many organisations have tried to develop value-centred methods to measure urban heritage’s socioeconomic impacts (DSMS, 2021; Edinburgh World Heritage, 2021). Value-centred theory is a broad and integrated way to measure the role of urban heritage in contemporary society (Mason, 2008). Seeing heritage sites through an economic lens can provide significant insight into their value (Wright and Eppink, 2016) and inform heritage conservation policy (Mason, 2008; Throsby, 2006). Existing studies rely on the strength of housing markets that value urban heritage using hedonic pricing methods (Sagger et al., 2021; Tan and Ti, 2020).
Although quantifiable economic estimations help capture heritage sites’ value and facilitate assessment of their preservation needs, many studies also acknowledge their value outside of market processes and the existence of externalities, such as social benefits, which complicate quantification (Maeer, 2014; Mason, 2008). Urban heritage’s numerous multidimensional benefits have traditionally been under-emphasised (Mason, 2008). One of the best ways to measure urban heritage’s benefits is to separate cultural value into its constituent elements: aesthetic, spiritual, social, historical, symbolic, authentic (Throsby, 2006), archaeological, architectural, commemorative, functional, landscape, monumental, scientific, technological, and traditional (ICOMOS, 2010).
Currently, no consensus exists on how to measure heritage sites’ contribution to society. Accenture (2006) suggests public value concepts of heritage as a starting-point for quantifying their socioeconomic benefits, rooted in value created by governments through services, laws, regulations, and other resources provided to citizens across diverse areas such as housing, education, and social care (Kelly et al., 2009). To apply public value theory to the cultural sphere, the Heritage Lottery Fund refined the public value concept to address cultural issues. Specifically, it created a framework called cultural value based on two distinct value sets: intrinsic values people attach to heritage sites, and instrumental social and economic benefits flowing from people’s involvement and engagement with heritage sites (Clark and Maeer, 2008; Maeer, 2014) (Table 1).

Research framework: Cultural value
This framework elucidates public preferences and offers guidance to heritage site managers regarding utilisation of resources, improving heritage assets, and offering public services (Maeer, 2014); however, this can be realised only if public resources are allocated to strengthen heritage sites in line with local communities’ needs (Mydland and Grahn, 2012; Veldpaus and Pendlebury, 2019). Measuring socioeconomic benefits of heritage sites is crucial for capturing their value and distributing public resources for optimum public benefit.
Within this framework, the economic and cultural values of heritage sites are inextricably intertwined. Tourism development, for instance, promotes cultural values and awareness of heritage sites, while also converting them into economic value (Mason, 2008). The social benefits of heritage sites, such as improvements to health, social well-being, and education, can foster their economic benefits, such as increased housing prices. However, to understand how these interrelationships play out locally, the methodology must be expanded to consider the geographical settings and legal contexts of heritage sites (ICOMOS, 1994; Reilly et al., 2018; Rudokas et al., 2019; UNESCO, 2013, 2020) because the impacts of urban heritage sites are highly contextual (ICOMOS, 1994; Rudokas et al., 2019; UNESCO, 2013, 2020).
To examine the multidimensional nature of urban heritage, a people-centred approach was adopted to determine the socioeconomic benefits of urban heritage, because cities function according to residents’ preferences and needs (UNESCO, 2020). Both residential environmental satisfaction and housing prices were used as indicators of socioeconomic benefits, and two previous research findings were considered: how socioeconomic benefits attributed to urban heritage differ with place (Rypkema, 2012) and how the practice of urban heritage conservation differs markedly between European and Asian regions (Winter, 2013). The social and economic contexts of Seoul were obtained using geographical settings and local legal contexts. A novel, comprehensive methodology was then developed to assess the socioeconomic benefits of urban heritage through the framework of cultural value (Table 1), and to identify the synergetic effects of urban heritage.
Residential environmental satisfaction denotes residents’ degree of approval of housing and neighbourhood conditions (Terzano, 2014), incorporates residents’ socioeconomic conditions and views on the built environment (Mesch and Manor, 1998), and is an essential factor in identifying personal perception trends regarding housing (Park and Seo, 2020) and discovering qualities that make neighbourhoods more desirable (Pishgahi and Partovi, 2021).
Urban heritage has a significant positive effect on residents’ environmental satisfaction, which influences housing prices (Rudokas et al., 2019; Sung and Ki, 2021a) through a mediating effect (Kabisch et al., 2021; Park and Seo, 2020). Visiting historic sites can improve health and well-being, which also influences housing prices (Rudokas et al., 2019). Thus, Baron and Kenny’s (1986) method, which emphasises the importance of mediators to explore the relationships between social phenomena, such as heritage, was utilised (Rudokas et al., 2019).
Research site
Public authorities’ role in urban heritage and city management should be highlighted because urban areas often face stricter control of the built environment, based on urban heritage preservation needs (UNESCO, 2013). Comprehensive district management that addresses urban heritage benefits can promote the importance of urban heritage and lead to economic development at the district level (Shipley and Snyder, 2013). Locally prepared urban development plans are needed to consider the value of urban heritage and its associated features (UNESCO, 2019). Thus, this study considered both central government and Seoul Metropolitan City Government urban heritage policies in relation to the South Korean Cultural Heritage Protection Act (2018).
Although an urban heritage listing is meant to recognise and protect a site in accordance with its importance (Elsorady, 2014), the type of heritage listing also influences other amenities, conservation efforts, and the protection status of buildings in surrounding areas (Franco and Macdonald, 2018; Rudokas et al., 2019; Throsby, 2019). Listed status also constrains what owners can do with their properties (Throsby, 2019), which may negatively influence district-level housing prices (Franco and Macdonald, 2018; Sung and Ki, 2021a, 2021b). Thus, this study differentiated between urban heritage and conservation areas to further analyse the socioeconomic effects of urban heritage on their conservation areas at a district level.
Urban heritage sites in Seoul can be categorised by significance: nationally assigned cultural heritage, city/province assigned cultural heritage, and nationally registered cultural heritage (Table 2). Their listed status determines whether they require conservation efforts to protect their historical, academic, artistic, and/or scenic value under the South Korean Cultural Heritage Protection Act (2018). Accordingly, nationally assigned cultural heritage and city/province-assigned cultural heritage sites are required to have their own protected areas (South Korean Cultural Heritage Protection Act, 2018).

Definitions of independent and dependent variables
This study covered five types of urban heritage sites in Seoul: 149 nationally assigned cultural heritage sites, 148 city-assigned cultural heritage sites, 148 nationally registered cultural heritage sites, 38 nationally assigned cultural heritage protected areas, and 118 city-assigned cultural heritage protected areas (illustrated in Fig. 1). The spatial data on these sites were obtained from the Korea Cultural Heritage GIS Service database (Cultural Heritage Administration, 2021). Using primary data gathered from urban heritage areas, indices of residential environmental satisfaction, and housing prices, this study aims to address the current lack of empirical studies on the socioeconomic impacts of urban heritage in Seoul.
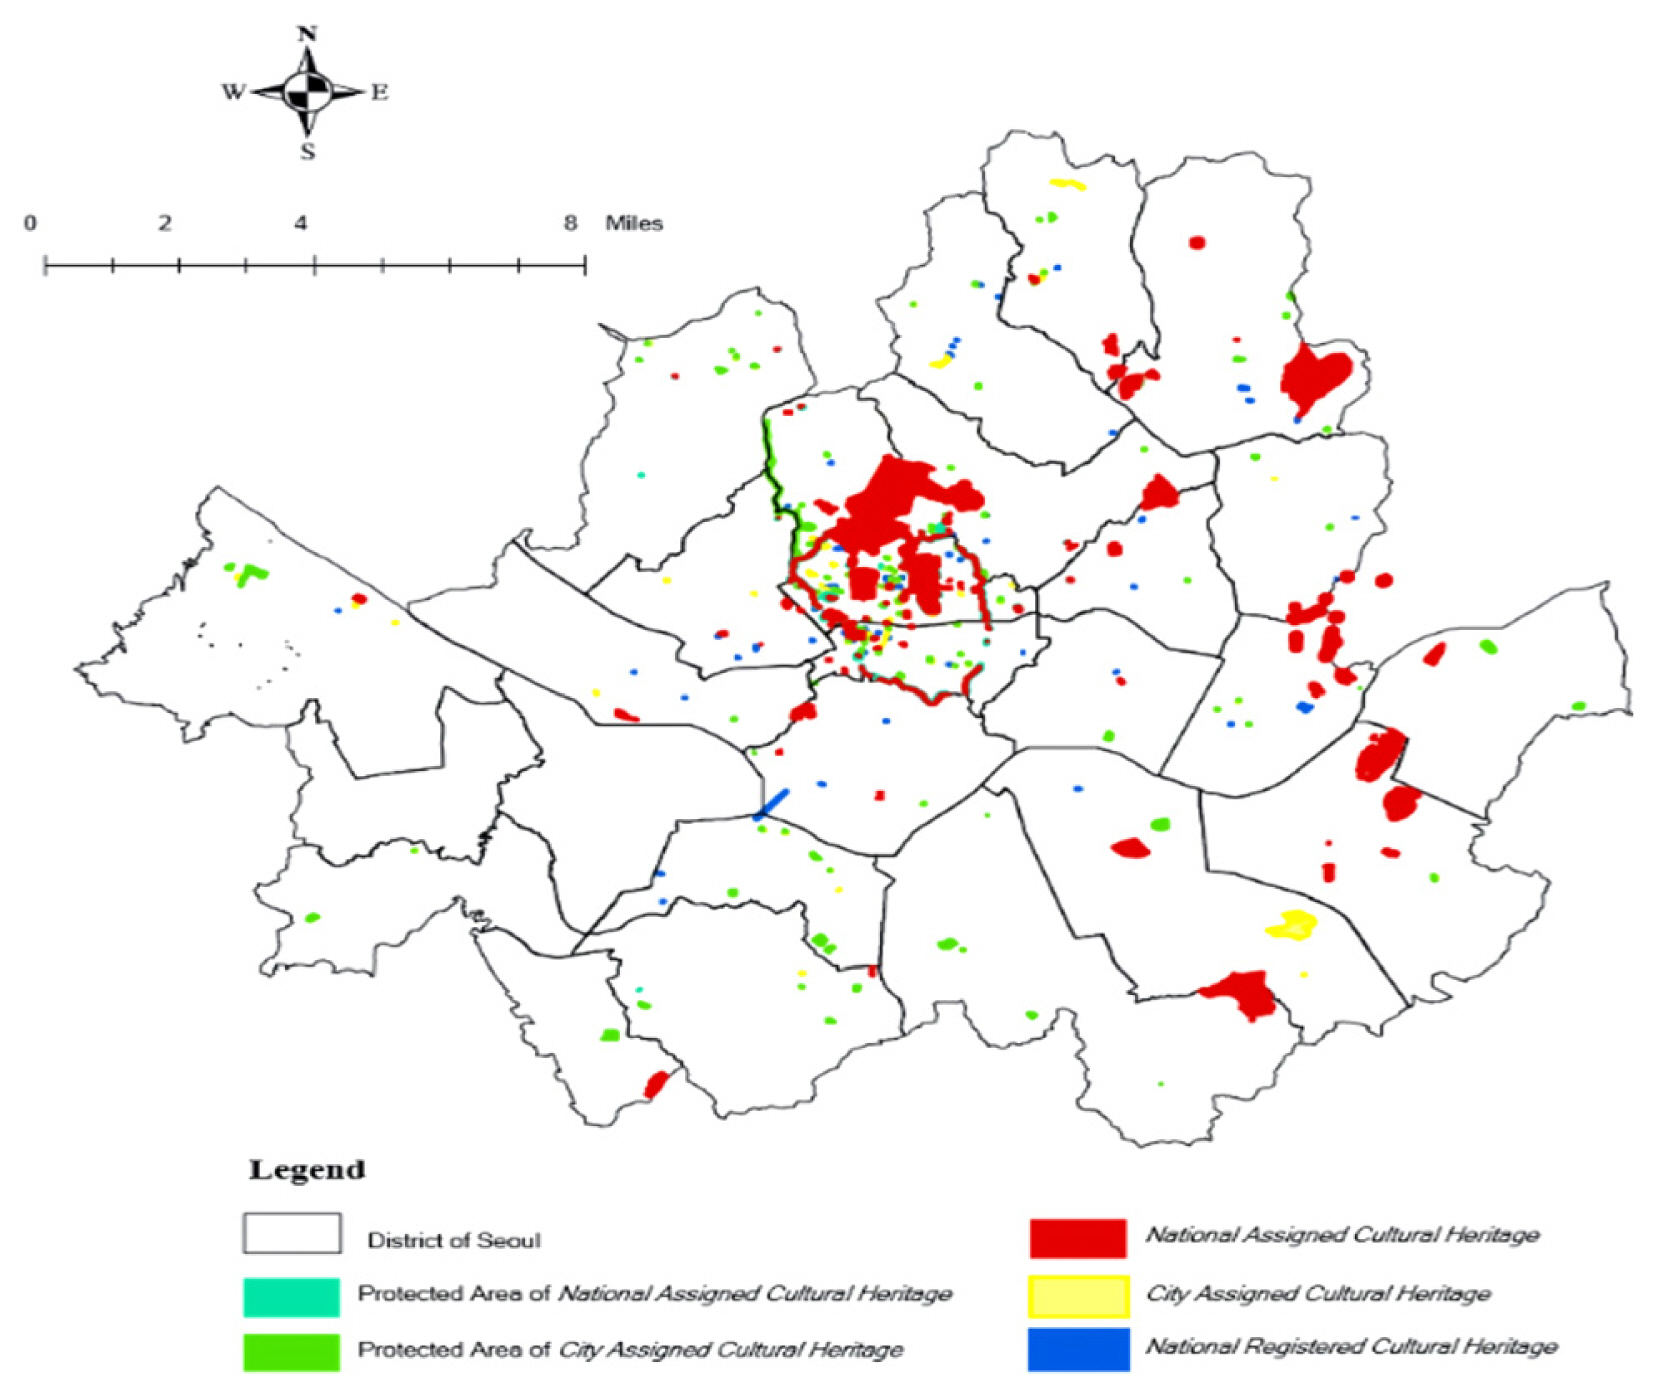
A spatial distribution of urban heritage sites in Seoul (Cultural Heritage Administration, 2021).
Rationale for adopting spatial regression models
Urban heritage should not be treated in geographical isolation (UNESCO, 2013; Veldpaus et al., 2013) because it may have socioeconomic benefits for residents in its neighbourhood, leading to stronger adjacency effects (Franco and Macdonald, 2018). This study employed spatial regression models to consider the spatial dependencies that urban heritage in Seoul might generate.
Most urban heritage sites in Seoul are primarily managed and utilised as resources for heritage tourism and urban regeneration by each autonomous district of Seoul, called Gu (Seoul Metropolitan City Government, 2021). Because of the planning controls and cultural policies implemented by each administrative district, groups of urban heritage sites located in the same district often have similar external effects on residential environmental satisfaction and neighbouring housing prices, which can increase the chances of spatial dependencies. Sung and Ki (2021a) provided evidence of this, demonstrating that the influence of urban heritage is not statistically significant at a sub-district level.
This study examined Moran’s I test results to assess spatial autocorrelation arising from spatial dependencies at global and local levels (Fig. 2). Global Moran’s I indicates a variable clustering tendency in the overall research area, while the local measure reveals a tendency within specific areas (Kim, 2018). The Moran’s I test explicitly demonstrated a relatively high spatial dependency among all dependent variables (Fig. 2).
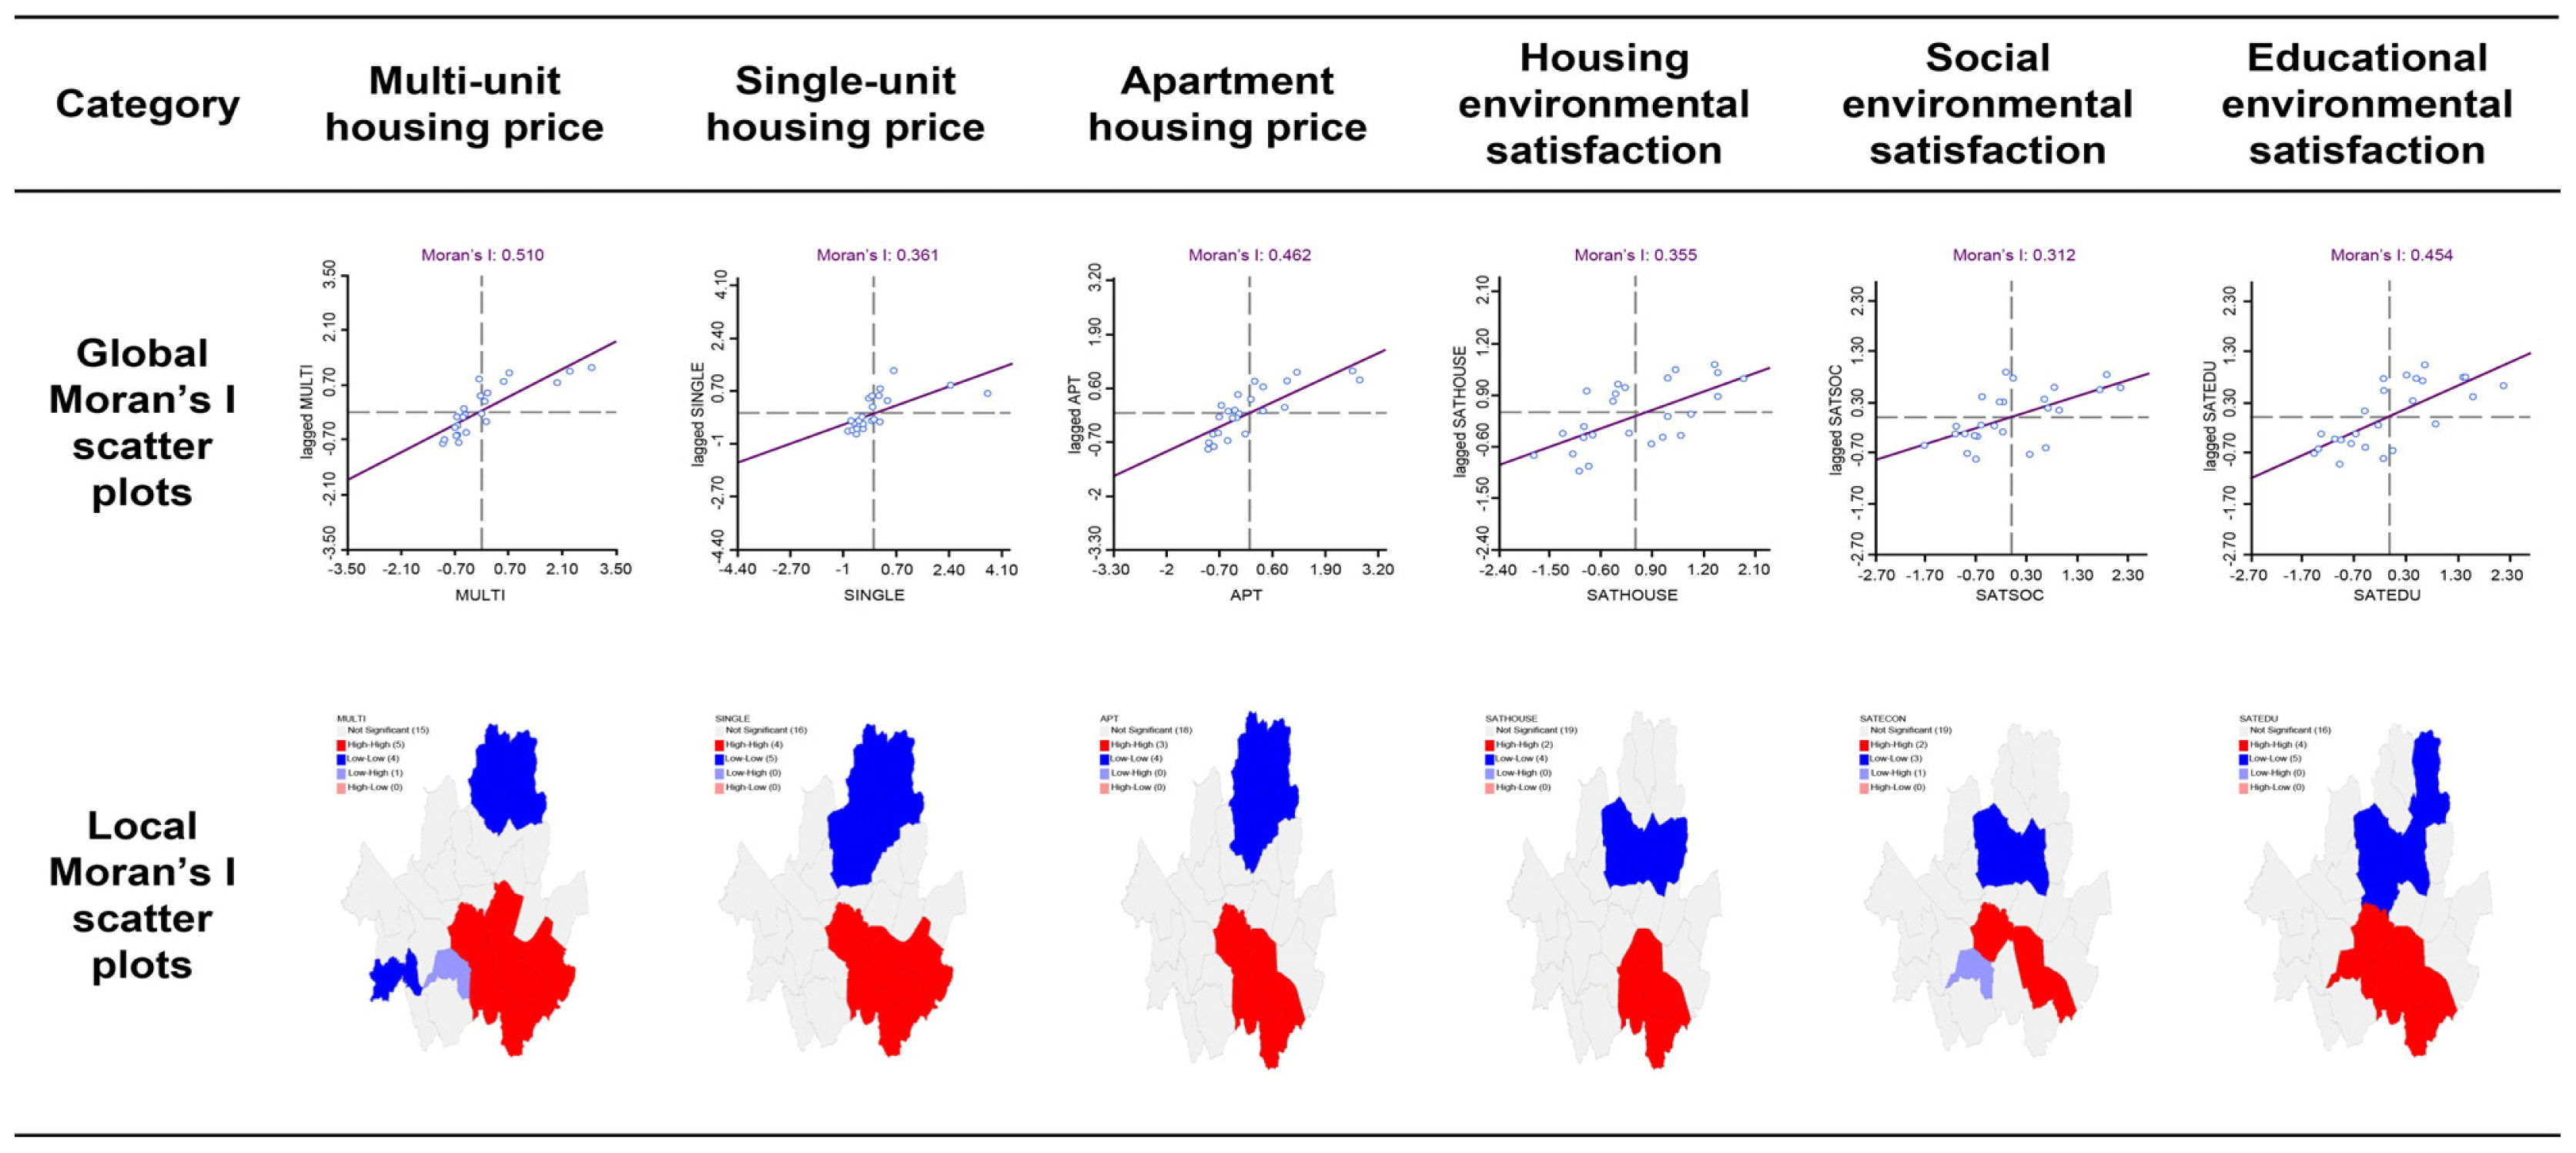
Global and local Moran’s I cluster maps.
Note. Abbreviations: MULTI, multi-unit; SINGLE, single; APT, apartment; SATHOUSE, SATSOC, and SATEDU, housing, social, and educational environmental satisfaction, respectively.
Consequently, spatial regression was used to control for spatial dependence. The spatial regression model can be depicted as
where Y is the residential environmental satisfaction or housing price, x is a matrix of observations on the dependent variables, ρwy is the spatial lag (or error) variable, ρ is the degree of spatial correlation, and w is the spatial weight matrix. The value ρ scales between −1 and 1, and a ρ of zero represents no spatial correlation. A positive ρ demonstrates that residential environmental satisfaction or housing prices tend to be higher if spatially adjacent residential environmental satisfaction or housing prices are higher, and ɛ is a vector of the independent and identically distributed error terms (Ward and Gleditsch, 2008).
The study investigated the external effects of urban heritage sites on residential environmental satisfaction and housing prices by using a spatial regression model that considers and controls spatial effects, such as spatial dependencies arising from spatial autocorrelation. Spatial data include administrative area boundary data from the Census of Statistics Geographic Information Service of Statistics Korea (http://kosis.kr/eng/). Geoda 1.14 and ArcGIS 10.8 were used to analyse the data under special regression analyses.
The complete dataset comprised independent spatial analysis units from Seoul’s 25 Gu and dependent non-spatial analysis units, including average housing prices and the housing, social, and educational environmental satisfaction for each district. Housing prices were sourced from the Land and Transport Department’s open system (Ministry of Land, Infrastructure and Transport, 2016) and calculated by dividing the total housing sale price by the total number of housing sales in 2016. Similarly, residential environmental satisfaction indices were gathered from the Seoul Open Data Plaza (https://data.seoul.go.kr/) and computed by calculating the averages of survey questions administered to 43,737 people on a scale of 1 to 10 (Seoul Metropolitan City Government, 2016; Table 3).
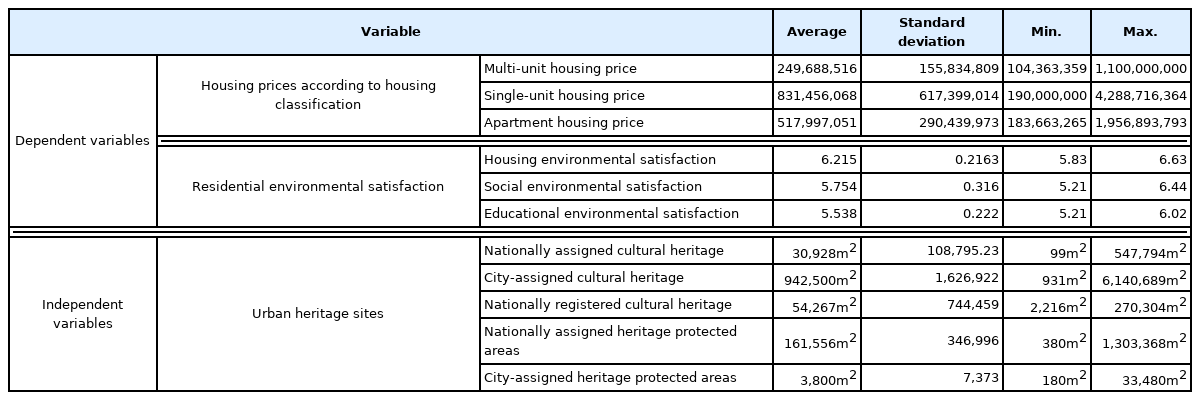
Descriptive statistics of independent and dependent variables
Results and Discussion
The spatial distribution of housing, social, and educational environmental satisfaction and housing prices with the corresponding independent variables is illustrated in Fig. 3, depicting the spatial patterns of housing prices and residential environmental satisfaction alongside urban heritage sites and their conservation areas.
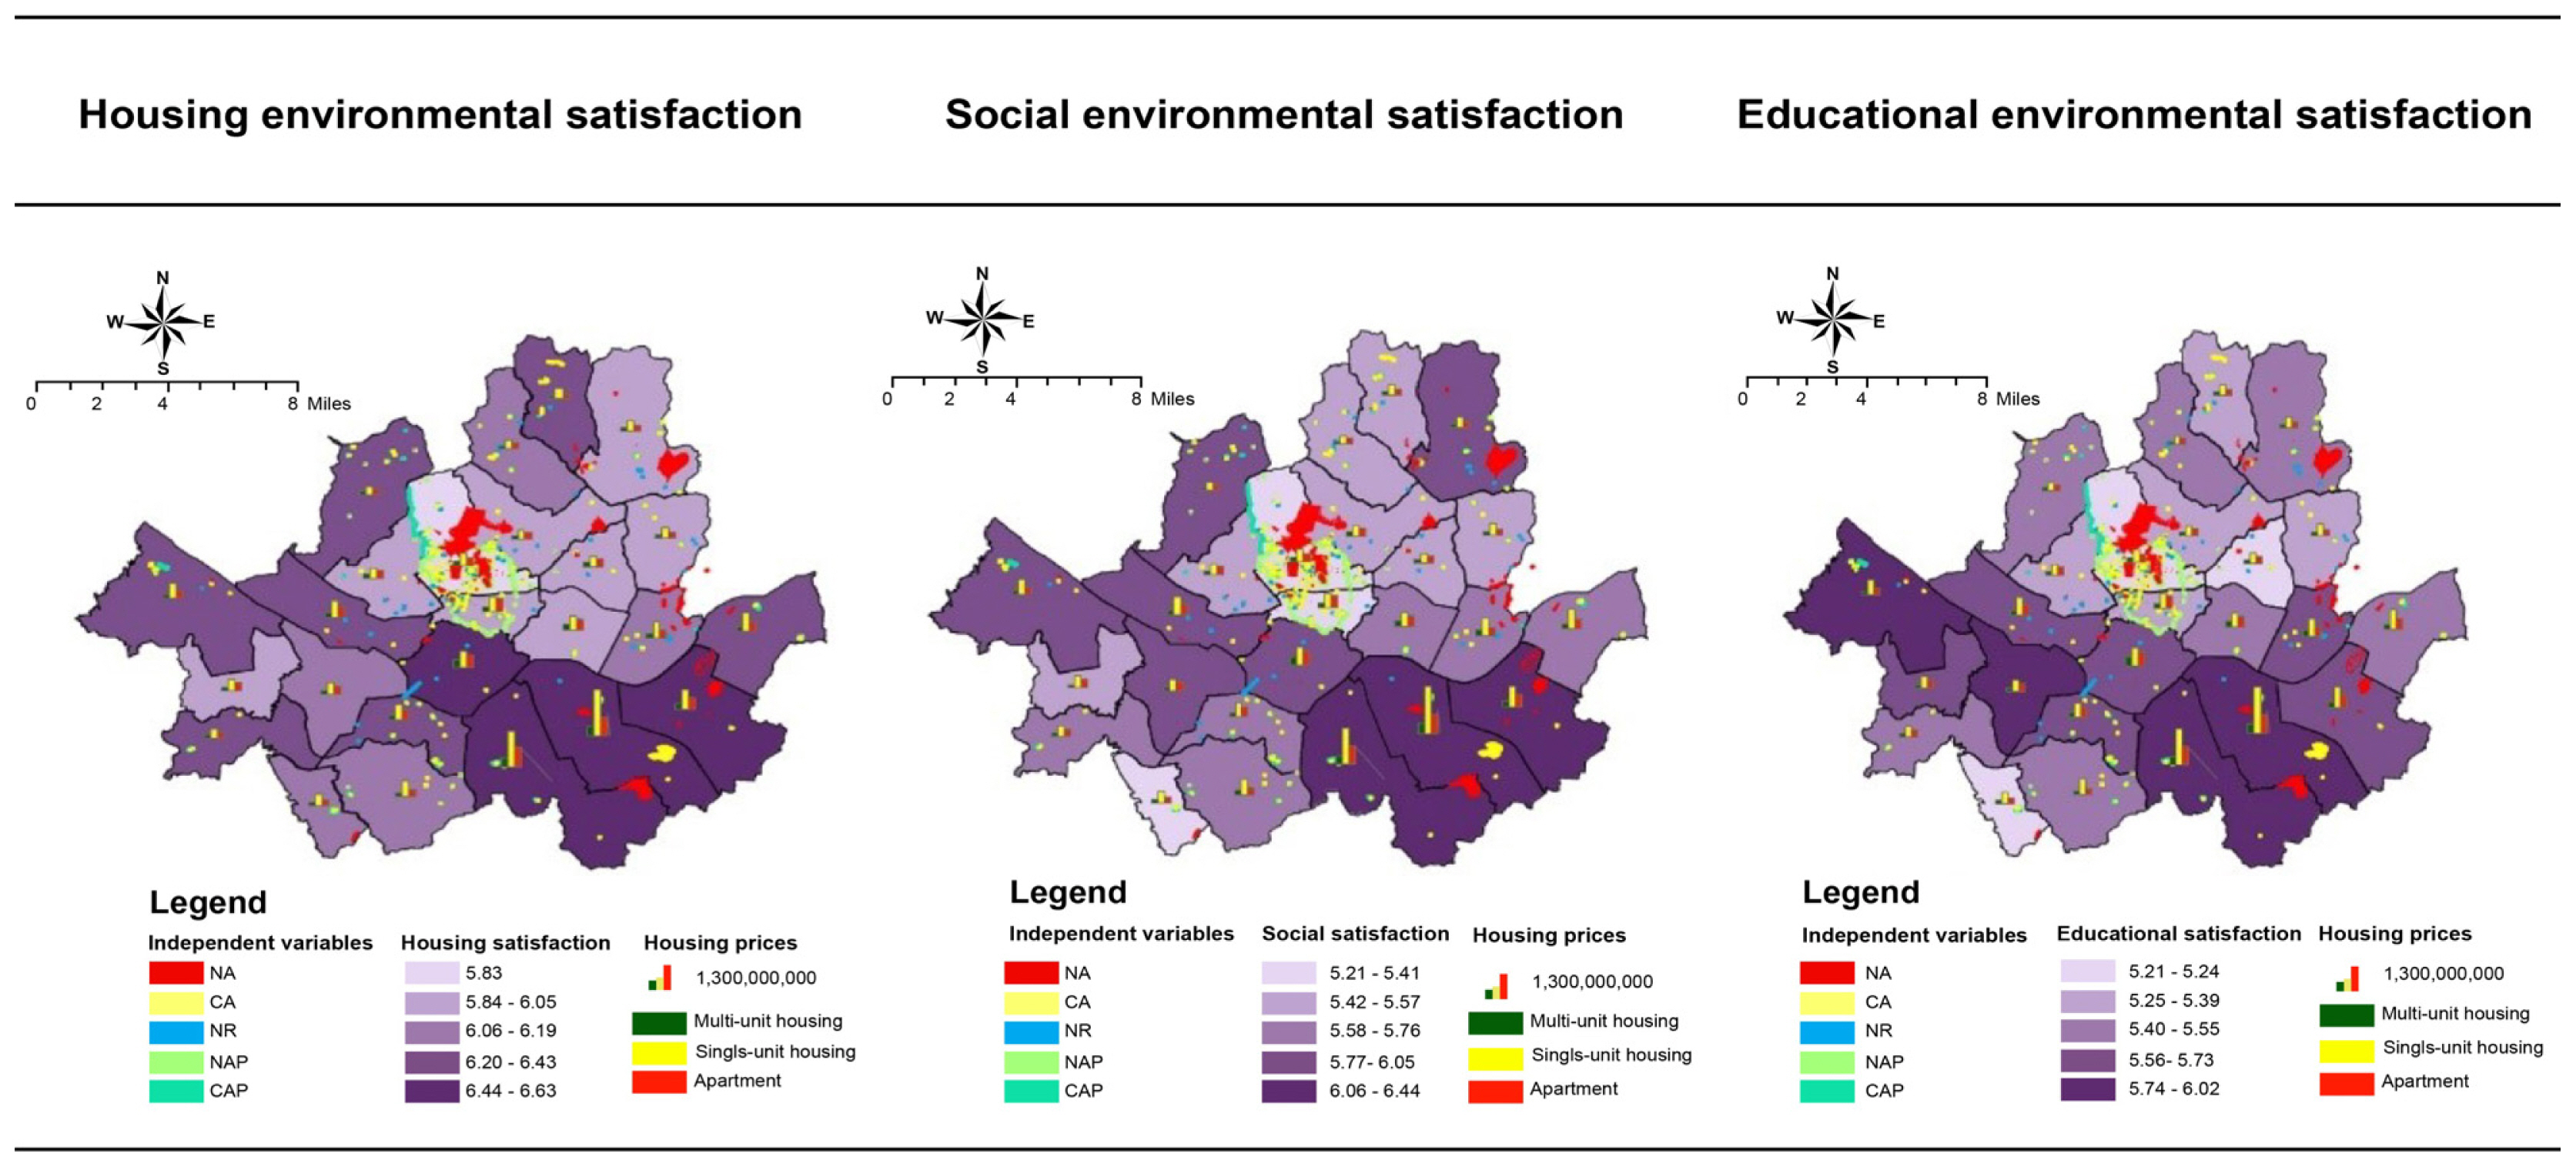
Spatial distribution of residential environmental satisfaction in Seoul.
Note. Abbreviations: NA, nationally assigned cultural heritage; CA, city-assigned cultural heritage; NR, nationally registered cultural heritage; NAP, nationally assigned cultural heritage protected area; CAP, city-assigned cultural heritage protected area.
This study offers three insights. First, most urban heritage sites and their corresponding conservation areas are clustered in the centre of Seoul. Housing, social, and educational residential environmental satisfaction levels are all noticeably lower in the central district of Seoul. Second, city-assigned heritage sites and their conservation areas are more evenly distributed across districts than both nationally assigned and registered heritage sites. Third, housing, social, and educational environmental satisfaction levels are all markedly higher in the south-eastern districts of Seoul, which generally have better public facilities (Sung and Ki, 2021a, 2021b).
To ensure the robustness and reliability of the models, a collinearity test was performed. The results revealed that the value of tolerance is more than one-tenth, and the variance inflation factor of each independent variable is less than 10 (Table 4), validating that there is no correlation between the independent variables.

Collinearity test results for the independent variables
Spatial data on urban heritage sites are often influenced by spatial dependence and heterogeneity (Rey et al., 2016). An ordinary least squares (OLS) regression can result in significant errors (Wittowsky et al., 2020) as it assumes that the values of dependent variables are independent; this assumption can be erroneous if spatial autocorrelation exists, because of spatial dependence and heterogeneity.
A spatial regression analysis that considers spatial autocorrelation was used to examine the urban heritage sites. Spatial dependencies were considered, rather than spatial heterogeneity, because of the relatively high spatial dependencies among all the dependent variables (Fig. 2). Thus, the spatial lag model (SLM) and spatial error model (SEM)—both of which consider spatial dependence—were adopted, rather than the geographically weighted regression model, which considers spatial heterogeneity.
The SLM and SEM were subsequently investigated to discern the most suitable model. Park and Ham (2018) relied on a log-likelihood, Akaike information criterion (AIC), and Schwarz criterion (SC) to determine the most appropriate spatial regression model and its degree of suitability. Compared with the OLS model, suitability was based on the maximum R2, a higher log-likelihood, and lower AIC and SC values (Lee and Noh, 2015). In the final stage of model testing, when similar values were derived, the final model was selected using the statistics of the likelihood ratio test (Seo et al., 2016). If the final model also exhibited a statistically significant rho (SLM) or lambda (SEM), it was employed to explain the spatial spillover effects (Seo, 2014).
Table 5 summarises the OLS, SLM, and SEM analyses using economic, social, and educational environmental satisfaction. Because the Moran’s I values of each dependent variable revealed spatial autocorrelation at both global and local levels (Fig. 2), the study employed spatial regression models to address spatial autocorrelation. Additionally, the values of both R2 and log-likelihood were higher than those in the OLS model, suggesting that it was more appropriate to use the spatial regression model than the OLS model.
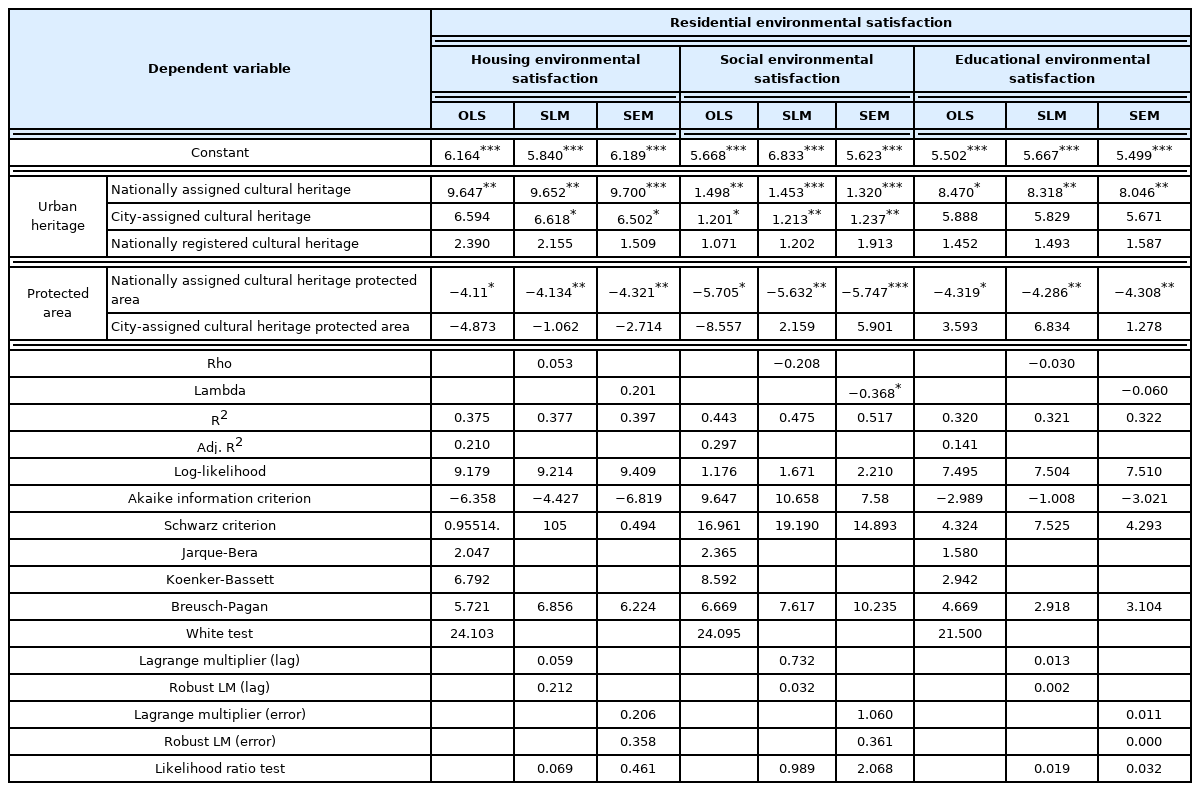
Analysis of residential environmental satisfaction
The analytic results of the spatial regression model analysis were reviewed, and the R2 value was used to determine the most appropriate model. SEM was determined to be the most appropriate model for housing, economic, and educational environmental satisfaction. The R2 value of the SEM was higher than that of the SLM in all residential environmental satisfaction analyses. Additionally, the log-likelihood value, AIC, and SC confirmed this analytical result.
First, the results indicated that nationally assigned cultural heritage sites influenced housing, social, and educational environmental satisfaction positively, whereas city-assigned cultural heritage sites influenced only housing and social environmental satisfaction positively. Second, nationally assigned cultural heritage conservation areas negatively influenced housing, social, and educational environmental satisfaction. Third, city-assigned cultural heritage was only significant for SLM and SEM regarding housing environmental satisfaction. Thus, spatial regression analysis was applied to measure the additional influence of urban heritage sites that occupy specific spaces.
Table 6 summarises the model outcomes regarding housing prices. Due to high spatial autocorrelation at global and local Moran’s I levels (Fig. 2) and higher values for R2 and log-likelihood, compared to the OLS model, the study also employed spatial regression models.
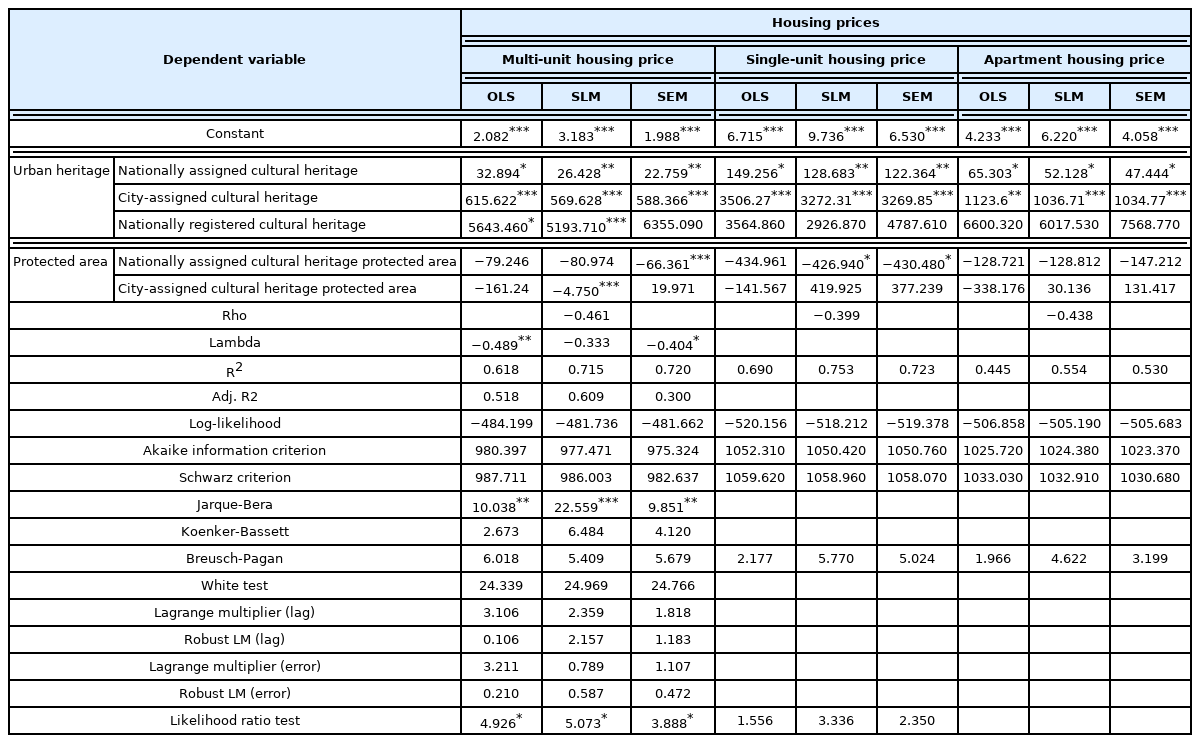
Analysis of housing prices
The results indicated that the SLM was the most suitable model for single-unit and apartment housing types whereas SEM was the most appropriate model for multi-unit housing prices. First, both the SLM and SEM approaches confirmed that nationally and city-assigned cultural heritage sites positively influence all types of housing prices. Second, nationally assigned cultural heritage areas negatively influence multi-unit and single-unit housing prices. Last, nationally assigned cultural heritage protected areas did not have a negative influence on apartment housing prices. Table 7 summarises the major findings of this study, including the best model and the statistically significant independent variables for each dependent variable, to investigate further the mediating effects of residential environmental satisfaction.
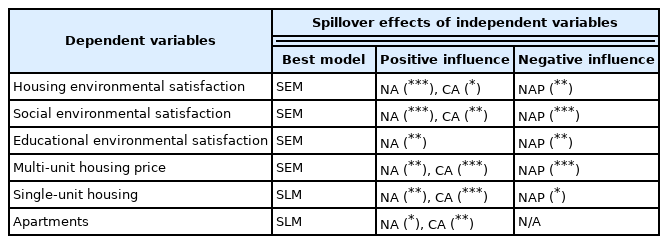
Summary of overall findings
The proposed best models for each dependent variable are illustrated in Table 7. To examine the relationship between residential environmental satisfaction and housing prices, the urban heritage sites that influence residential environmental satisfaction and housing prices were determined. The results demonstrated that nationally and city-assigned cultural heritage sites influenced residential environmental satisfaction and all types of housing prices. These sites were therefore chosen for further analysis.
The results demonstrated the mediating effects of residential environmental satisfaction on housing prices using the SEM (Table 8). Nationally assigned cultural heritage sites and their corresponding protected areas influenced housing, social, and educational environmental satisfaction, while city-assigned cultural heritage sites influenced housing and social environmental satisfaction. Consequently, the mediating effects of housing, social, and educational environmental satisfaction were analysed, focusing on nationally assigned cultural heritage and its protected areas and city-assigned cultural heritage. Statistically, social and educational environmental satisfaction had a perfect mediating effect on the influence of nationally assigned cultural heritage sites on housing prices, whereas social environmental satisfaction had only a partial mediating effect on the influence of city-assigned cultural heritages on housing prices (Table 9).
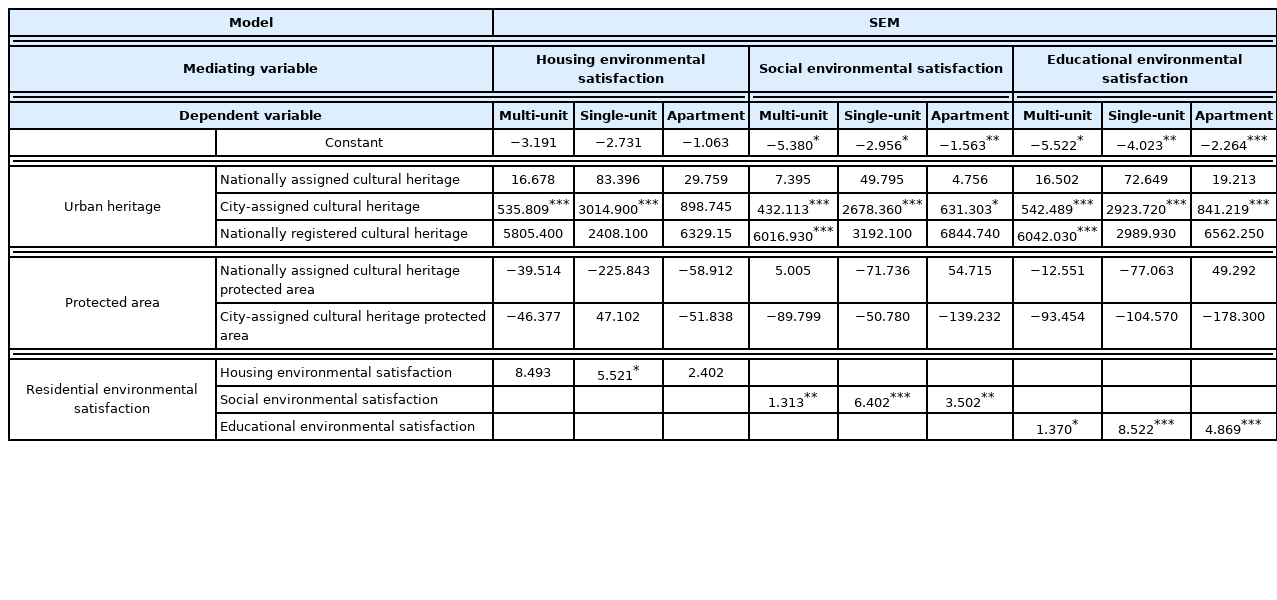
Mediating effect analysis summary
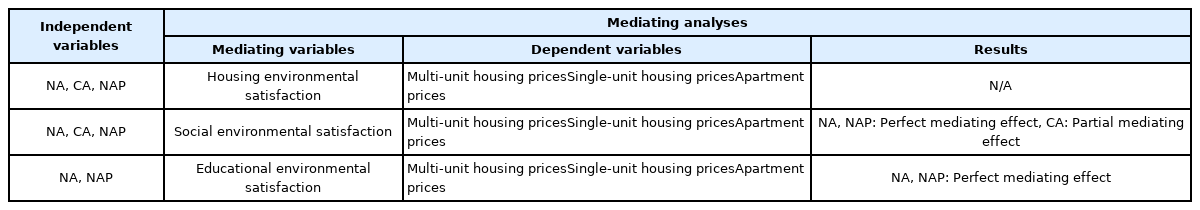
Summary of mediating effects
Nationally assigned cultural heritage protected areas negatively influenced multi-unit, single-unit, and apartment housing prices via the perfect mediating effect of social and educational environmental satisfaction. This suggests that there is a public perception that conservation areas impose on personal property rights and restrict local development (Ko, 2015; Veldpaus et al., 2013). Educational environmental satisfaction had no effect on the relationship between city-assigned cultural heritage and housing prices.
Fig. 4 presents the overall findings that illustrate how urban heritage sites influence housing prices through residential environmental satisfaction using parallel coordinate plots. The parallel plots of A to B demonstrate how urban heritage sites influence residential environmental satisfaction, while those of B to C illustrate how residential environmental satisfaction affects housing prices.
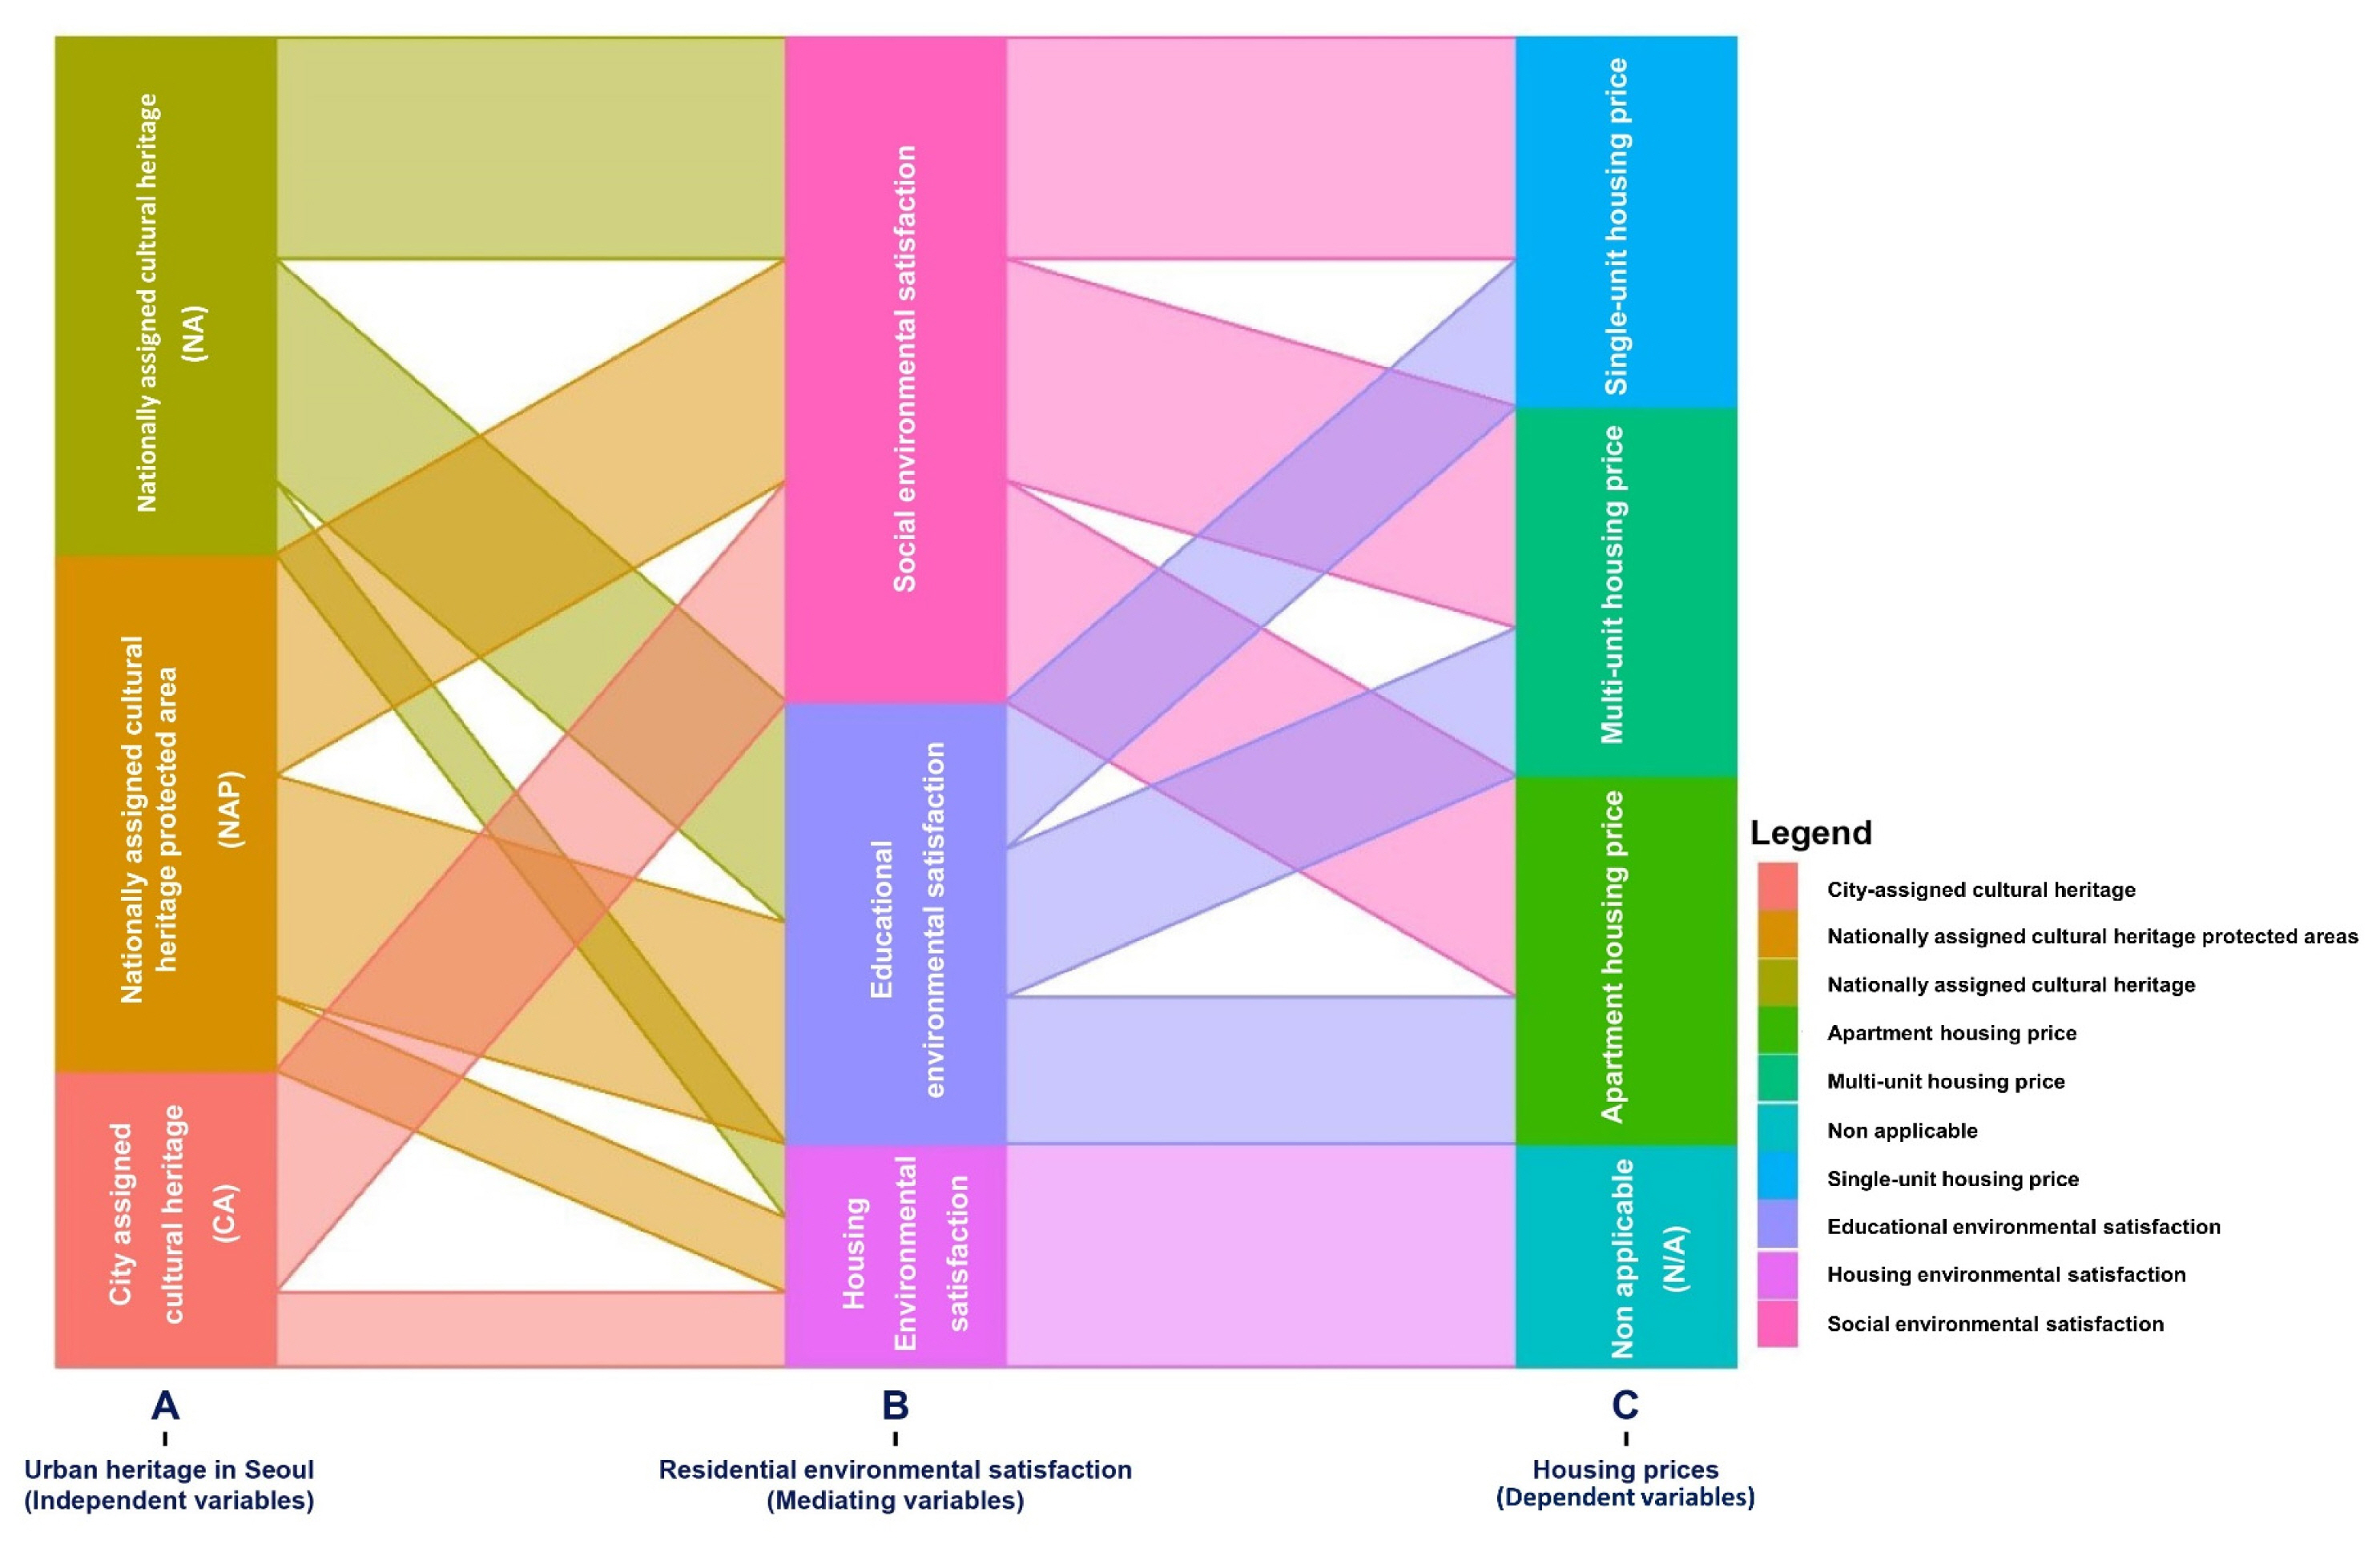
Overall research findings.
Conclusion
The study’s findings confirm that urban heritage sites in Seoul influence housing prices, with residential environmental satisfaction having a mediating effect. Differences in the influence of the different categories of urban heritage sites (Fig. 4) were also noted. Nationally assigned heritage sites positively influenced all types of residential environmental satisfaction, consequently affecting the prices of all housing types. Only social and educational environmental satisfaction positively influenced housing prices via a perfect mediating effect, implying that housing environmental satisfaction is an indicator of individual benefits that have not been transformed into economic benefits. This result is also consistent across nationally and city-assigned cultural heritage sites. Thus, nationally assigned heritage sites have positive socioeconomic benefits.
According to the Korea Cultural Heritage Protection Act (2018), city-assigned heritage sites are local heritage sites that have fewer recognised values. Although they do influence housing prices via social environmental satisfaction, they only have a partial mediating effect on them, possibly because they have a lower ranking. They do not positively influence educational environmental satisfaction; this is consistent with current practices, as most educational interpretive activities and school trips take place in or around nationally assigned cultural heritage sites (Korea Culture and Tourism Institute, 2012; Kim, 2021).
Nationally registered cultural heritage sites did not have a statistically significant influence on residential environmental satisfaction and housing prices (Table 7). These sites are also known as modern cultural heritage—cultural assets dated between 1876 and 1971 (50 years before the current year)—that contain remnants of Seoul’s modernisation process (Pan and Min, 2009). These sites have considerable potential for teaching modern Korean history in the form of school trips, as they offer reference points between Seoul’s past and present (Shipley and Snyder, 2013); however, these sites are generally not recognised as cultural resources, as they are considered an unwanted legacy of Japanese colonial rule (Pan and Min, 2009). Consequently, many of these sites have been neglected and allowed to fall into disrepair (Park, 2021). Thus, future research should focus on developing the untapped potential of these sites in terms of their socioeconomic benefits.
Nationally assigned protected areas adversely influence all types of housing prices via social and educational environmental satisfaction, because planning controls aimed at preserving the identity of the areas impose constraints on residents’ property rights (Franco and Macdonald, 2018; Rudokas et al., 2019; Throsby, 2019). People’s perception of these constraints negatively influences their residential environmental satisfaction, which, in turn, affects housing prices (Mellen, 2021), as demonstrated by Seoul’s earthen fortifications (Ko, 2015). Although property owners’ short-term interests should not override longer-term public interests (Throsby, 2019), cultural heritage branches in the government—such as Korea’s Cultural Heritage Administration—should encourage residents to recognise the socioeconomic benefits of conservation areas (Wright and Eppink, 2016). Erecting signboards and creating relevant cultural programs prior to designating conservation areas are some ways to achieve this.
This study has certain limitations. First, the residential environmental satisfaction survey data may have been influenced by other predictors of residential satisfaction (Van Duijn and Rouwendal, 2012); for example, wealthier and more educated individuals have a greater preference for living near urban heritage sites (Koster et al., 2016). A further in-depth analysis that considers the socioeconomic and demographic traits of residents is necessary to avoid aggregation errors (Jones and Duncan, 1996).
Second, a cross-sectional dataset from 2016 was employed, without a time-series analysis, because longitudinal data were not available. Heritage is regarded as a social and cultural phenomenon that is likely to change over time (Rudokas et al., 2019), and such changes affect residents’ satisfaction. Additionally, housing prices also fluctuate in response to government policies; therefore, housing prices and residents’ satisfaction are likely to change over time (Rudokas et al., 2019). This calls for follow-up research that integrates additional data (Kabisch et al., 2021).
Nevertheless, the study’s exploration of the socioeconomic impacts of urban heritage in Seoul provides a useful intellectual foundation for cultural heritage policymakers. First, it offers insight into how to achieve the optimum balance between private and public interest in the conservation of urban heritage sites (Ministry of Housing, Communities, and Local Government, 2021; Throsby, 2019) within the context of rapid urbanisation and uncontrolled development. Second, the findings can inform policies related to cultural heritage by identifying the strengths and weaknesses of current practices and focusing on activities that offer the greatest socioeconomic benefit. Third, the findings can help determine the optimum use of public funds by providing insights into the socioeconomic benefits of various urban heritage sites (Sagger et al., 2021).
Public departments related to the heritage sector, such as the Ministry of Culture, Sports, and Tourism and the Cultural Heritage Administration, have launched several cultural policies to stimulate cultural heritage tourism and improve regional resources (Choi and Oh, 2019); however, most domestic and international tourists are motivated by shopping, food tourism, and scenic tourism, implying that heritage tourism remains lacking (Choi and Oh, 2019). Most cultural policies focus on major heritage sites, such as World Heritage Sites; this means that local heritage sites such as nationally registered cultural heritage sites must be further supported and developed. The public perception of cultural heritage as ‘dull’ and ‘difficult to understand’ can be changed by offering a diverse array of activities (Choi and Oh, 2019) to maximise the benefits of urban heritage.
The Korean government started promoting social services through the concept of community-based social overhead capital to improve people’s lives and provide basic everyday facilities, including cultural and welfare resources (Office for Government Policy Coordination, 2019). In addition, it developed a five-year plan (2018–2022) to create desirable living environments for residents using cultural heritage-driven branding, especially for places where the population is declining (Presidential Committee for Balanced National Development, 2020). The current research may provide an intellectual foundation for the government’s community- and heritage-based policies. Finally, it also provides insights into government-led cultural policies that consider residents’ satisfaction.
Notes
This paper is based on my master’s dissertation at Durham University. I would like to thank Mrs Clare Carr in the Durham Centre for Academic Development for her advice on the draft of the master’s dissertation. I also thank my classmates in the course of International Cultural Heritage Management at Durham University for supportive discussions and feedback as was developing Master’s dissertation topic.
References
South Korean Cultural Heritage Protection Act. 2018. C. 1. Retrieved from https://www.law.go.kr/LSW/eng/engMain.do