Decision Tree Model for Educational Services Predicting Children’s Academic Performance by Income Group
Article information

Abstract
Background and objective
This study used the decision tree analysis among data mining techniques to determine whether children’s academic performance can be classified and predicted by income group based on factors of educational services.
Methods
For empirical analysis, data from the 10th Panel Study on Korean Children collected in 2017 was utilized. A F test was conducted to analyze the differences in variables by income group, and a decision tree analysis was conducted on the cost and time of private education services utilized by children to predict their academic performance by income group.
Results
First, as a result of analyzing the research variables by income group, there was a significant difference in institute time, community center time, institute cost, lesson cost, after-school cost, and culture center cost. Second, as a result of the decision tree analysis that predicts children’s academic performance by income group, it was found that for children in the low-income group, institute cost, institute time, visiting cost, and after-school time were important variables that predict their academic performance. For children in the middle-income group, institute cost, after-school time, and after-school cost were important variables for predicting academic performance. For children in the high-income group, the important variables were institute time, institute cost, after-school time, and after-school cost.
Conclusion
There was no significant difference in children’s academic performance in the earlier grades of elementary school, but there was a significant difference in the private education service they utilized, which may affect future income gaps as well as education gaps. This suggested the need to diversify and improve the quality of public education services as a countermeasure for the fact that parental income will cause an academic gap among children through private education.
Introduction
Academic performance is a not only key factor that significantly affects children’s ability to adjust to school life (Balboni and Pedrabissi, 1998; Määttä et al., 2007; Kim, 2018; Kim and Kwon, 2018; Kim and Hong, 2019), but also a factor that determines children’s intellectual development as well as future social and economic status (Phang and Kim, 2002; Lee and Jung, 2013). For this reason, studies are being strengthened on factors that affect academic performance.
Many previous studies are emphasizing the increase in the impact of the home environment on academic performance (Balboni and Pedrabissi, 1998; Kim and Youm, 2009; Lee and Jung, 2013). In particular, it is a view that there is a strong positive correlation between the socioeconomic status of parents and academic performance of children. The dominant view in the Korean society is that the academic gap among children is due to their socioeconomic background rather than the physical learning conditions of school itself (Kim, 2005; Kim et al., 2016). For example, in elementary, middle, and high schools, children whose parents have higher socioeconomic status tend to show higher achievement in Korean language and mathematics, which is even more so in higher education (Namgung et al., 2012). Recently, it has been discovered that the socioeconomic background of the family affects the education experience and development in early childhood, ultimately causing a difference in the level of academic performance for children in early grades of elementary school as well (Kim, 2019). This implies that efforts must be made to reduce educational inequality so that the academic performance gap is not structuralized from the beginning of school age. Moreover, the socioeconomic background of the family is likely to be reflected in the early grades of elementary school, since private education is forced by parents to improve their children’s academic performance regardless of the children’s awakening or interest. In fact, most children in Korea are using educational services like private institutes, private lessons, or home visiting lessons. Since a variety of private education services are used, there is also a difference among households in the financial burdens due to the use of services. This may lead to a difference in academic records and even affect children’s entry into higher education institutions.
Previous studies on the direct and indirect correlation between private education and children’s academic performance also report that parental income or education level is proportional to the time of using private education services and the cost of private education (Kim et al., 2016; Song et al., 2016; Zhang and Xie, 2016; Choi et al., 2021). More specifically, children whose fathers had higher level of education and worked in high-income professional or administrative positions showed higher academic achievement (Kim, 2005) as well as higher private education expenses (Zhang and Xie, 2016). According to Statistics Korea (2020), the private education participation rate of elementary, middle, and high school students in 2019 is 74.8%, and those with higher average monthly household income and higher school grades showed greater private education expenses and participation rate (Statistics Korea, 2020). As such, the socioeconomic status of parents affects the quality of educational opportunities in alignment with private education expenses. Previous studies on the effect of private education on academic performance proved that students with higher participation rate in private education from the start showed higher academic achievement, although there are some exceptions (Park, 2012). Moreover, those spending more time and cost on private education showed higher achievement in mathematics (Kim and Lee, 2011). In the end, participation in private education based on the economic capacity of parents appears as a process in which the economic power of parents leads to social reproduction through private education services (Park, 2012). Therefore, since not only children’s efforts but also the economic background of their parents have a significant effect on academic performance, it is necessary to establish methods to improve educational equity by minimizing the gaps between income brackets beyond just evaluating children’s academic performance.
With regard to children’s academic performance, the human capital theory that focused on the components of economic resources at home also emphasizes the importance of household income (Shanks, 2007). According to this theory, not only economic power but also biological and sociocultural foundation of parents that created the wealth can also be passed down (Weitzman et al., 2014). In particular, the inheritance of the socioeconomic status was apparent on both extremes, and there was an economic gap even in the highly-educated group. In other words, rather than higher education leading to income increase, parents’ socioeconomic status tends to be inherited to children (Yeo, 2008). As such, household income is known to be closely related to not only children’s academic performance but also future economic status (Brooks-Gunn and Duncan, 1997; McLoyd, 1998; Guo and Harris, 2000; Mayer, 2002). Above all, low family income results in children’s poor academic performance in alignment with their parents’ psychological characteristics or undesirable parenting methods (Brooks-Gunn and Duncan, 1997; McLoyd, 1998; Bradley and Corwyn, 2002; Ku et al., 2006; Lee et al., 2006; Lee and Kim, 2009). In addition, this brought more negative results in educational achievement of early grades including preschool compared to adolescence (Bradley and Corwyn, 2002; Kim and Kim, 2020), while also having a greater correlation with the low rate of high school graduation (Brooks-Gunn and Duncan, 1997; McLoyd, 1998). This evidence implies the need for early intervention and the government’s investments in education for children in the low-income group.
Meanwhile, the qualitative difference in parent-led education in which spiritual and material investments in education are possible generates a difference in habitus related to education and studies (Bourdieu and Passeron, 1977). Moreover, since the explicit request that scholastic achievements indicate success in lifelong development and maintenance of the middle class only applies to middle-class families or higher, children in high-income families show higher scholastic achievements than children in low-income families (Bourdieu, 1984). If the impact of private education on children’s academic performance grows, wealthier classes will make more investments in education to prepare for their children’s future lives, which will even increase the gap in education level between income brackets, thereby making social mobility through education even more difficult (Evans and Kim, 2007). At the same time, considering that the inequality of educational conditions in Korea has become a social issue along with regional and income disparities, the central and local governments are accelerating their effort to increase educational equity (Kim et al., 2020). After-school learning programs are established to reduce the gap of care for children in the early grades of elementary school, and public and private support is increased for children in low-income families and vulnerable groups, which are some of the efforts to reduce educational inequality (Park and Namgung, 2019).
As such, studies on home environment that affects children’s academic performance are focused on analyzing the relevance with parents’ socioeconomic status. However, they have limitations in failing to specifically examine the difference in the use of educational services originating from the socioeconomic background such as parents’ occupation and household income. Moreover, there is insufficient research on how educational services used by children vary depending on the income group. Above all, while there are studies on the effect of private education for middle and high school students, not enough are on private education for students in the early grades of elementary school. In fact, the intensity of private education in the early grades of elementary school may not immediately lead to scholastic achievements, which is why it has not received attention from the academia (Wells et al., 2010). However, it is important since it can be a trigger of habitus related to learning, as well as learning attitude and the capacity to utilize the learning resources. In particular, studies on private education for children in the early grades of elementary school have significance in that they can examine when the education gap from income disparities begins.
In sum, even if the gap among income groups in using educational services does not directly lead to children’s academic performance, it will be possible to investigate various differences in educational services and learning of students (Wells et al., 2010). This is because the aforementioned habitus not only indicates the mere difference in academic records but also is formed by the accumulation of experiences obtained in the process that leads to the difference. Furthermore, it is necessary to analyze whether it is possible to classify and predict academic performance by income group based on educational services used by children. In particular, children’s learning time and parents’ investment costs are key factors in considering educational services used by children for scholastic achievements. Thus, it is necessary to comprehensively analyze various factors regarding parents’ unilateral investments and children’s scholastic achievements and examine the differences by income group. Therefore, this study used the decision tree methodology as a data mining method that helps objective understanding and presents visual diagrams based on path analysis of learning behavior of students using various multiple public and private education institutions.
Moreover, economic resources of families among variables predicting children’s academic performance had been focused on income before, but recently they include assets as well. Net assets of parents have a significant effect on the academic performance of children in the early grades of elementary school (Campbell, 2006) and also have a positive effect on that of children aged 3–12 even after controlling parental income (Shanks, 2007). In particular, the analysis was conducted considering assets and home ownership that are easily converted to cash have close correlation with scholastic achievements (Kim and Sherraden, 2011).
Accordingly, the purpose of this study is to investigate whether it is possible to classify and predict children’s academic performance by income group based on factors of educational services using the decision tree methodology. Research questions for this purpose are as follows.
Research question 1: Is there a significant difference in children’s academic performance and predictor variables by income group?
Research question 2: Are the decision trees predicting children’s academic performance different among income groups?
Research Methods
Subjects
This study was conducted using the 2017 data of the 10th Panel Study on Korean Children. With non-responses processed as missing values, 434 children were analyzed as the subjects. The children were 113 months old on average, all of them in Grade 3, which is one of the early grades of elementary school. There were 221 male and 213 female children.
Measurement tool
The measurement tools used in this study are as shown in Table 1.

Measurement tools used in this study
Analysis method and tool
This study used the z-score to analyze and summarize the income classification standard, conducted an F-test to analyze the difference in research variables by income group, and performed a decision tree analysis to predictively analyze educational services that predict children’s academic performance by income group.
Decision trees or tree models classify or predict total data in a few small groups by showing the rules of decision making in the form of a tree, and they are divided into classification trees when the target variables are discrete and regression trees when the target variables are continuous. When there is splitting based on the selected standard, lower significance of x2 leads to higher heterogeneity among child nodes, and higher Gini index and Entropy index in child nodes indicate higher heterogeneity among child nodes (Na, 2017). The analysis tool used in this study is R 3-6-2, and the analysis was conducted with ‘dplyr’ for data preprocessing and ‘rpart’ and ‘rpart.plot’ functions for decision trees.
Results and Discussion
Classification standard for income groups and descriptive statistics of research variables for each income group
Classification standard for income group (property)
Table 2 shows the results of standardizing and adding up income, estate, and assets to classify the income groups.
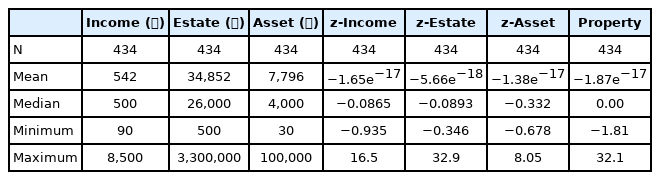
Total income
Table 3 shows the results of classifying the income groups into the low-income group, middle-income group, and high-income group.

Classification criteria for income groups
Descriptive statistics of research variables for each income group and validation of differences
Table 4 shows the results of the F test conducted for validation of differences and descriptive statistics of research variables for each income group. There was a significant difference in institute time (f = 7.55**), community center time (4.691*), institute cost (50.598***), lesson cost (16.215***), after-school cost (9.50**), and culture center cost (5.59*).

Descriptive statistics of research variables by income group
Decision tree for educational services by income group
Importance analysis of predictor variables for academic performance by income group
The Gini index is used to analyze the importance of variables predicting academic performance by income group. The Gini index is one of the statistics used in data mining that analyzes predictability according to input variables depending on how much the Gini impurity is reduced according to variables of each input. Specific results are as shown in Table 5. In the low-income group, institute cost showed the highest importance, followed by institute time, visiting cost, and after-school time. In the middle-income group, institute cost showed the highest importance, followed by after-school time, after-school cost, and community center time. In the high-income group, institute time showed the highest importance, followed by institute cost, after-school time, and after-school cost. In the low-income group and high-income group, variables with a small decrease in the Gini impurity depending on input variables were not analyzed.

Prediction importance
Decision tree for educational services related to prediction of children’s academic performance by income group
To analyze the fit of the decision tree model, the cost-complexity parameter, cross-validation error (x-error), and pruning frequency (nspilt) are used. The cost-complexity parameter in the decision tree model is one of the criteria provided to discontinue the growth of the tree model before it is overfitted. The depth of the tree can be adjusted by the cost-complexity parameter. Cross-validation error is to minimize tree construction during splitting. There was no model overfitting in three income groups of this study. The results of summary focused on pruning frequency up to the lowest cost-complexity parameter are as follows.
First, Fig. 1 shows the analysis of children in the low-income group. These children showed the highest academic performance at 4.6 when institution time was lower than 4.5, visiting cost was lower than 12, and lesson cost was lower than 10. They showed the lowest academic performance at 3.5 when institute time was 4.5 or higher, after-school time was 3.8 or lower, and institute cost was 12 or lower.
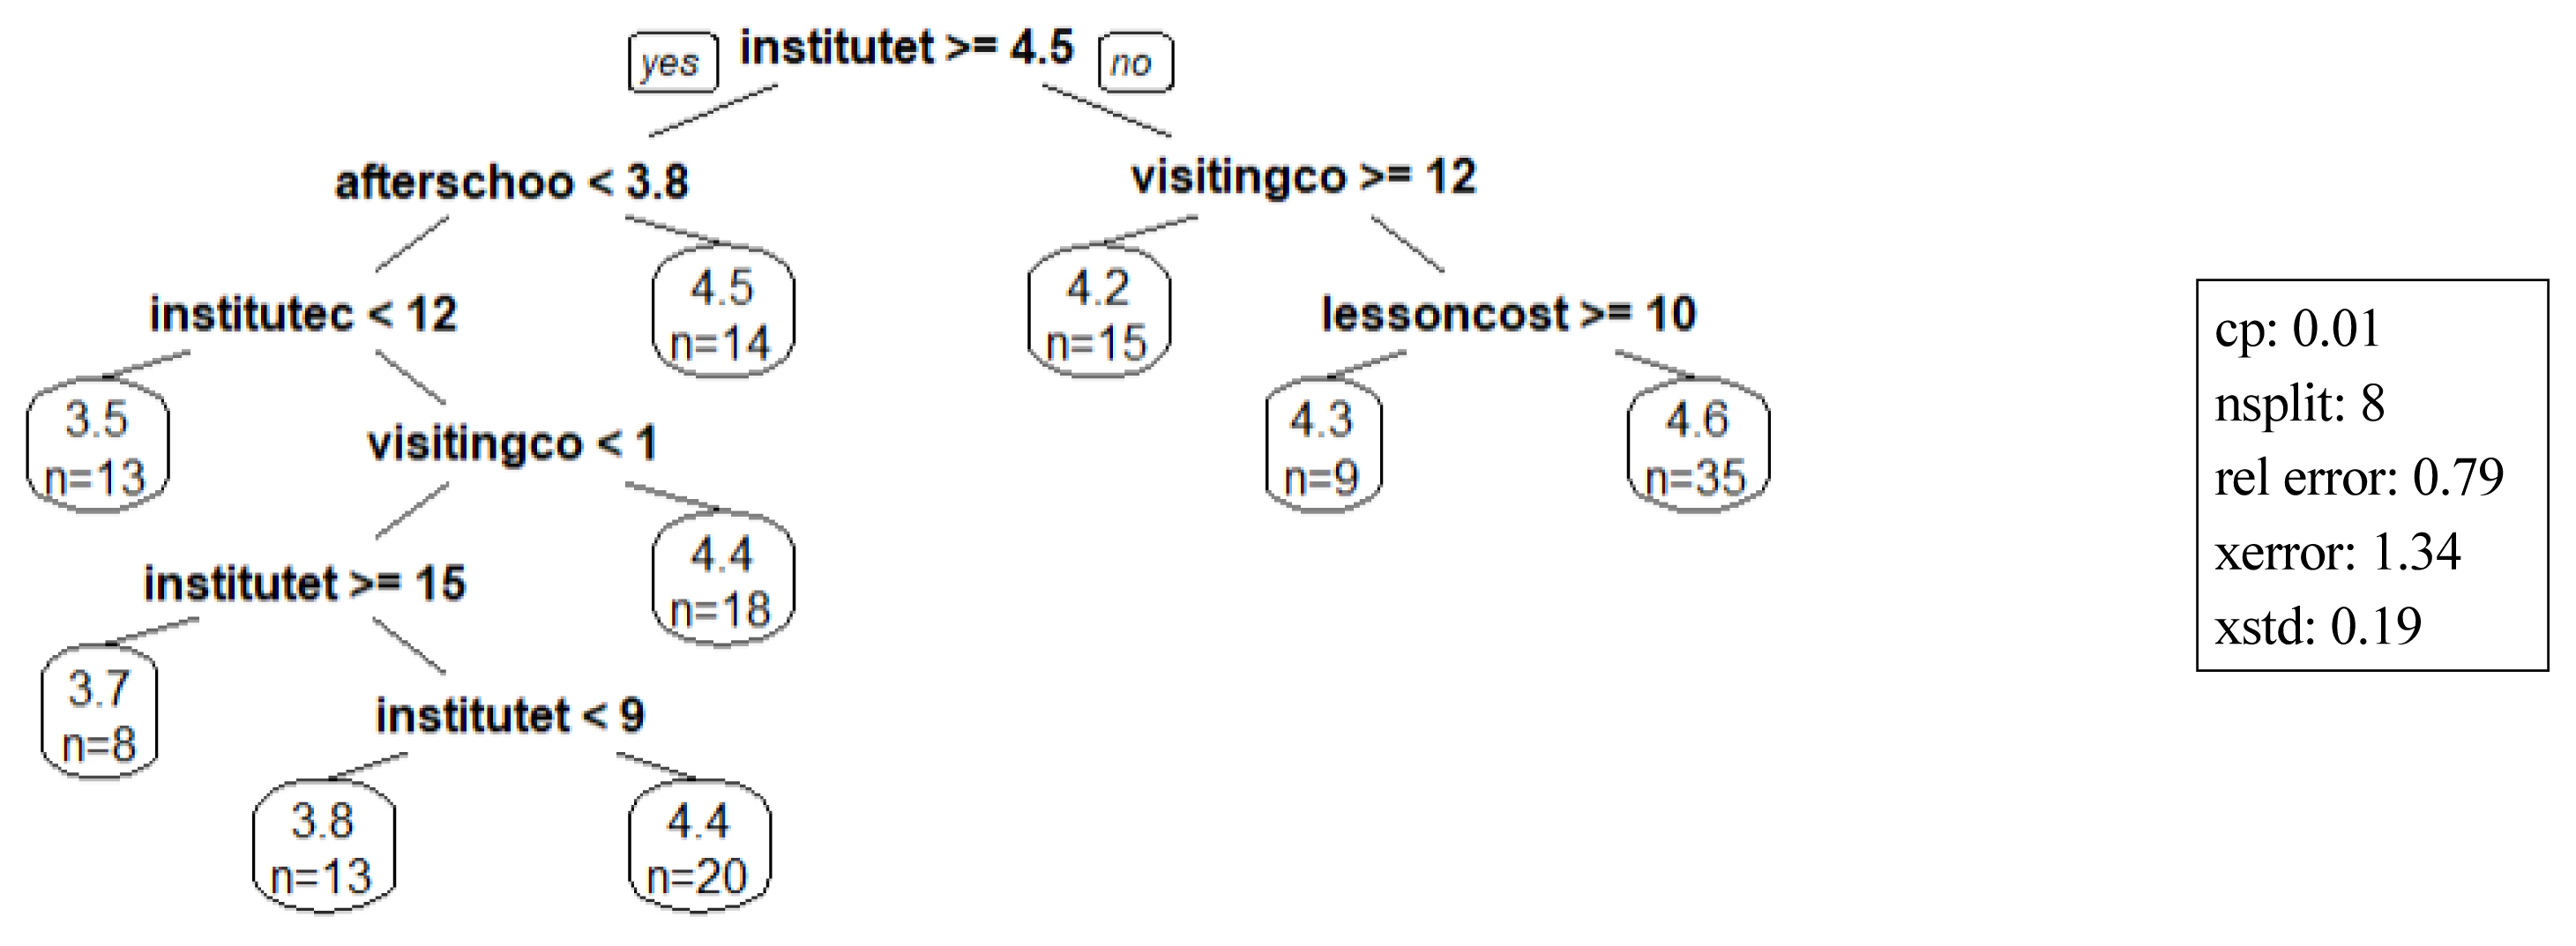
Decision tree for educational services related to the prediction of academic performance of low-income group children.
Fig. 2 shows the analysis of children in the middle-income group. The number of splits until the cost-complexity parameter became .01 is 8, and the minimum cross-validation error in the tree construction of the model in this case is 1.32.
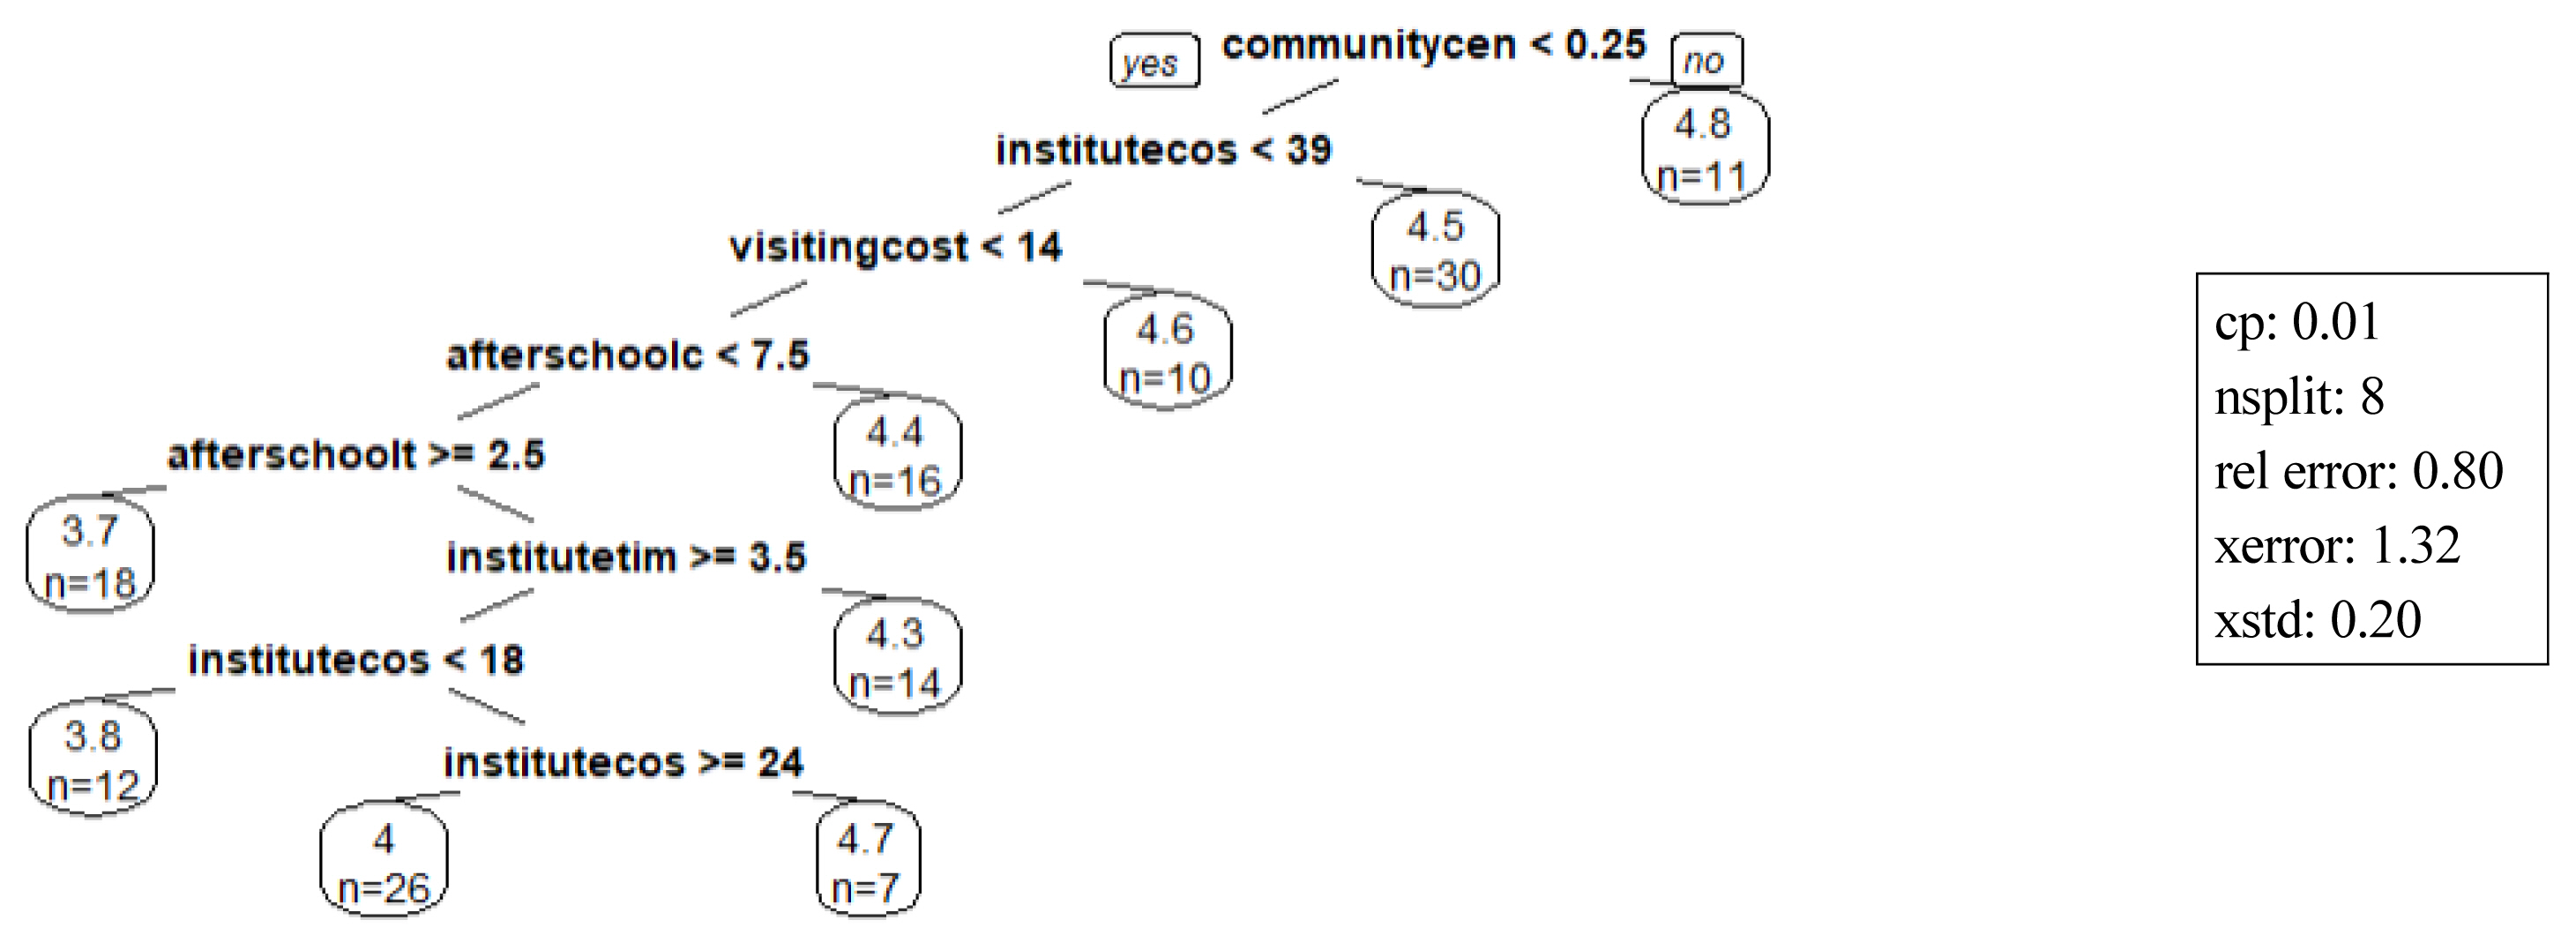
Decision tree for educational services related to the prediction of academic performance of middle-income group children.
Children in the middle-income group showed the highest academic performance at 4.8 when community center time was .25 or higher, and the lowest academic performance at 3.7 when community center time was .25 or lower, institute cost was 39 or lower, visiting cost was 14 or lower, after-school cost was 7.5 or lower, and after-school time was 2.5 or higher.
Fig. 3 shows the analysis of children in the high-income group. The number of splits until the cost-complexity parameter became .01 is 5, and the minimum cross-validation error in the tree construction of the model in this case is 1.15. Children in the high-income group showed the highest academic performance at 4.7 when institute cost was 3.3 or higher and after-school cost was 1.8 or higher, and the lowest academic performance at 3.6 when institute time was lower than 3.3 and institute cost was 1.3 or higher.

Decision tree for educational services related to the prediction of academic performance of high-income group children.
Conclusion
The purpose of this study is to investigate whether the academic performance of children in the early grades of elementary school can be classified and predicted by income group based on educational services using the decision tree analysis. To this end, this study used the 2017 panel data of the 10th Panel Study on Korean Children to explore the importance of variables predicting academic performance of each income group, thereby laying the groundwork for practical approach by income group. The responses about 434 children in Grade 3 of elementary school excluding missing values are the final data for analysis. More specifically, the results were derived using the decision tree analysis of data mining and differences among the low-income, middle-income, and high-income groups. The decision tree analysis is used to classify total data into a few small groups for prediction by presenting the decision- making rules in the form of a tree.
The results and discussions based on the research questions are as follows. First, as a result of analyzing the research variables by income group, there was a significant difference in institute time, community center time, institute cost, lesson cost, after-school cost, and culture center cost. This indicates that there is a difference in learning methods depending on parental income in using educational services for academic performance. However, there was no significant difference among income groups for children’s academic performance, which is the target variable of this study. This is contrary to the results of previous studies claiming that children’s academic performance varies among income groups (Brooks-Gunn and Duncan, 1997; McLoyd, 1998; Bradley and Corwyn, 2002; Ku et al., 2006; Lee et al., 2006). Since the evaluation of academic performance in the 10th Panel Study on Korean Children was performed by homeroom teachers based on the usual self of the panel children, and 56.5% of all children were within the top 20% (Do et al., 2018), there seems to be no discrimination capacity. However, this is because the evaluation method with low discrimination capacity is adopted, not because there is no difference in academic performance among students. In other words, the discrimination capacity is hidden by the arbitrary evaluation method rather than being nonexistent. Thus, parental investment in their children is an effort to improve academic performance to prepare for their children’s future with a long-term view instead of thinking of the current evaluation method. Moreover, considering that the subjects of this study are children in the early grades of elementary school, the results are not consistent with studies proving that poverty in the early grades leads to lower educational achievement than poverty in adolescence (Bradley and Corwyn, 2002; Kim and Kim, 2020). However, based on the argument that poverty in the early grades does not lead to immediate academic performance but rather affects high school graduation after a certain period of time (Brooks-Gunn and Duncan, 1997; McLoyd, 1998), it must be noted that the difference in use of educational services by children in the early grades is likely to lead to a significant difference in performance in higher education.
Meanwhile, even though academic performance did not show a significant difference among income groups, as a result of dividing children into the quantitative aspect that measures the number of children that reached a high level of academic performance and the qualitative aspect that is the education level, most children in the high-income group (128) showed the academic performance of 4.1 or higher. On the other hand, children in the middle-income group (114) and children in the low-income group (114) scored 4.0 or higher. Thus, a quantitative gap according to use of educational services from early education by income is not nonexistent. This indicates that parents’ economic status may serve as a factor that inhibits not only children’s intellectual development but also scholastic achievements (Kim, 2019; Brooks-Gunn and Duncan, 1997; McLoyd, 1998; Bradley and Corwyn, 2002; Ku et al., 2006; Lee et al., 2006), and the unequal distribution of capital causes a difference in quality development among children, thereby resulting in unbalanced development among them (Becker and Tomes, 1986; McLoyd, 1998; Mayer, 2002).
Second, as a result of analyzing the decision trees predicting children’s academic performance by income group, it was found that for children in the low-income group, institute cost, institute time, visiting cost, and after-school time were the key variables that predict academic performance. For children in the middle-income group, institute cost, after-school time, and after-school cost were the key variables that predict academic performance. For children in the high-income group, the key variables were institute time, institute cost, after-school time, and after-school cost. This shows that children in each income group either improved or reduced academic performance by combining different factors of educational services. More specifically, children with the highest academic performance among those in the low-income group had limited institute time, visiting cost, and lesson cost. This indicates that children with high academic performance among those in the low-income group are free of certain educational methods and may anticipate improved academic performance when they encounter various forms of educational services. The fact that the effect of poverty varies depending on the stages of child development and is greater for younger children (Brooks-Gunn and Duncan, 1997; Duncan et al, 1998; McLoyd, 1998) indicates that eliminating or alleviating factors that inhibit academic performance may lead to contrary results. This raises the need to examine children’s individual and environmental characteristics that lead to high academic performance by overcoming the difference in use of educational services regardless of household income.
Furthermore, children’s academic performance decreased in the low-income group when there was less institute cost invested compared to institute time. This implies that quality of educational services is more helpful than quantity in children’s scholastic achievements, and private education that is lower in cost than time tends to lack effect. However, the fact that children in the low-income group have limited after-school time implies that private education in the early grades of elementary school can not only improve academic performance but also provide care for children in the early grades.
Third, children with high academic performance in the middle-income group showed high community center time, indicating that the role of local community centers for children is significant. However, it is difficult to generalize the correlation with academic performance since local community centers for children give priority to vulnerable children that meet all the requirements of age, income, and household characteristics, while assigning the rest to general children. But considering that these community centers provide comprehensive care of adults as an alternative to the care deficit of parents after school in addition to providing academic support, it is necessary to expand the scope of users of these community centers to general children. It may be a social prejudice to think that only children in the low-income group will use the community centers based on the social stigma. These centers provide educational services that help increase scholastic achievements for children in the middle- income group and have different official and unofficial qualifications for users. In addition, due to the social stigma, there is a social prejudice that ordinary children will not use these centers. However, for children in the early grades of the middle-income group, the more important reason for choosing an educational service is the comprehensive care by adults to fill the care deficit of parents rather than the awareness of the stigma. Using educational services accompanied by various learning contents and adult care may lead to improved academic performance. However, for children in the upper grades of elementary school or middle school students, the awareness of the stigma may have a greater impact than comprehensive care of adults, which may lead to different effects. Moreover, children showing low academic performance among those in the middle-income group were limited in terms of institute cost, visiting cost, and after-school cost, and thus were affected in terms of limited investments in education.
Fourth, children in the high-income group were not limited in terms of institute cost as well as the after-school cost, although their after-school time was limited. On the other hand, children with short institute time showed low academic performance. Children in the high-income group focused more on private education than public even when they were in the early grades, and they were not restricted in terms of cost but only restricted in time. Thus, they focused more on quality than quantity, which showed adequate effects. This is contrary to education among children in the low-income group that approached education more in terms of quantity than quality. In other words, this does not indicate a linear relevance between simple capital investment and immediate scholastic achievements, but a relevance between high capital investment and long-term attitude toward academic performance (Bourdieu, 1986). Furthermore, higher household income led to more educationally appropriate and sufficient investments in education.
Meanwhile, children with low academic performance in the middle-income and low-income groups were limited in terms of education cost, which naturally implied that household income affects children’s higher education and future income, which will lead to social reproduction (Bourdieu, 1986). In particular, considering that children in the early grades of elementary school are forced to choose the educational services based on parental choice and the financial environment of the family rather than their own realization or interest, high-income families made active choices in using educational services for children by comparing the conformance with the children or the effect, whereas low-income families made passive choices with barely any options. In this sense, children are put in either a more advantageous or disadvantageous position depending on their parents’ human capital in spite of themselves, although it may not lead to immediate academic performance. Meanwhile, since the initial stage of childhood is more flexible to change compared to later stages, and private education is mentioned as a key variable of scholastic achievements after middle school (Lee and Jung, 2013), using educational services in the early school age has significance in internalizing academic achievement that must be made by accumulating the habitus related to learning. Therefore, children’s use of educational services must be fairer because it not only is relevant to the current academic performance but also directly leads to equity in terms of career choices or lifelong development in the future.
The policy suggestions based on the results of this study are as follows.
First, despite the lower utilization of private education service among children in the low-income group compared to other groups, they showed high academic performance. By focusing on this fact, it is necessary to not only diversify public education services but also improve the quality for children in the low-income group. This is also related to fairness in options for educational services.
Second, with focus on the fact that use of local community centers for children is also significant for children in the middle-income group, it is necessary to expand the standard for using the community centers, which is currently limited. In particular, it must be noted that not drawing a line between poor and non-poor children is more beneficial for not just children in low-income families but also all children’s academic performance. Since the main role of these community centers is to provide opportunities for children’s emotional stability and physical development as well as intellectual development through various programs such as after-school care, they are also related to the academic performance of children in the early grades.
Third, with the fundamental policy goal of equally developing children’s academic performance regardless of parents’ socioeconomic status, it is necessary to improve customized services to develop academic performance in each income group. At the same time, all children must be able to actively use the educational services they prefer or services to improve academic performance regardless of parental income, whether it is private or public education. In the current system, there are limited educational services for children in the middle-income and low-income groups to choose from, which may have kept them from trying the right services for them. Therefore, it is necessary to establish institutional measures for children in the middle-income and low-income groups to freely choose the educational service and institution suitable for their characteristics and development. At the same time, it has been proved that the link of educational services to children’s scholastic achievements is formed by parents’ time and investment costs. Accordingly, there must be a management system to reduce the disadvantages in the quantity and quality of education and information due to lack of investments in education and time among parents in the middle-income and low-income groups compared to those in the high-income group and to guide children to educational services in general based on their characteristics to effectively improve academic performance. Efforts must be made to reduce the quantitative and qualitative gaps in educational services arising from parents’ socioeconomic status by assigning experts to manage academic performance.