Basic Research for the Development of a Vegetation Biofilter Operation Algorithm in a Subway Station
Article information

Abstract
Background and objective
We measured the particulate matter (PM) reduction rate when the vegetation biofilter operated for 1 hour every 6 hours. As a result of data analysis, PM concentrations in the subway station showed a high correlation with the train stop duration depending on the service frequency of train operations, and the reduction rate was high in the section where PM concentrations as well as the change rates were high. Therefore, in order to maximize PM reduction using the biofilter, it is necessary to optimize the performance of the biofilter in various environments by designing an intelligent algorithm that takes the frequency of train operations into account.
Methods
We collected PM10 and PM2.5 data for 2 weeks in position 5 (POS5) and POS6. The multi-module vegetation biofilter was installed in POS6, whereas it was not in POS5. The average hourly data for PM concentrations were obtained, and the change in concentrations was analyzed every 24 hours.
Results
PM in subway stations is known to spread from the tracks to waiting areas as the train moves. Therefore, the change in PM concentrations by time zone has a high correlation of about 0.8 with the sum of the stop duration depending on the frequency of train operations. The vegetation biofilter is operated 4 times a day for 1 hour every 6 hours. The reduction rate reached up to 30% in 6–8 hours, where the PM concentrations increased sharply.
Conclusion
We came up with an algorithm to maximize the PM reduction effect by identifying the effect using the vegetation biofilter as a means for air purification in public use facilities such as subway stations. To this end, there is a need for a method that can dynamically select the section where the PM concentrations increase rapidly and set the biofilter operation time.
Introduction
Due to the impact of transboundary air pollutants from China and the limited management of the sources of pre-cursor emissions in Korea that generates fine particulate matter, the issues of particulate matter (PM) are not being resolved. Since the enactment of the Special Act on the Reduction and Management of Fine Dust in 2018, the government has established the Mid-/Long-term Comprehensive Plan on Fine Dust Management led by the Special Policy Committee on Fine Dust under the Prime Minister in 2019 and has since been implementing seasonal management from December to March every year (Sin, 2020). In Seoul, the number of times in which the fine dust advisory has been issued increased every year from once in 2013 to 6 times in 2017. In February 2019, the Ministry of Environment enacted the Special Act on the Reduction and Management of Fine Dust, implementing emergency reduction measures for PM when the average PM2.5 concentration exceeds 50 μg/m3 in the capital regions and the 24-hour average concentration is expected to exceed 50 μg/m3 the next day.
In 2017, the Ministry of Environment reported the self-measurement results of high PM10 concentrations in public use facilities such as indoor parking lots and subway stations (Kim, 2018). Subway stations showed low utilization rate due to obsolete air conditioning systems, and thus the PM10 concentration in Lines 1–4 was 87.8 μg/m3 on average in 2017, which is higher than the local average at 58.7 μg/m3. The operation of urban transit vehicles is the main cause of tunnel air pollution. Kim et al. (2018) investigated the wind velocity and particle concentration at the bottom of the vehicles using a 3D ultrasonic anemometer and particle counter to obtain the design conditions of dust collectors that reduce the generated PM. PM concentration in subway stations varies depending on the movement characteristics of PM, and it is highest in the main tunnel, followed by the platform and waiting area (Park et al., 2010). For PM generated in the tunnel, the PSD (platform screen door) can be applied to reduce the diffusion within the subway station. A study that examined the scope of PM10 and PM2.5 concentrations depending on the application of PSDs (Sohn et al., 2009) proved the necessity of PSDs in subway stations, inducing all stations to install them.
The increasing interest in indoor air quality is generating environment-friendly social demand for air purification methods. Air purifying plants are the most common environment-friendly air purification method, but these plants reduce PM mostly through adsorption (Sæbø et al., 2012). Continuous PM reduction with plants requires cleaning (Wang and Zhang, 2011). Studies are conducted on vegetation biofilters that enhance such limited PM removal efficiency of air purifying plants in association with air conditioning facilities. PM removal efficiency is generated when passing through the vegetation biofilter, which is quantified as SPRE (single pass removal efficiency) and applied to the vegetation biofilter and affects filtration efficiency (Irga et al., 2017). By evaluating PM reduction performance among plant species planted on vegetation biofilters, it was also discovered that certain plant species with developed root zones showed effective reduction of PM0.3-0.5 and PM5-10 (Pettit et al., 2017). Moreover, another study revealed that vegetation biofilters effectively remove iron oxides in PM generated in subway stations and can reduce human health hazards caused by transition metals (Kim et al., 2021).
An efficient operation algorithm is needed to apply vegetation biofilters, which is an environment-friendly reduction technology, to PM in subway stations, and the changes of PM in different time zones can be used to identify the correlation between movement and PM concentration. There was a study that built big data on 1,100 households, measured the indoor PM changes depending on the presence of air cleaners, and examined the smart care system to maintain optimum air quality depending on the classification of indoor air quality (Lee, 2017). Another study divided subway operations into weekdays and weekends and conducted a correlation analysis on the diffusion of PM in the main tunnel to the platform and waiting area (Park et al., 2010).
This study analyzed the effect of vegetation biofilters on improvement of indoor air quality in subway stations where high levels of PM are generated among public use facilities and determined the correlation between the Indoor Environmental Index, train stop and departure duration, based on which it examined the algorithm for effective operation of vegetation biofilters.
Research Methods
Study area
Considering the representativeness of Seoul Metropolitan Subway and frequency of use, this study selected Line 3 Gyeongbokgung Station under jurisdiction of Seoul Metro as the study area. This station is ranked 49th and is within the top 15% in the average daily number of users, with 51,267 passengers a day among 275 subway stations in the capital regions as of 2018 (Confidential Document, 2021). Gyeongbokgung Station is comprised of three stories underground with the total ground area of 12,214 m2, and the first floor is used as a permanent exhibition space. The waiting area on the second basement level where the gates are located in Gyeongbokgung Station was selected as the study area. There were total three spots with gates, each of which were connected to the train platform with stairs or escalators. A multi-module vegetation biofilter was installed on position 5 (POS5) and POS6 (Fig. 2) where the transient population is concentrated and is directly connected to Gyeongbokgung Palace, which is a major tourist spot, out of total 6 IAQ station areas selected by a previous study (Kim et al., 2021).

Installation location and intake direction of IAQ station (POS5 and POS6).
Multi-module vegetation biofilter system
The multi-module vegetation biofilter system used in this study divided 4 vegetation biofilter modules with vegetation planted into 494 × 933 mm return air (RA) sections and 4 modules with only filters attached into 494 × 300 mm supply air (SA) sections. The unit panel is a multilayered vertical hydroponic structure with three layers of 50 mm filters, and 48 air purifying plants such as Ficus elastica, Epipremnum aureum, and Dracaena fragrans var. massangeana selected in a previous study (Kim et al., 2018) were planted. The watering part was prepared at the bottom of the biofilter, connecting the manual control part at the top so that the irrigation water is supplied according to the irrigation cycle at the top of the panel with a pump from the storage tank.
Total 4 ventilation fans were installed in each unit module, and the individual fans had low-noise EC motors (single phase/220 V, 2,510 rpm, 0.17 kW) with air conditioning performance of maximum 800 m3/h, static pressure 380 Pa. Contaminated air is inhaled with the RA at the bottom through the fans, and purified air is supplied through the SA at the top. The average air volume supplied through SA was 380.86 CMH. To secure adequate photosynthetic environment for vegetation applied to the multi-module vegetation biofilter, the artificial light was set to the range of PPFD 30–100 μmol/m2, and the LED was inserted below the top of the structure to provide the necessary amount of light (Fig. 1). The operating time for LED, fans, and pumps installed on the multi-module vegetation biofilter system is summarized as follows. LED for growth of vegetation was set to be operated for total 16 hours, pumps to supply irrigation water for total 8 hours (2 hours each), and fans to inhale contaminated air through RA for total 4 hours (1 hour each) (Table 1).

Multi-module vegetation biofilter and working drawings.

Timetable of multi-module vegetation biofilter system
Experimental design
To monitor the time series change of PM according to the operation of the multi-module vegetation biofilter, we collected the environmental data in POS5 and POS6 where the system is constructed out of 6 distributed IAQ stations (Smart Aircok, Aircok) installed in the study area in advance. The data collected were PM2.5, PM10, temperature, and relative humidity, and sensors with the following specifications were used (Table 2).

Sensor specifications for indoor air quality stations
The LTE method was adopted for communication instead of WIFI that may cause errors in transmitting and receiving data, and real-time monitoring service based on mobile/web was provided, as well as the air quality improvement solution through automatic control aligned with the air conditioning facilities. Data were corrected for at least 7 days in a similar environment as the particle counter (AM520, TSI), and the equipment was built on site after reviewing the sensor measurement reliability. To verify the PM reduction effect of the mock-up of the multi-module vegetation biofilter system, we created a monitoring environment to collect real-time environmental data at POS5 located within the area of the system and POS6 installed at a 0.5 m distance from the front of the mock-up. We monitored the locations for total 2 weeks from March 23 to April 5, 2021, 3 months after the multi-module vegetation biofilter is stabilized from November 26, 2020 when the system was built. The intake port direction of IAQ station was set as the place where scattering dust can be flowing in due to traffic. The intake port of POS5 was fixed toward the direction of the gate, and the intake port of POS6 was adjusted to face the front of the multi-module vegetation biofilter (Fig. 2). The train stop and departure time information during that period was provided by Seoul Metro.
Results and Discussion
Temperature and relative humidity analysis
Changes in temperature and humidity in 2 weeks of monitoring are summarized as the 24-hour time series change (Fig. 3). Relative humidity was highest (51–52%) at 6–8 a.m. for both POS5 and POS6, and lowest (45%) at 3–4 p.m. The section with highest relative humidity overlapped with the vegetation biofilter activation time, which was also found in the activation time at 12–13 and 18–19 hours with a clear change due to operation and stop (6–8 hours: 0.65%, 12–13 hours: 1%, 18–19 hours: 1% increase). The temperature was lowest (17°C) at 6 hours for both POS5 and POS6, and highest at 17–18 hours. The temperature at POS6 was about 0.5 °C higher than that at POS5, which is due to the seasonal factor in which there is not much difference in the absolute value of daily temperature and humidity.
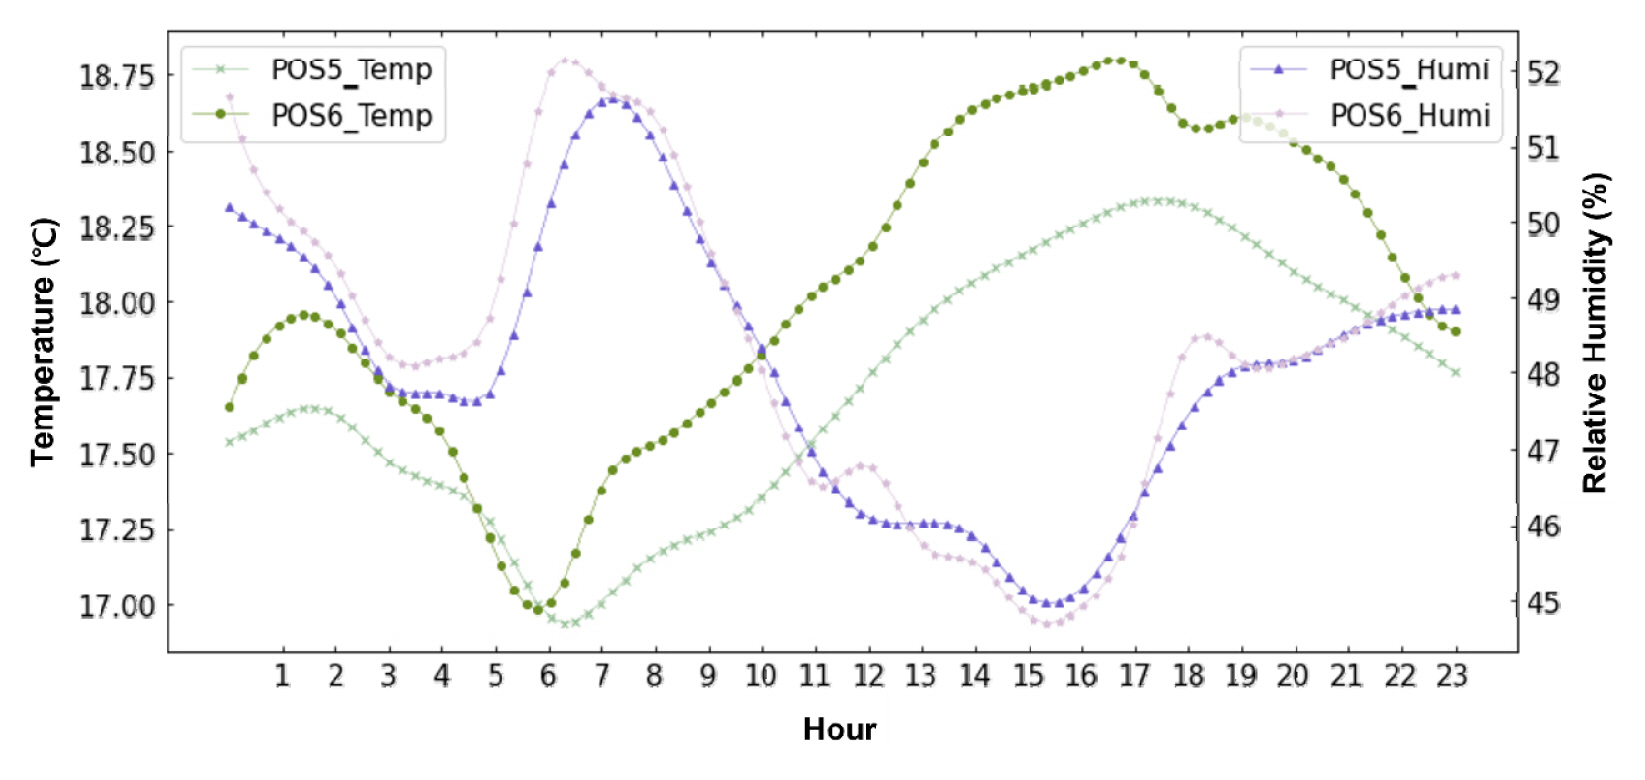
Average value monitoring of temperature and relative humidity according to application (POS6) or non-application (POS5) of multi-module vegetation biofilter.
Subway arrival and departure frequency analysis
The hours when subways pass through the most were 7–9 and 17–20 hours that are rush hours on weekdays, during which an hourly average of 27.43 subways pass through Gyeongbokgung Station. The time when the subway stops at the platform and the platform screen doors (PSDs) open as well as the fluctuations of PM concentrations within the station are as follows (Fig. 4). PM10 and PM2.5 concentrations measured at POS5 and POS6 were highest at 7–9 and 19–20 hours. There is a significant trend in the time when the subway stopped at the platform and PM concentration. Particulate matter generated in the main tunnel when the subway stops affects even the waiting area where POS5 and POS6 are installed.
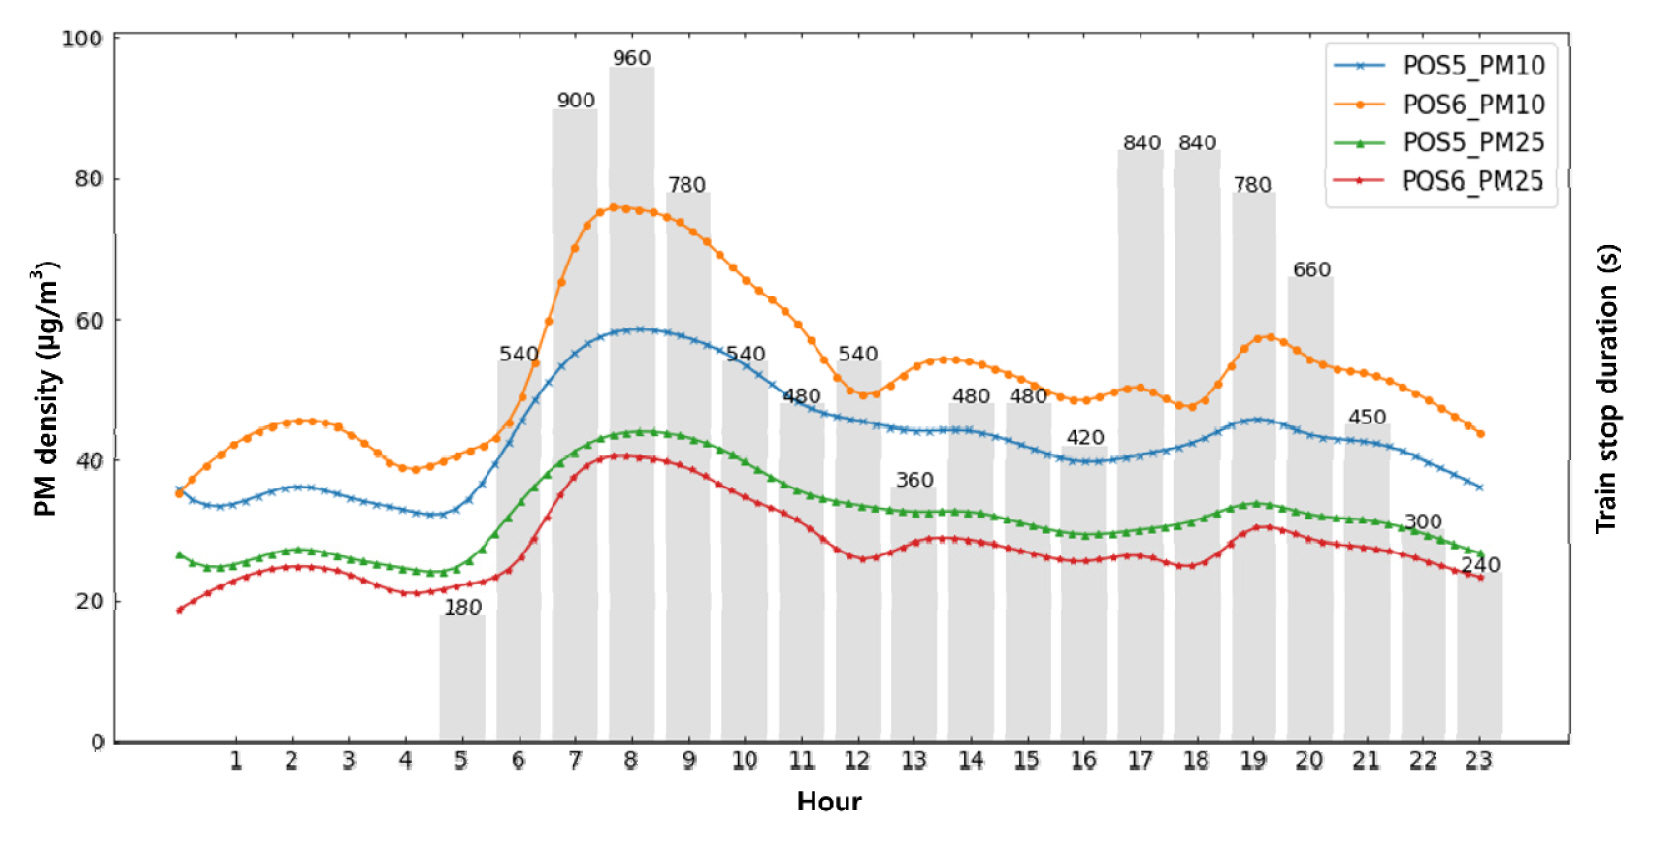
Average concentration monitoring of particulate matter (PM10 and PM2.5) according to application (POS6) or non-application (POS5) of multi-module vegetation biofilter.
Comparative time-series analysis of PM10
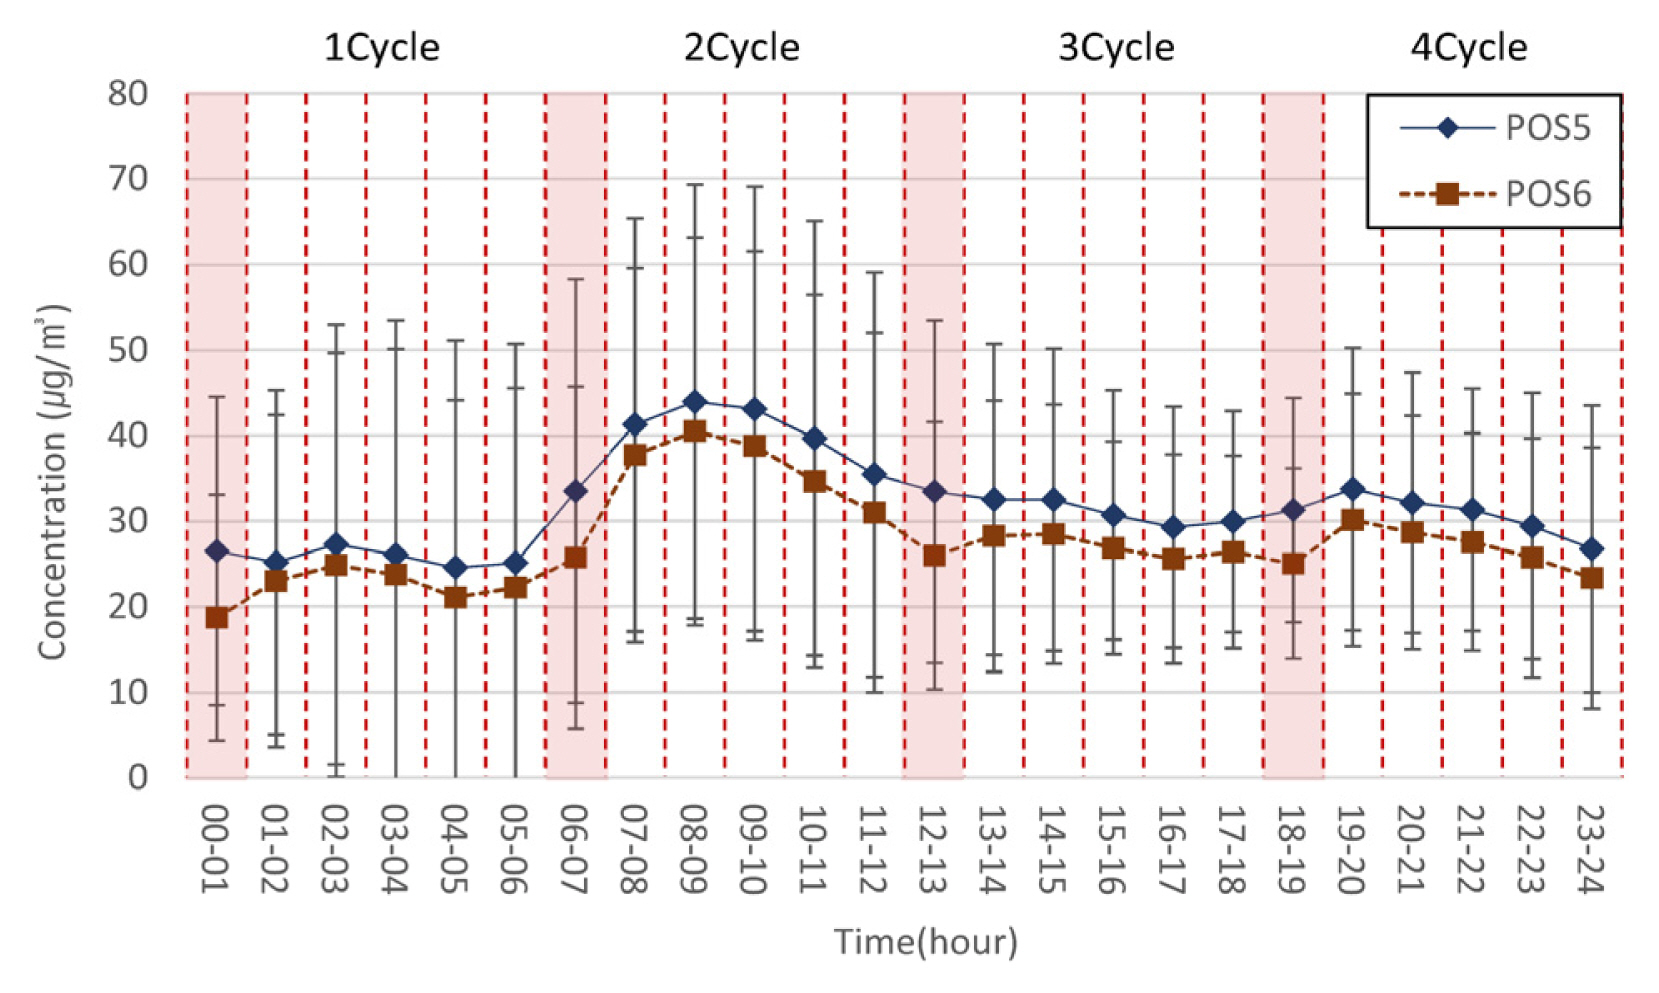
We divided the cycles based on the driving time of fans operating for 1 hour, 4 times a day, to examine the average daily time series change of PM10 measurement data for 2 weeks after building the multi-module vegetation biofilter system (Fig. 5). The average PM10 concentration of POS5 was 42.2 μg/m3 when the fans of the multi-module system were being driven, and 43.0 μg/m3 when they were not, showing a 1.9% PM reduction. On the other hand, average PM10 concentration of POS6 was 45.1 μg/m3 when the fans of the multi-module system were being driven, and 53.4 μg/m3 when they were not, showing a 15.5% PM reduction (Table 3). For the reduction rate of PM concentration in each cycle, the reduction rate of POS5 ranged from −4.9% to 17.4%, and that of POS6 from 1.9% to 30.1% (Table 4). POS6 where the multi-module system is installed showed a remarkably high PM reduction rate.

Average concentration monitoring of particulate matter (PM10) according to application (POS6) or non-application (POS5) of multi-module vegetation biofilter.
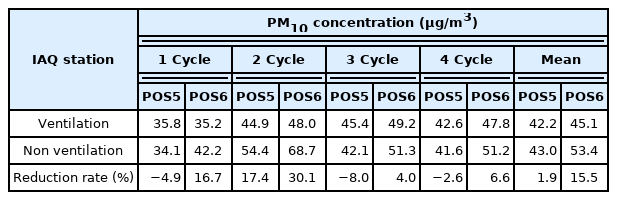
Average concentration of particulate matter (PM10) according to application (POS6) or non-application (POS5) of multi-module vegetation biofilter
Average concentration of particulate matter (PM2.5) according to application (POS6) or non-application (POS5) of multi-module vegetation biofilter
Comparative time-series analysis of PM2.5
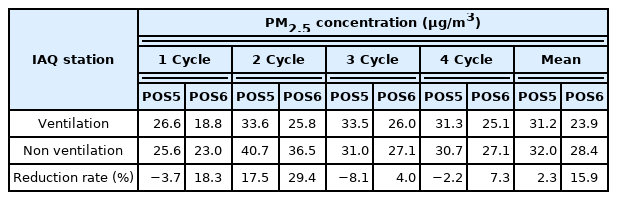
We divided the cycles based on the driving time of fans operating for 1 hour, 4 times a day, to examine the average daily time series change of PM2.5 measurement data for 2 weeks after building the multi-module vegetation biofilter system (Fig. 6). The average PM2.5 concentration of POS5 was 31.2 μg/m3 when the fans of the multi-module system were being driven, and 32.0 μg/m3 when they were not, showing a 2.3% PM reduction. On the other hand, average PM2.5 concentration of POS6 was 23.9 μg/m3 when the fans of the multi-module system were being driven, and 28.4 μg/m3 when they were not, showing a 15.9% PM reduction. For the reduction rate of PM concentration in each cycle, the reduction rate of POS5 ranged from −8.1% to 17.5%, and that of POS6 from 4.0% to 29.4% (Table 5). Also for PM2.5, POS6 where the multi-module system is installed showed a remarkably high PM reduction rate.
Average concentration monitoring of particulate matter (PM2.5) according to application (POS6) or non-application (POS5) of multi-module vegetation biofilter.
Correlation analysis between particulate matter (PM10, PM2.5) and train stop duration
PM correlation analysis for each variable compared to train stop duration
Temperature, relative humidity
The results of analyzing temperature and relative humidity among factors affecting the correlation of PM (PM10, PM2.5) depending on train stop duration are as follows (Fig. 7). The temperature of POS5 had a negative correlation (average −0.287) for PM10 and PM2.5 of both POS5 and POS6, and the relative humidity of POS5 had a positive correlation (average 0.283) for PM10 and PM2.5 of POS5 and POS6. On the other hand, the temperature and relative humidity of POS6 did not show a significant correlation. Therefore, PM (PM10, PM2.5) tends to increase when there is higher humidity and lower temperature around POS5. Moreover, the correlation coefficient of temperature and relative humidity for PM (PM10, PM2.5) in POS6 is low because POS6 is installed in front of the biofilter, showing a different temperature and humidity distribution compared to the gate area where POS5 is installed.
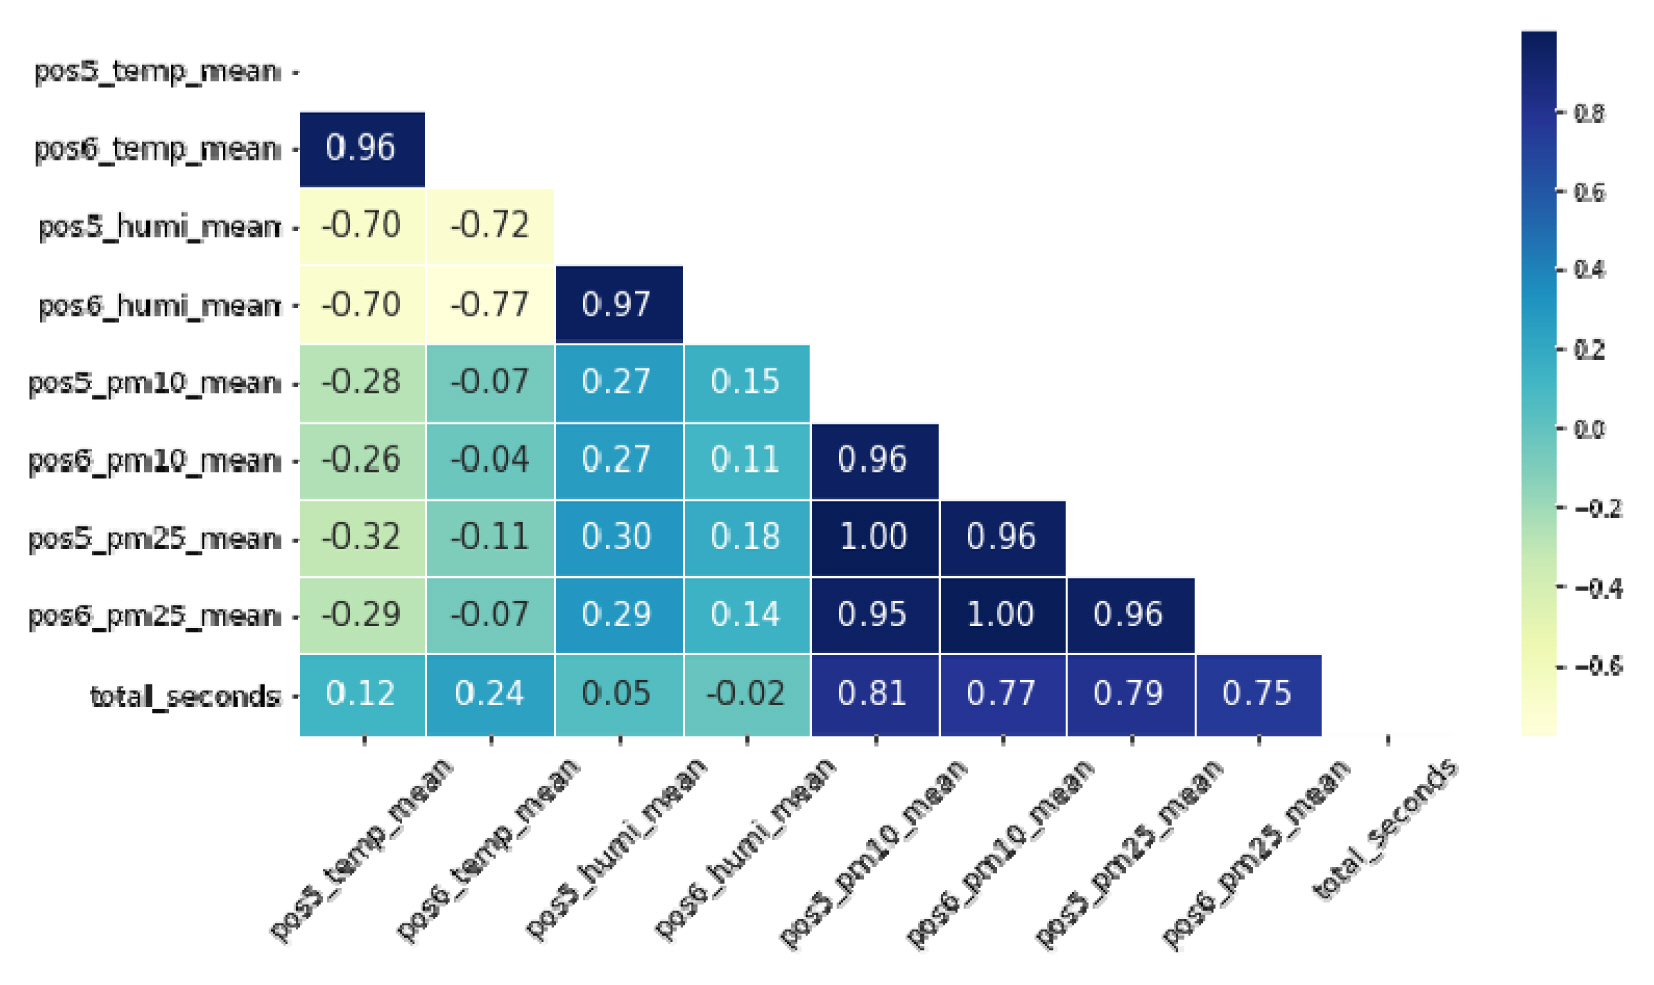
Correlation analysis between temperature, relative humidity, particulate matter (PM10 and PM2.5) and train stop duration (total_seconds).
Operation status of the multi-module vegetation biofilter
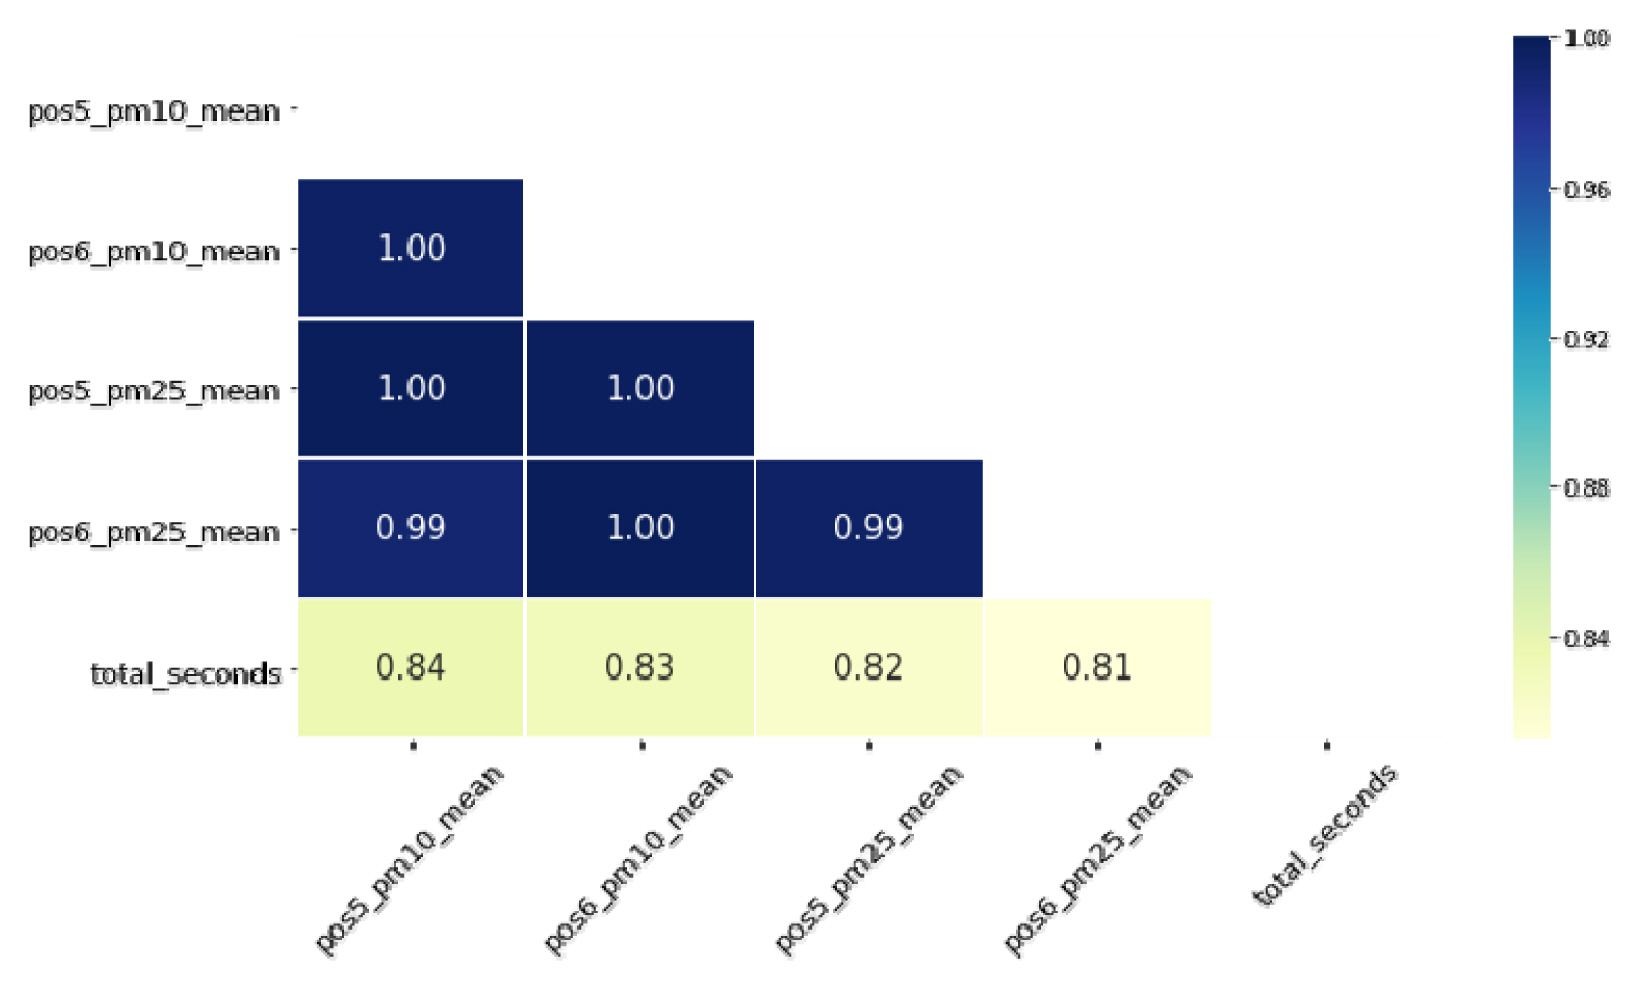
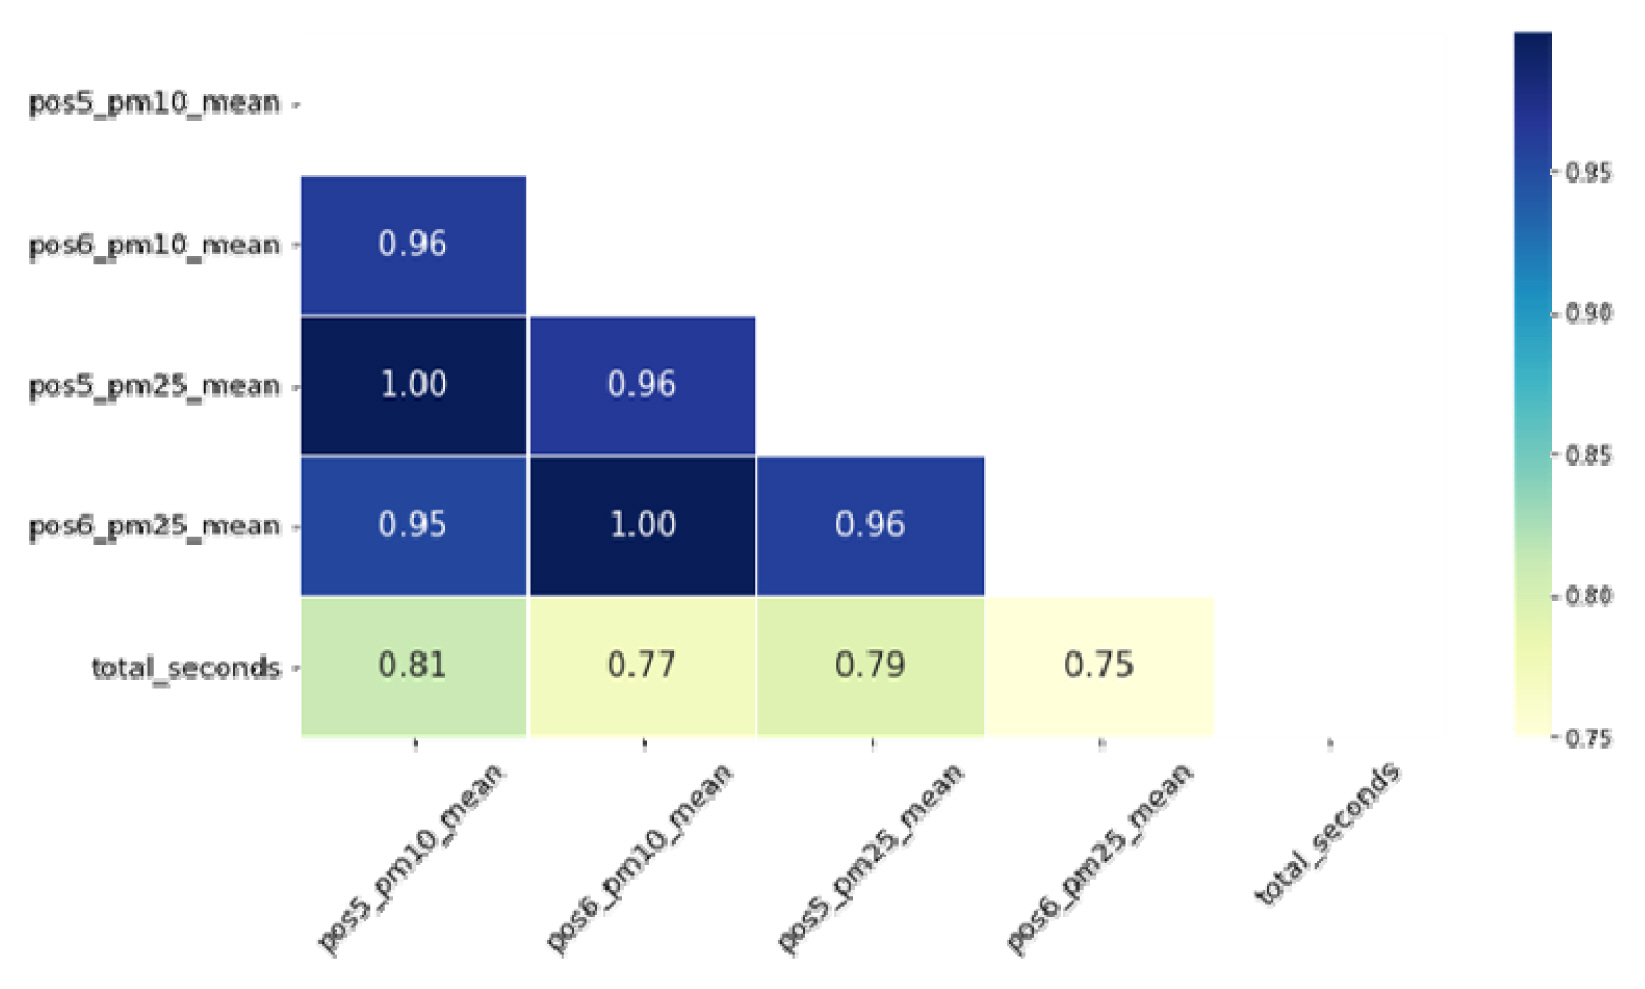
The time series change of PM concentrations generated in each type of space within the subway station is due to the distance from the main tunnel (Park et al., 2010). It is necessary to review the correlation of the operation of the multi-module vegetation biofilter with PM reduction. The following shows the correlation analysis between PM (PM10, PM2.5) concentrations of POS5 and POS6 and train stop duration when the multi-module system is not operated (Fig. 8).
Correlation analysis between particulate matter (PM10 and PM2.5) and train stop duration (total_seconds) while multi-module vegetation biofilter was not operated.
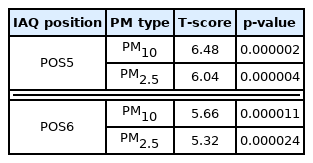
In the period when the multi-module system is not operated, the correlation coefficient of PM10 and PM2.5 for POS5 was 0.01 higher than POS6. The correlation of PM10 and PM2.5 with the time when the train stopped at the platform was PM10 (0.81) and PM2.5 (0.79) for POS6 close to the platform, and PM10 (0.77) and PM2.5 (0.75) for POS5 that is the gate area with more distance from the platform, thereby showing lower correlation than POS6. Moreover, PM10 showed relatively higher correlation than PM2.5, and statistically significant results were derived through T-score and p-value (Table 5).
The correlation coefficient of PM10 and PM2.5 for POS5 when the multi-module system was operated showed a slight difference of 0.03 than when the system was not operated, whereas the correlation coefficient of PM10 and PM2.5 for POS6 showed a difference of 0.06. This is because PM10 and PM2.5 concentrations of POS6 decrease more significantly than POS5 due to the active reduction of PM when the multi-module system is operated (Fig. 9).
Correlation analysis between particulate matter (PM10 and PM2.5), train stop duration (total_seconds) and operation of multi module vegetation biofilter.
The correlation coefficients of train stop duration and PM10 and PM2.5 depending on the operation status of the multi-module system are summarized as follows (Table 6). There was a significant correlation change due to the operation of the system, which can be interpreted as the change in PM concentrations. POS6 showed lower correlation coefficients, showing about twice more difference than POS5. In other words, PM10 and PM2.5 concentrations that increase along with the train stop duration decrease more quickly in POS6 where the multi-module system is installed, thereby showing twice more difference in the correlation coefficients compared to POS5.

Difference in correlation coefficient between particulate matter (PM10 and PM2.5) and train stop duration according to operation or not operation of multi module vegetation biofilter
Pseudocode of the vegetation biofilter operation algorithm
To maximize the PM reduction capacity of the biofilter (BFC), it is necessary to increase the area of the biofilter or the operation time. However, increasing the area of the biofilter requires more costs as well as physical space, and increasing the operation time requires greater energy consumption. Moreover, increasing the operation time to 24 hours does not necessarily maximize the PM reduction rate.
The more PM increases and the higher the PM concentrations get, the reduction rate of biofilters reaches up to 30%, whereas the reduction rate when the PM decreases is 5.4% on average, showing a huge difference. Therefore, the operation of biofilters must be concentrated when PM concentrations are increasing and maintained. The factor that has the biggest effect on the increase of PM concentrations is the stop duration according to the train service frequency. Thus, biofilters can be operated more effectively by finding the period in which train service is concentrated. To optimize the operation of biofilters, it is most important to choose the operation hour for biofilters, which is referred to as BFOH (biofilter operation hour). The pseudocode of the algorithm to choose BFOH is as follows.
The cumulative train stop hours for each section (time zone) in Lines 2–5 are calculated, and the rate of change in DTSD is also calculated and saved on the DTSD list. BFOHS in Line 6 is a flag array representing true or false of the operation of the biofilter in each time zone. Sorted_DTSD, which is the descending order of DTSD in Lines 7–8, and Sorted_DTSD_Hour with visual information are obtained. MAX_BFOC in Lines 11–13 refers to the number of times the biofilter is operated. The value of the BFOHS array with the time pointed by the kth index of Sorted_DTSD_Hour (the time when the change rate of PM concentration is kth highest) as the index is set as True so that the biofilter can be operated at that hour. DIFF_THRESHOLD in Lines 14–17 refers to the threshold of the change rate of PM concentrations. When the difference between the kth DTSD in descending order and the DTSD in the hour after the hour pointed by k is higher than DIFF_THRESHOLD, BFOHS[Sorted_DTSD_Hour[k] + 1] is set as True so that the operation of the biofilter can continue in the next hour. The loop is escaped when the number of elements set as True in the BFOHS list is equal to MAX_BFOC, and the slots designated as True here represent the operation section of the biofilter to optimize the PM reduction rate (Table 7).

Pseudo code of algorithm for operation of multi-module vegetation biofilter
Conclusion
By integrating and analyzing the PM data and subway service frequency collected in the area where the biofilter is installed and the area where it is not, we can verify that the subway service frequency and stop duration are closely related to the increase of PM concentrations in a subway station, and the operation of a biofilter inhibits the increase of PM10 and PM2.5 concentrations. Based on the results, it will be possible to design the operation algorithm to preemptively operate biofilters before and after the time when subways are running frequently, through which air quality inside subway stations can be improved by effectively reducing PM.
This study derived the algorithm for efficient operation of a multi-module vegetation biofilter in a major subway station in Seoul. We measured the changes of PM concentrations in the subway station and analyzed the correlation with the stop duration according to the train service frequency. Moreover, by comparatively analyzing the difference in the reduction rate between the operation and non-operation of the biofilter, we could discover that it is most important to choose the time in which the biofilter is operated in order to maximize the PM reduction effect. Based on this fact, we could come up with an algorithm to maximize the PM reduction effect of biofilters by automatically selecting the biofilter operation hour, which enables operation of biofilters in a dynamic method as well as energy-efficient operation for PM reduction.
Notes
This research was funded by a 2021 research Grant from Sangmyung University.