Monitoring the phenology of Forsythia velutina, an endemic plant of Korea
Article information

Abstract
Background and objective
This study was conducted on Forsythia velutina, a special plant, in Gyeongsangnam-do Arboretum under the Gyeongsangnam-do Forest Environment Research Institute, which is located in the southern part of Korea.
Methods
The research aimed to analyze the flowering characteristics of the plant by calculating the optimal temperature and humidity according to the flowering time and flowering period for 8 years from 2010 to 2017 in order to provide basic data for bioclimate studies of endemic plants.
Results
It was observed that the Forsythia velutina showed a life cycle from mid-March and to mid-November. Average growth period was 243 (± 6.5) days. In testing the reliability of a single variable according to the meteorological factors, the Cronbach’s Alpha was 0.701, which indicates that the findings were relatively reliable. The average date of flowering was March 16 (SD = 5.8) and the average date on which blossoms fall was March 29 (SD = 5.2). A substantial difference in flowering period was observed from year to year 11 to 23 days, with an average of 16 days (± 4.7). The temperature and humidity in February to March, which affect the flowering, were 2.9–5.5°C, and 66.5–73.0%, respectively, and showed differences every year.
Conclusion
The correlation between flowering time and meteorological factors was positive, and the highest daily temperature and average daily temperature had the highest significance. When establishing basic data on plant species for the conservation of endemic plants, the changes in life cycle events and weather conditions are identified. It is believed that it will be helpful in establishing a conservation strategy for the plant species in the future.
Introduction
One of the most obvious and visible responses to recent climate change is changes in phenological phenomena (Post and Strenseth, 1999; Hughes, 2000; Penuelas and Felella, 2001; Walther et al., 2002; Menzel, 2003; Gordo and Sanz, 2005; Menzel et al., 2006; Doi and Katano, 2008). Despite some conflicting findings, long-term observations of phenological phenomena provide remarkable evidence for the advancement of the timing of several seasonal biological events (Parmesan and Yohe, 2003). The consistency of this pattern can be seen in that plant growth and flowering dates are being advanced in terms of phenology. Menzel (2000) observed the change trend of plants in the International Phenological Gardens (IPG) located in Europe for about 40 years from 1926 to 1966, and found that the germination, flowering and leaf opening times in spring were 2.1 days earlier on average per 10 years. Beaubien and Freeland (2000) analyzed changes in the flowering period of chokecherry (Prunus virginiana) from 1963 to 1996 in Edmonton, Canada, and confirmed that the period was moving earlier by an average of 1.3 days per decade. In addition, Chmielewski et al. (2004) showed that the temperature increased by 1.4°C in Germany during the 40 years from 1961 to 2000, and the average temperature from February to April was a major indicator of the annual change in seasonal phenological events. According to their study, when the average temperature increased by 1°C during February-April, the flowering time of trees was advanced by five days. In South Korea, monitoring research on phenological traits is also being actively conducted by selecting climate-sensitive biological indicator species (CBIS). Lee and Lee (2003) reported that the average annual temperature of Seoul increased by 1.0–1.5°C in the 1990s compared to the 1960s and 1970s; and the flowering time was advanced by 10 days for forsythia, 5–8 days for Prunus yedoensis Matsumura and Prunus persica (L.) Batsch, and 3 days for Robinia pseudoacacia L over the 40 years from 1961 to 2000. In other words, the earlier the plants bloomed in spring, the more distinct the changes were. They also reported that as the winter temperature increases by 1°C, the flowering time for each species will move earlier by 10 days. As such, the life cycle events of plants that occur according to seasonal changes are determined not only by time changes but also by various environmental factors. Environmental factors that can affect the flowering time of plants include moisture, temperature, and light, which have been reported to be particularly sensitive to spring and winter temperatures (Lee and Ho, 2003; Chmielewski et al., 2004).
Forsythia velutina, the subject of this study, is one of the climate-sensitive biological indicator species (CBIS) among forest species vulnerable to climate change, and is mainly distributed in northern regions. It is also a valuable genetic resource that can only be found in Korea, which has adapted and evolved in the natural environment of the Korean Peninsula (Korea Forest Service. 2010). Forsythia velutina was selected for this study since no research on its phenological phenomena has been carried out so far. As such, the purpose of this study is to provide basic data for evaluating the impact of climate change on the seasonal timing of life cycle events of plants by monitoring, predicting, and managing such phenological changes in advance.
Research Methods
Survey Site Overview
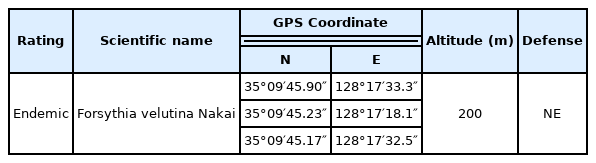
The survey site of this study was Gyeongsangnam-do Arboretum under the Gyeongsangnam-do Forest Environment Research Institute (N 35° 09′45.7″, E 128° 17′46.4″) located in Daecheon-ri, Ibanseong-myeon, Jinju, in which about 1,754 species and 110,000 plants have been collected and planted, with a focus on plants from subtropical and southern temperate regions (Gyeongsangnam-do Forest Environment Research Institute). The arboretum includes exhibition gardens with a range of themes, such as Botanical Garden, Specialized Garden, Aquatic Botanical Garden, and Mugunghwa Park, providing a space for direct observation and learning about plants. Topographically, it consists of hilly areas with a low elevation of around 200 to 300 m, and relatively wide valleys and ponds between them (Fig. 1).

The location of research plants in Gyeongsangnam-do Arboretum.
Meteorological Changes
Gyeongsangnam-do Arboretum is adjacent to the sea in the south and as such is affected by the marine climate, and is located between Naknambaek and Baekdudaegan in the northwest. Such topographical features protect the arboretum region from cold northwesterly winds in winter, giving it a temperate climate. In addition, the amount of rainfall was slightly higher than the Korean average. Meteorological observations were performed with Hobo sensors for temperature and humidity measurements (TMB-M006) by putting them in a temporary instrument shelter (RS3). For auxiliary measurements, temperature and humidity were measured by installing the U23 series of temperature and humidity sensors (N 35° 09′40.80″, E 128° 17′45.3″). As for meteorological data, micro-weather data such as monthly average temperature, daily average temperature, monthly average relative humidity and daily average relative humidity were collected and investigated from January 2010 to December 2017.
Selection of Indicator Plant Species Related to Climate Change
The classification of rare plants was referenced from the data of the Korea National Arboretum (2009) and the Ministry of Environment (2006). Forsythia velutina was selected as an indicator plant species and monitored for 8 years from 2010 to 2017 (Table 1). Forsythia velutina is a valuable genetic resource and endemic plant that exists only in Korea, distributed mainly in the northern regions among forest species vulnerable to climate change, and has adapted and evolved in the natural environment of the Korean Peninsula. The coordinates of three Forsythia velutina were marked using GPS (Oregon 550, Garmin, USA), and the times of flowering, fallen blossoms, budburst, leaf unfolding, fall foliage (fall colors) and leaf abscission were calculated and recorded as average values. The survey was conducted once a week from the beginning of March 2010 to the end of October 2017, and every other week in July and August. In terms of monitoring criteria of the indicator plants, when more than 20% of flowers on the stalk were in bloom, it was considered to be the start of flowering; when more than 80% of the flowers on the stalk were in bloom, it was considered the time of full bloom. The flowering period was surveyed as the period from the start of flowering to when all the flowers on the stalk have fallen off or the petals have turned brown. The leaf unfolding period was considered as the early unfolding period when a leaf-like appearance was observed in three or more places. The period of fall foliage was considered as beginning when three or more colored leaves were observed among all the leaves, and at this time the total was calculated and recorded as a percentage. The deciduous period was regarded as the start when leaf abscission was observed at three or more places, and was recorded as a percentage (Korea Forest Service, 2010).
Characteristics of Forsythia velutina habitat
For optimal temperature and humidity measurement, the average temperature and humidity for each period were calculated by comparing the data on phenological changes of Forsythia velutina monitored for 8 years. Changes in temperature and humidity for 20 days before and after the start of life cycle events such as flowering period were applied and analyzed.
Statistical Analysis
To determine the correlation between changes in the phenological period of the endemic plant Forsythia velutina and meteorological factors over 8 years, five variables were measured including daily average temperature, daily minimum temperature, daily maximum temperature, daily average relative humidity, and daily minimum relative humidity. Reliability analysis, univariate statistical analysis, and Pearson’s correlation analysis were performed on the collected data using SPSS ver. 20.0, a statistical software package. The statistical significance was tested at a 95% confidence level.
Results and Discussion
Phenology Monitoring
Forsythia velutina, reported as a plant endemic to Mt. Jangsu in Hwanghae Province, repeats its life cycle events starting with flowering in early spring and continuing to falling leaves in late autumn (Korea Forest Service, 2010). Through monitoring Forsythia velutina in Gyeongsangnam-do Arboretum, it was found that the plants showed a life cycle from the beginning of flowering in mid-March to the leaf abscission in mid-November, with an average growth period of 243 days (± 6.5). The timing of flowering was different every year, but the flowering period showed a consistent pattern from 11 to 23 days each year (Table 2). According to the analysis of the optimal temperature and humidity for the flowering period, the plants were found to flower when the average temperature and humidity were maintained at 6.6°C (± 0.5) and 70.9% (± 4.8), respectively. When the average temperature and humidity were measured as 11.4°C (± 0.6) and 73.9%(± 4.1), respectively, the period of fallen blossoms was observed.

Changes in temperature and humidity by physiological cycle of Forsythia velutina
On the other hand, the changes in Forsythia velutina were monitored as the flowering and fallen blossom times affected subsequent life cycle events. First, it was observed that the earliest time of budburst was March 14, 2013, and the latest time was April 2, 2010, a 20-day difference (Fig. 2). Based on the analysis of optimal temperature and humidity for the budburst period, the buds burst when the average temperature and humidity were maintained at 6. 4°C (± 0.2) and 72.8% (± 3.1), respectively. The earliest time of leaf unfolding was March 31, 2014, and the latest was observed on April 19, 2010, a difference of about 20 days, which is considered to be influenced by the budburst period. According to the analysis of optimal temperature and humidity for the leaf unfolding period, the leaves were unfolded when the average temperature and humidity were maintained at 11.3°C (± 0.9) and 72.0% (± 3.2), respectively. The fall foliage period was observed from the end of October to mid-November when the leaves fell. Although the time of fall foliage was different every year, the duration of fall foliage showed a certain pattern from 11 to 22 days each year. Based on the analysis of optimal temperature and humidity for the fall foliage period, the fall colors were be observed when the average temperature and humidity were maintained at 7.0°C (± 0.8) and 85.1% (± 3.1), respectively. When the average temperature and humidity were measured as 6.7°C (± 1.0) and 80.9% (± 5.5), respectively, the phenology of leaf abscission was observed (Table 2).

Seasonal changes of Forsythia velutina.
Statistical Results of a Single Variable According to Meteorological Factors
In the reliability test of a single variable for statistical variables, the Cronbach’s Alpha was 0.701, indicating relatively high reliability. On the other hand, the flowering period refers to the period from the beginning of flowering to the date of fallen blossoms, and the average flowering time of Forsythia velutina is in March, so the temperature and humidity were measured in February and March. It was reported that of the environmental factors that control flowering time, the temperature has the greatest influence (Brown, 1953). According to the meteorological data, the spring temperature showed a difference of 2.9–5.5°C every year, and the relative humidity was 66.5–73.0% (Table 3). The analysis of Forsythia velutina found that average flowering time was March 16 (SD = 5.8) and average fallen blossom time was March 29 (SD = 5.2). The flowering period ranged from 11–23 days, with an average of 16 days (± 4.7), showing a large difference each year, which is considered to be related to spring temperature and humidity changes (Table 3).
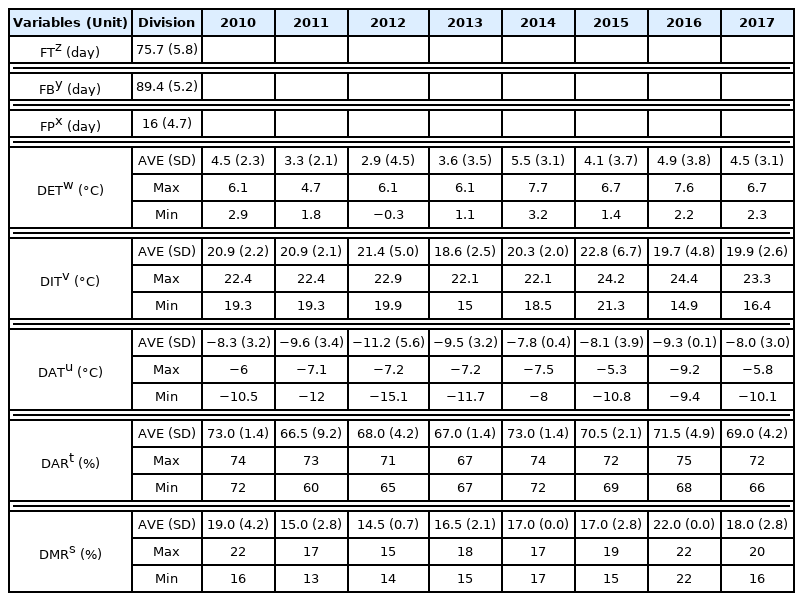
Temperature and humidity changes in phsyiological cycle of Forsythia velutina
Test of the Relationship between Two Variables according to Meteorological Factors
To analyze the simple correlation between flowering of Forsythia velutina and meteorological factors, Pearson’s correlation analysis was performed using SPSS Statistics ver. 20.0, and the results are summarized in Table 4. The spring temperature affects plant growth (Lechowicz, 1995), and is the factor that has the greatest influence on the flowering or leaf unfolding time (Chmielewski et al., 2004). Through analyzing the correlation between phenological flowering of Forsythia velutina and meteorological factors based on past studies, the flowering time showed the highest correlation with daily average temperature (r = −0.324) at a significance level of 0.01, followed by daily average minimum temperature (r = −0.271) and daily minimum relative humidity (r = −0.222) (Table 4). It was found that the change trend of weather factors was statistically significant with that of flowering time, which was similar to the finding of previous studies that first flowering in the flora was affected by temperature in spring (Fitter et al., 1995; Walkovszky, 1998; Sparks et al., 2000). The phenology of fallen blossoms showed the highest correlation with daily average minimum temperature (r = −0.274) at a significance level of .01, followed by daily average temperature (r = −0.217) and daily average maximum temperature (r = −0.142). Through a correlation analysis between flowering period and meteorological factors, it was found that the flowering period was statistically significant with relative humidity rather than temperature, unlike flowering and fallen blossom times. The flowering period had the highest correlation with the daily average relative humidity (r = −0.127) and the daily minimum relative humidity (r = −0.131) at significance levels of .01 and .05, respectively. Therefore, it is considered that Forsythia velutina, as a plant that blooms in March, is directly affected by the temperature and humidity between February and March.
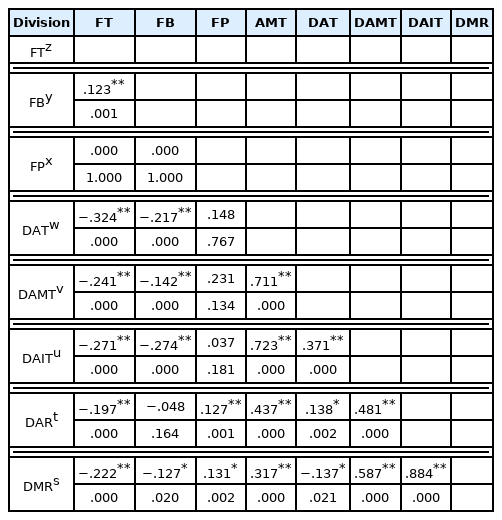
Pearson correlation
Conclusion
The establishment of effective conservation and protection measures for endemic plants requires accurate information on the ecological and biological characteristics of each plant species, as well as environmental characteristics such as vegetation, soil, and microclimate for its habitat. Information related to the genetic structure and features and the adaptive capacity of the relevant community provides basic data for establishing conservation measures. Comparing the existing literature for the purpose of exploring such information, the method of analyzing the correlation between changes in flowering time and meteorological factors has typically been to use a warmth index, but the meteorological observation data was collected at a distance away from the native habitat of plants, showing a problem with low reliability. Therefore, in this study, a meteorological device (Hobo) was installed near Forsythia velutina to closely observe its phenological changes by correlating it with the meteorological data. This study selected Forsythia velutina as a research subject, which had previously been planted at Gyeongsangnam-do Arboretum under the Gyeongsangnam-do Forest Environment Research Institute. It aimed to analyze optimal temperature and humidity for the endemic plant according to seasonal changes for 8 years from 2010 to 2017, and provide basic data for phenological research in the future. The major findings are as follows.
Forsythia velutina was observed to have a phenological cycle from flowering in mid-March to leaf abscission in mid-November, with an average growth period of 243 (± 6.5) days. As a result of the reliability test of a single variable according to the meteorological factors, the Cronbach’s Alpha was 0.701, showing relatively high reliability. The average times of flowering and fallen blossoms of Forsythia velutina were analyzed to be March 16 (SD = 5.8) and March 29 (SD = 5.2), respectively; therefore the flowering period was 11–23 days, showing a large difference each year, with an average of 16 days (± 4.7). For temperature and humidity from February to March affecting flowering, the temperature was observed to be 2.9–5.5°C and the relative humidity 66.5–73.0%, showing differences every year. Budburst occurred on March 14, 2013, and on April 2, 2010, showing a time difference of about 20 days; through an optimal temperature and humidity analysis, buds were found to burst when the average temperature and humidity were maintained at 6.4°C (± 0.2) and 72.8% (± 3.1), respectively. Leaf unfolding occurred on March 31 in 2014 and on April 19 in 2010, a time difference of about 20 days, which is considered to be affected by budburst time. The analysis of optimal temperature and humidity for phenological leaf unfolding period suggested that the leaves opened when the average temperature and humidity were maintained at 11.3°C (± 0.9) and 72.0% (± 3.2), respectively. The fall foliage period was observed to be from the end of October to mid-November when leaf abscission occurred. Although there was a difference in the time when fall foliage started every year, the duration of fall foliage showed a certain pattern from 11 to 22 days each year. An analysis of optimal temperature and humidity for fall foliage period found that fall foliage was observed when the average temperature and humidity were maintained at 7.0°C (± 0.8) and 85.1% (± 3.1), respectively. For leaf abscission period, leaves fell phenologically when average temperature and humidity were 6.7°C (± 1.0) and 80.9% (± 5.5), respectively.
For plant species in which flowering begins before leaf unfolding, such as Forsythia velutina, the change in flowering time is the most important, so the correlation with weather factors was analyzed in this study. The flowering time was correlated with meteorological factors, and of the various factors, the daily average maximum temperature and the daily average temperature were found to have the highest significance. If basic data on plant species requiring conservation, such as rare plants, endemic plants, and endangered plants, are established to determine phenological changes and meteorological conditions, it is considered that it will be helpful in establishing conservation strategies for the relevant plant species in the future. The native habitat of Forsythia velutina is Mt. Jangsusan in Hwanghae-do, North Korea, so there are no research data and findings on the native region such as the growing conditions. It is hoped that this study will be used as a tool to inform the public of the need for conservation measures for the plant through education by faithfully conserving extra-habitual habitats in South Korea. Finally, as this study analyzed only meteorological data to understand the phenology of plant species and thus has a limitation in that it did not analyze surrounding environmental factors such as scent, slope, and microclimate more closely, it is considered that additional research is needed.