


Introduction
Recent urban agriculture meets the needs of urban residents who want safe foods and prefer functional crops and avoids using chemical pesticides that contaminate the environment (soil, air, water quality, etc.), widely using mixed cultivation with companion plants as a sustainable, environmentally friendly farming method (Shin et al., 2014). Companion plants refer to plants that are planted together in gardening to help another plant or each other (Hong et al., 2021). This planting method is related to environmentally friendly farming (Tringovska et al., 2015) and is a special mixed cultivation system that applies the effect of companion plants to soil environment and reduction of diseases and pests as well as damages from pathogens (Chang et al., 2017). Growing two or more plants together is generally a method to control diseases and pests in agricultural production, and it has various effects such as positively changing the surrounding microclimatic conditions, preserving water and nutrients by adding organic matter and nitrogen to soil, and suppressing weeds (Bomford, 2009; Gómez-Rodríguez et al., 2003), but it also reduces the yield of main crops due to interference such as competition over light, water, and nutrients (Borowy, 2012; Jedrszczyk and Poniedzialek, 2007; Lu et. al., 2000). Nonetheless, clusters and diversity of soil microbes play a significant role in the function and sustainability of the agricultural ecosystem (Shin et. al., 2014; Doran and Zeiss 2000), and the changed soil affects plant growth with plant-soil feedback (Bever, 1994; Putten et. al., 1993).
Cherry tomatoes (Lycopersicon esculentum) are comprised of 95% water, 0.7% protein, 0.1% fat, 3.3% carbohydrate, 0.4% cellulose, and 0.5% ash content (Chae, 2020), and are proved to have various functions such as antioxidant effect of lycopene or β-carotene and inhibition of oxidization by low density lipoprotein (LDL) (Lenucci et al., 2006). These days, the quantity of cherry tomatoes has somewhat increased with fertilization for high yield, but application of too much fertilizer is causing all kinds of physiological stress and environmental pollution problems due to salination of cultivation soil. Therefore, adequate fertilization methods are needed for plant growth, but there are insufficient standards and thus causing many difficulties in cultivation. Accordingly, based on understanding of growing conditions and crop physiology, it is necessary to establish a series of techniques suitable for soil and environment to increase sugar content, improve hardness, and control diseases and pests (RDA, 2005). This study selected 4 types of herbs and flowers such as basil (Ocimum basilicum), spearmint (Mentha spicata), marigold (Tagetes erecta L.), and garden zinnia (Zinnia elegans) with insecticidal, fumigating, and antibacterial effects proved by previous studies (Tringovska et al., 2015; Moon, 2011) and determined the companion effect depending on planting type and planting ratio. Studies on environmentally friendly farming using companion plants examined the effect on cucumber growth (Chang et al., 2017), tomato growth (Liu et al., 2014; Held et al., 2003; Vernon et al., 2016; Tringovska et al., 2015), and weed suppression (Valentin et al., 2017), but very few examined the effect of companion plants on the growth of cherry tomatoes that are different from tomatoes. Accordingly, this study was conducted to identify various factors of companion planting affecting the growth of cherry tomatoes, which will contribute to promoting urban agriculture by improving socioeconomic satisfaction of urban residents with gardening activities through high yield, quality improvement, and adequate fertilization.
Research Methods
Materials and methods
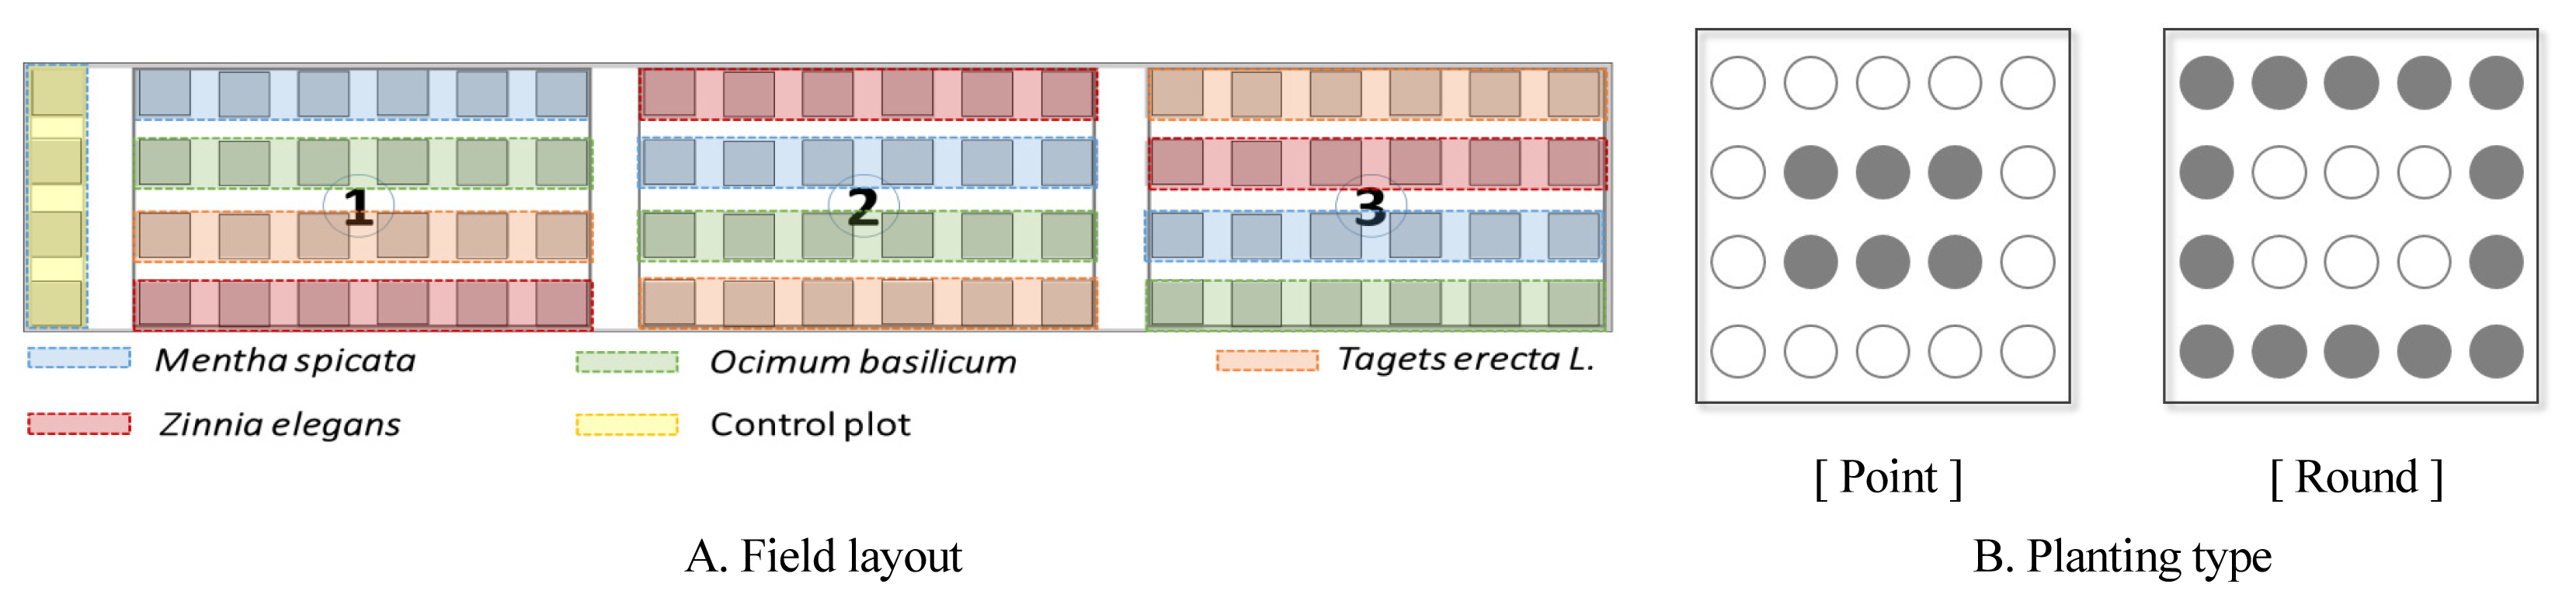
To determine the effect of companion planting on the growth of cherry tomatoes as a method to promote garden diversity and find a sustainable plan to use urban gardens, this study created 76 rows with the width, length, and height of 1 m, 1 m, and 0.3 m for 5 days from April 10, 2020 on the field of the National Institute of Horticultural and Herbal Science located in Iseo-myeon, Wanju-gun (Fig. 1A).
We selected the ‘Minichal’ variety of cherry tomatoes (Lycopersicon esculentum MILL.) that is most preferred by urban residents and selected marigold (Tagetes erecta L.), basil (Ocimum basilicum), spearmint (Mentha spicata), and garden zinnia (Zinnia elegans) that showed companion effects such as insecticidal, fumigating, and antibacterial effects proved by previous studies (Tringovska et. al., 2015., Moon, 2011) as companion plants. Cherry tomatoes were sowed and raised on gardening bed soil from January 10, 2020 and transplanted when the first flower of the first flower cluster bloomed on April 26, 2020. The plant spacing was 60cm, and we applied the two planting types, point type and round type, that showed the best growth effect in Chae et al. (2019) (Fig. 1B). The planting ratio of companion plants was 0% (9 main crops), 30% (6 main crops, 3 companion plants), 50% (4 main crops, 5 companion plants), and 70% (3 main crops, 6 companion plants), and the experiment was conducted in triplicate for each experimental plot (Table 1).
Survey and analysis methods
We analyzed the soil properties before transplant to determine the relationship between plant growth and absorption of inorganic components by soil in companion planting. Soil chemical properties followed the soil chemical analysis method by Rural Development Administration such as pH, organic content, available P2O5 and K, Na, Ca, Mg, etc. As a result, pH was 7.09, phosphoric acid content 72.49 mg/kg, exchangeable potassium 0.24 cmol+/kg, and exchangeable calcium 4.53 cmol+/kg (Table 2), which were generally low compared to the recommended standard for cherry tomatoes. Thus, additional fertilization was done 3 times (nitrogen 11.3 kg / potassium 8.3 kg per 10a). Soil samples were collected again 70 days after transplant to determine the change in absorption of inorganic nutrients from soil before and after planting.
Starting with the initial investigation on April 28, 2020, we investigated length, stem thickness, total fruit quantity, weight, and hardness on July 17. The growth and quantity of crops were surveyed based on the standards of experimental agriculture by Rural Development Administration (RDA, 2012).
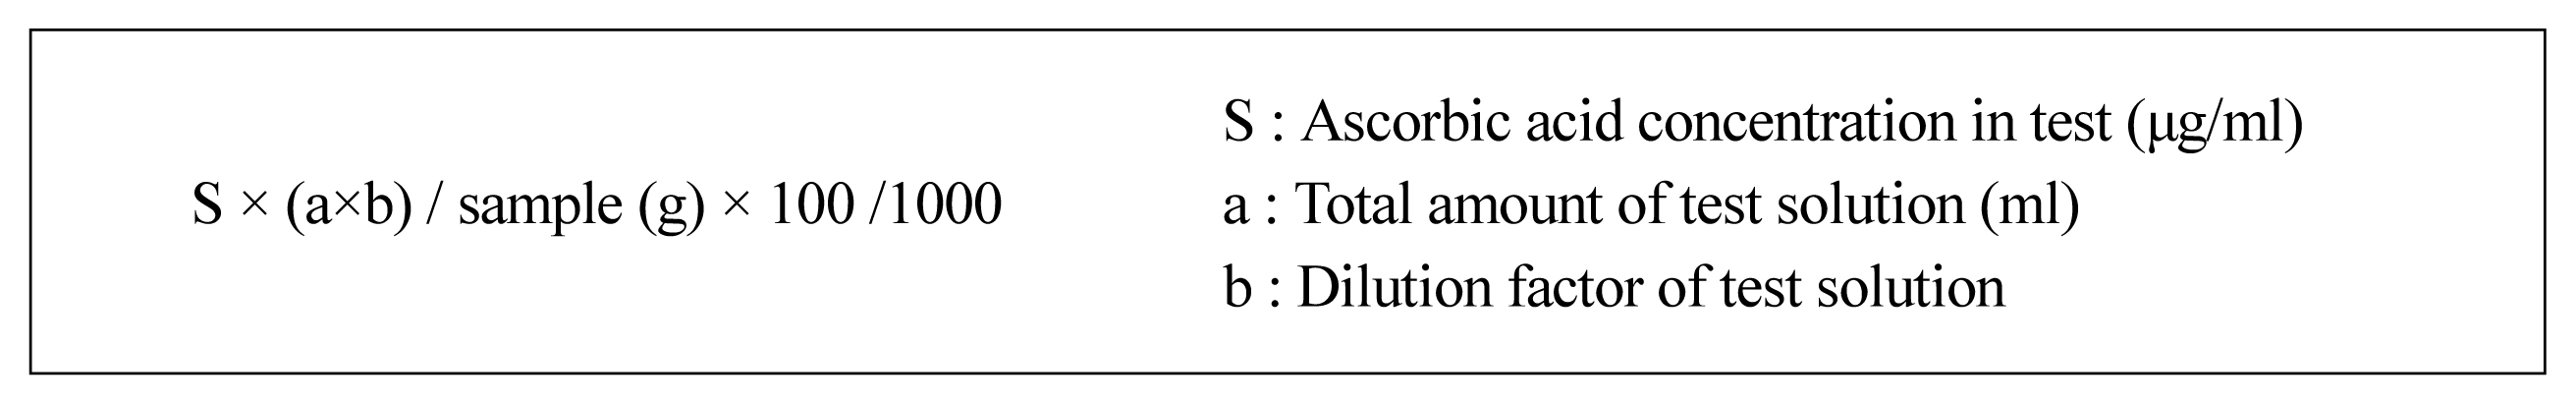
Sugar content was measured with a refractometer (ATAFGO PAL-1) by collecting samples and extracting juice from them, after which we marked the sugar content in °Brix up to one decimal place. Vitamin C content was analyzed using high-performance liquid chromatography (Agilent Technologies 1260 Infinity II). This was performed according to the research and analysis criteria of the Ministry of Food and Drug Safety (MFDS, 2000), and the result is obtained as shown in Fig. 2.
Samples for plant body analysis were harvested and separated into stems, leaves, and roots in each experimental plot. Then they were washed with water, dried at 70°C, and pulverized to 100 mesh on a grinder. We obtained samples with nitric acid (HNO3) and perchloric acid wet digestion method through preprocessing of the plant body, after which we used ICP (Integra XM2, GBC Scientific Equipment, Australia) to analyze the plant body using the soil chemical analysis method (NIAST, 2000). The results were analyzed with IBM SPSS statistics Ver. 25 program to obtain the mean and standard deviation. To verify the difference in variables, we surveyed the correlation among dependent variables and conducted multivariate analysis of variance (MANOVA) for growth and one-way ANOVA for vitamin C content. Then we conducted multivariate testing of each individual factor of companion plants, planting type, and planting ratio and tested the significance at a 95% confidence level (p < .05) using Duncan’s multiple range test.
Results and Discussion
Growth of cherry tomatoes and changes in the contents of inorganic components
Growth of cherry tomatoes
Compared to monoculture of cherry tomatoes, the growth of plant bodies in the experimental plots with companion planting showed a significant increase overall (p < .05). Length was MP7 187.3 cm > OR5 184.3 cm > TP7 183.7 cm > TR5 182.0 cm > TR7 181.3 cm, showing the greatest effect when planning companion plant ‘mint’ in the point type (70% ratio). Basil and marigold were also long at the ratio of 50% and 70%. Stem thickness was TP7 12.4 mm > MP7 11.7 mm > ZP3 & ZP5 11.6 mm > OR5 & ZR5 11.3 mm, which was 1.6–2.7 mm thicker than the control plot (9.7 mm). Total fruit yield was MP7 97 pieces > TP7 91 pieces > TR7 & ZP7 & ZP5 88 pieces, harvesting 32–35 more than 56 in the control plot. Total weight of harvested fruits was MP7 1262.6 g > TP7 1226.6 g > ZP5 1209.8 g > ZP7 1196.2 g > TR7 1118.1 g, showing 108.5–645.6 g more weight than the control plot at 617.0 g. All experimental plots showed better growth than the control plot, and the weight of each fruit in the experimental plot was MR5 13.83g > MP5 13.60 g > ZR7 13.52 g > MP7 13.02 g > ZP5 13.00 g, which was within the range of 10.69–13.83 g. Fruit hardness was highest in MP7 and Nt0 control plot at 2.7 kg and lowest in TR3 (1.8 kg), showing that all experimental plots were better than pieces (Table 3).
Compared to monoculture of cherry tomatoes, cherry tomatoes cultivated with companion plants such as mint, basil, marigold, and garden zinnia showed significantly better growth. However, as a result of analyzing the difference in individual growth between monoculture of cherry tomatoes and companion planting using Wilks’ statistics, lambda value was 0.922, F-value was 1.362, and p-value was 0.143, and thus there was no significant difference in growth of monoculture and companion planting at p > .05. As a result of the posttest, there was a difference between the control plot and experimental plots except for fruit hardness (Table 4). This result is consistent with the study by Tringovska et al., (2015) reporting that companion planting does not affect growth but helps inhibit root-knot nematodes in soil.
By planting type, cherry tomatoes showed better growth overall in the experimental plots with mixed cultivation by planting type than the control plot growing only cherry tomatoes, except for fruit hardness. Wilks’ statistics of MANOVA of the control plot growing only cherry tomatoes and the experimental plots with mixed cultivation of companion plants in the point type and round type showed the following results. Lambda value was 0.944, F-value was 2.957, and p-value was 0.008, showing a statistically significant difference. Thus, mixed cultivation by planting type seems more effective in growth than monoculture of cherry tomatoes, and the posttest results showed that all items of growth except fruit hardness were different from the control plot (Table 5).
By planting ratio of companion plants, cherry tomatoes showed better growth overall in the experimental plots with mixed cultivation by planting type than the control plot growing only cherry tomatoes, except for fruit hardness, showing effect in the order of 70% > 50% > 30% (Table 6). Wilks’ statistics of MANOVA were as follows. Lambda value was 0.884, F-value was 3.146, and p-value was p < .000, showing a statistically significant difference. Thus, mixed cultivation of companion plants by planting ratio was more effective in growth than monoculture of cherry tomatoes. The posttest results showed that length and weight per fruit were similar with the control plot at the ratio of 30%, and different at the ratio of 50% and 70%. Stem thickness, total quantity, and total weight all showed a difference in the experimental plots compared to the control plot.
To test the effect among individual factors, we examined the F-distribution of Wilks’ lambda and found that companion plants and planting type were statistically significant (p < .01), and there was no significant difference between companion plants and planting ratio (p > .05), but a difference in growth between planting type and planting ratio (p < .01). As a result of testing the effect among three individuals, Sig. of F = 0.943 > 0.05, and thus there was no interaction effect among companion plants, planting ratio, and planting type (Table 7).
Inorganic components of the plant body
The results of harvesting the aerial parts of cherry tomatoes 70 days after sowing and analyzing the mineral content were statistically significant (Table 8). Nitrogen (N) was mostly distributed in leaves as a constituent of chlorophyll, protein, and enzyme, and it was redistributed well in the order of roots > stems, showing high content in both leaves and roots compared to standard content 8.1mg (RDA, 2005). Compared to the control plot, roots were all high or showed a significant difference except ZR3 and leaves except MR3, MR5, OP5, OP7, TR7, TP3, ZR5. This result was similar to the study by Lee (2005) claiming that the absorption amount was biggest between 60 and 90 days after transplant. Potassium (K) involved in photosynthesis and carbohydrate synthesis is mostly distributed in leaves with active photosynthesis, followed by stems > roots, which was generally higher than the control plot but all lower than standard content 16.4 mg except leaves. This result was similar to the study by Papadopopoulos (1986), which proved that nitrogen and potassium are in competition over nutrient uptake of plants, and an increase in nitrogen concentration in soil leads to an increase in nitrogen content in plants, but a decrease in potassium content. Phosphorus (P) is adjusted by pH in soil, and it is distributed mostly in stems and leaves during vegetative growth and not much in roots.
According to Moon and Yoo (2013), the absorbed phosphorus is distributed inside the body in the form of organic phosphorus compound or inorganic phosphate and involved in cell growth and proliferation, and thus requires separate management with basal or root fertilization for fruit growth. Calcium (Ca), which is distributed mainly in soil and has low plant absorption rate, is distributed mostly in leaves, followed by stems > roots. The calcium absorption amount of the plant body was greater than soil, showing a difference from conventional culture in which calcium is distributed in soil. Magnesium (Mg) is a component with severe antagonism with other cations and is mostly distributed in leaves with chlorophyll, followed by roots > stems. This content is far beneath the adequate threshold (4.76 mg/kg−1) by excessive absorption of potassium. However, phosphoric acid, calcium, and magnesium tended to increase along with the amount of applied fertilizer. As reported by Hanan (1998) and Lindsay (1979), mineral content in some plant bodies decreased when soil pH increased because there was antagonism among cations in the absorption process by increasing the amount of solubilized calcium and magnesium in soil, which was also reported similarly by Mengel and Kirkby (1987) and Marschner (1995). All mineral elements showed a statistical difference at 0.1%. Sodium (Na), which is not an essential element but a beneficial element, is involved in increasing quantity and mostly distributed in roots, followed by leaves > stems, and will have effect as a substitute of potassium.
Compared to the control plot with monoculture of just cherry tomatoes, the contents of inorganic components in cherry tomatoes cultivated with companion plants such as mint, basil, marigold, and garden zinnia was significantly higher in most cases except magnesium and sodium in roots and stems, and calcium and magnesium in leaves (Table 9). As for the difference in inorganic components among individuals between monoculture of cherry tomatoes and companion planting, Wilks’ lambda was 0.000, F-value was 72.111, and p-value was p < .001, showing a statistically significant difference, proving that mixed cultivation of companion plants showed more difference in the contents of inorganic components than monoculture of cherry tomatoes. The posttest results showed that roots showed a difference from the control plot in most components except nitrogen and calcium, and stems and leaves showed a difference from the control plot in most components except calcium and magnesium. This result was consistent with the investigation of plant body growth and similar to the study by Chang et al. (2017) stating that inorganic components affect crop growth.
By planting type, roots and stems showed low content of magnesium and sodium in both the point type and round type, while leaves had low content of calcium and magnesium in the round type, but the contents of inorganic components was generally higher in the experimental plots compared to the control plot (Table 10). As a result of multivariate testing, Wilks’ lambda was .010, F-value was 178.947, and p-value was .000, showing a statistically significant difference, proving that planting type determines the effect of absorption of inorganic components within the plant body of cherry tomatoes. The posttest results showed that roots showed a difference from the control plot in most components, but nitrogen showed a difference in the point type and phosphorus in the round type, while calcium showed a similar content between the point type and round type. Stems showed a difference in most components in the point type except nitrogen and calcium, whereas only phosphorus and sodium showed a difference in the round type. Leaves showed a difference in most components except calcium and magnesium, whereas only calcium and sodium showed a difference in the round type.
The contents of inorganic components in mixed cultivation by planting ratio were mostly significantly high except magnesium and sodium in roots and stems and calcium and magnesium in leaves (Table 11). As for the difference in inorganic components among individuals by the planting ratio of 30%, 50%, and 70%, Wilks’ lambda was .000, F-value was 99.609, and p-value was .000, showing a statistically significant difference, proving that companion planting applying the planting ratio was effective in increasing the contents of inorganic components in the plant body of cherry tomatoes. The posttest results showed that roots showed a difference in all experimental plots from the control plot in magnesium and sodium, and stems showed a difference from the control plot in nitrogen, phosphorus, and sodium. Leaves showed similar contents of calcium and magnesium with the control plot, while the rest showed a difference.
To test the interaction effect, we examined the F-distribution of Wilks’ lambda and found that there was a difference in the contents of inorganic components between companion plants and planting type, companion plants and planting ratio, and planting type and planting ratio (p < .001). As a result of testing the effect among individual factors, Sig. of F = .000 < .001, and thus there was an interaction effect among companion plants, planting ratio, and planting type in the contents of inorganic components in the plant body (Table 12).
Irrigation, another factor that affects absorption of inorganic components, was equally treated with drip irrigation, but the moisture demand varied among planted companion plants and thus there was some difference in soil moisture content. Soil moisture content by irrigation is expected to affect absorption of inorganic compounds and thus will be added to future experiments.
Change in sugar content and vitamin C content of cherry tomatoes
Change in sugar content
Sugar content is a factor determining quality, and eating quality varies greatly depending on sugar content. Sugar content increases in a short time as the fruit enters the color stages, and it increases gradually as the fruit matures. Sugar content (fructose, glucose) increases as harvest time is delayed, and the standard sugar content in the full ripe period of cherry tomatoes is 5.8°Bx (RDA, 2008). The results of the experiment were as follows: MR7 8.1°Bx, MP7 & ZP7 & ZR7 7.9°Bx, TP7 7.8°Bx. The lowest sugar content was TR5 7.0°Bx, which was generally 1.2–2.3°Bx higher compared to conventional culture. This result was similar to the study by Kim et al. (2013) revealing that fruit sugar content increases along with the increasing nitrogen concentration of soil. The control plot showed the sugar content of 7.8°Bx, which was 2°Bx higher than the standard sugar content, and experimental plots other than MR7 / MP7 / ZP7 / ZR7 showed lower sugar content than the control plot (Fig. 3). As a result of verifying the difference among groups through the posttest using Duncan’s test, there was no statistical difference. This is similar to the result by Chang et al. (1998) claiming that high manure application increases fruit sugar content. On the other hand, Ehret and Ho (1986) argued that increasing electrical conductivity (EC) of the nutrient solution by mixing KNO3 and Ca(NO3)2 compared to NaCI is more effective in increasing sugar content of cherry tomatoes, which will be studied further.
Change in vitamin C content
Vitamin C is known to participate in many biological responses in the human body (Hwang et al., 2014). As a result of analyzing vitamin C content of fruits existing in two forms such as dehydro-ascorbic acid (DHA) absorbed by facilitated diffusion and ascorbic acid (AA) absorbed by active sodium-dependent transport, the content was highest in the order of MR5 44.77 mg > TR3 43.69 mg > TP3 40.67 mg > OP5 40.59 mg > TP5 40.38 mg, which was 14.11 – 18.50 mg higher per 100 g compared to the control plot at 26.27 mg. This was much higher than the standard by Lee (2020) that the adequate vitamin C content of cherry tomatoes is 15.59 mg, and also higher in all experimental plots than the full ripe period at 24.0 mg according to the Ministry of Food and Drug Safety (Table 13).
Fruits of cherry tomatoes with mixed cultivation of companion plants generally had high vitamin C content (Table 14). However, the results of one-way ANOVA showed that F-value was 1.155 and p-value 0.336, showing no statistically significant difference in testing for individual effects, and thus companion planting did not have an interaction effect with vitamin C content (Table 14).
By planting type, as a result of testing individual effects with vitamin C content, F-value was 1.64 and p-value 0.206, showing no interaction effect at the significance level of p > .05 with planting type and vitamin C content (Table 15). By planting ratio of companion plants, as a result of testing the effects with vitamin C content, F-value was 0.84 and p-value 0.438, showing no interaction effect with planting ratio and vitamin C content (Table 16).
Testing the effects among three individual factors in vitamin C content showed that there was a significant difference between companion plants and planting type, and companion plants and planting ratio (p < .05), but none between planting type and planting ratio (p > .05). However, the effect among three factors was Sig. of F = .003 < .001, and thus vitamin C content had an interaction effect with companion plants, planting ratio, and planting type (Table 17).
Physicochemical change of soil
Soil includes many natural inorganic nutrients that are absorbed by plants to use for growth and then returned back to soil at the end of life. However, farmland soil where crops are grown has inorganic nutrients contained in the harvests removed from soil through cultivation repeated every year, and thus certain nutrients are likely to be insufficient. Thus, we identified the state of inorganic nutrients in soil changed after harvest to determine whether farmland soil can be reused or not (Table 18). Soil pH is an important element that determines solubility of inorganic nutrients, and cherry tomatoes like subacidity of pH 6.0–6.5 (Yun et al., 2000). Soil in the cultivation plot had pH in the range of 5.5–9.0, and it was weakly alkaline (pH 7.7) in all experimental plots except garden zinnia. This is because, as reported by Park and Kim (1998), there is a great amount of anion absorption such as nitrate nitrogen when there is active vegetative growth, and cation absorption such as K+ increases in reproductive growth and thus hydrogen ions (H+) are released from the roots. Electrical conductivity (EC) was 0.1 ds/m and thus adequate for the threshold (below 0.2). Moreover, as inorganic components of the plant body decreased, the concentrations of potassium, calcium, and sodium in the soil increased, which caused antagonism among cations in the absorption process at the roots, thereby increasing relative absorption amount of magnesium and reducing the amount remaining in soil. Nonetheless, soil chemical properties after harvesting cherry tomatoes showed high acidity in upland soil (RDA, 2020), and low contents of phosphoric acid, exchangeable potassium, calcium, and magnesium. Therefore, it is necessary to plow 60–70cm deep to secure pore void, adequately adjust the amount of irrigation considering the smooth drainage due to deep tillage, and implement management practices to minimize use of nitrogen fertilizers.
Conclusion
This study was conducted to identify various factors of companion planting affecting the growth of cherry tomatoes, which will contribute to promoting urban agriculture by improving socioeconomic satisfaction of urban residents with gardening activities through high yield, quality improvement, and adequate fertilization. We created 76 for 5 days starting April 10, 2020 and planted cherry tomatoes accompanied by spearmint, basil, marigold, and garden zinnia in the point type and round type at the ratios of 0%, 30%, 50%, and 70%, and conducted an experiment in triplicate. The results are as follows.
First, the growth of cherry tomatoes increased more significantly in companion planting than monoculture. Companion planting did not affect growth, but there was a statistically significant difference in planting type and planting ratio. As a result of testing the effect among three individual factors, there was a significant difference between companion plants and planting type, and planting type and planting ratio, but no interaction effect between companion plants and planting ratio, and among companion plants, planting type, and planting ratio.
Second, as a result of analyzing the contents of inorganic components by harvesting the aerial parts of cherry tomatoes 70 days after sowing, there was a significant difference at the level of 0.1%. We tested the effect among individual factors for each part of the plant body and discovered that there was a statistically significant difference in all of companion plants, planting type, and planting ratio. Wilks’ statistics to test the interaction effect showed a difference in the contents of inorganic components between companion plants and planting type, companion plants and planting ratio, and planting type and planting ratio (p < .001). As a result of testing the effect among individual factors, Sig. of F = 0.000 < 0.001, and thus there was an interaction effect among companion plants, planting ratio, and planting type in the contents of inorganic components.
Third, sugar content was higher in both the experimental plots and control plot than the standard sugar content at 5.8°Bx, and like the growth survey, the point type at the 70% ratio of spearmint and marigold showed high sugar content. The lowest sugar content was found in the round type at the 50% ratio of marigold at 7.0°Bx, which was 1.2–2.3°Bx higher than standard sugar content.
Fourth, vitamin C content was higher in all experimental plots than the standard amount of 24.0mg/100g at full ripe period and was statistically significant. However, the result of one-way ANOVA showed that companion plants, planting type, and planting ratio did not have a significant difference with vitamin C content.
Fifth, the soil pH of the cultivation plot was within the range of 5.5–9.0, weakly alkaline (pH 7.7) in all experimental plots except garden zinnia, and showing low contents of phosphoric acid, exchangeable potassium, calcium, and magnesium. Therefore, it is necessary to plow 60–70cm deep to secure pore void, adequately adjust the amount of irrigation considering the smooth drainage due to deep tillage, and implement management practices to minimize use of nitrogen fertilizers.
This study was conducted to identify various factors such as the growth of cherry tomatoes, contents of inorganic components in the plant body, sugar and vitamin C content of fruits, and soil analysis according to companion plants, planting type, and planting ratio to determine the effect of companion planting on the growth and quality of cherry tomatoes, establish the foundation for growth to ensure high quality and yield to meet the needs of urban residents, and provide management convenience through succession cropping. However, the limitation of this study is that it failed to separately examine management practices and irrigation time during the growth of cherry tomatoes. The effect on main crops may vary depending on the root development and growth speed until transplant after sowing, and thus we will further study sugar content by measuring the change in growth every phase and analyzing content in each phase of maturity and full ripeness of fruits.