Comparison of the Particulate Matter Removal Capacity of 11 Herbaceous Landscape Plants
Article information

Abstract
Background and objective
Particulate matter (PM) has a fatal effect on health. There have been many studies on the use of plants such as trees and shrubs as eco-friendly and sustainable biofilter for the removal of PM. In forming more green space, ground cover plants play an important role in multi-layered planting. This study was conducted to investigate the ability of plants to reduce PM, targeting Korean native ground cover plants with high availability in urban green spaces.
Methods
For 4 species of Asteraceae, 4 species of Liliaceae, and 3 species of Rosaceae, one species of plants at a time were placed in an acrylic chamber (800 × 800 × 1000 mm, L × W × H) modeling an indoor space. After the injection of PM, the amount of PM remaining in the chamber over time was investigated.
Results
For all three types of PM (PM10, PM2.5, PM1), significant difference occurred in the amount of PM remaining between plant species after 1 hour in the Liliaceae chamber, 3 hours in the Asteraceae chamber, and 5 hours in the Rosaceae chamber. With Liliaceae, the leaf area and the amount of PM remaining in the chamber showed a negative (−) correlation. With the Asteraceae and Rosaceae, there was a weak negative correlation between the leaf area and the amount of PM remaining in the chamber.
Conclusion
When using ground cover plants as a biofilter to remove PM, it is considered effective to select a species with a large total leaf area, especially for Liliaceae.
Introduction
In urban landscaping, attempts have recently been made to restore the cyclic capacity of nature, which has been degraded due to gradually decreasing green space, by applying a multi-layered planting model composed of grasses, shrubs and trees (Kim, 2011). Among these plants, ground cover plant is a generic term for plants that densely cover the ground surface, which are the smallest plant materials that make up the landscape; the plants generally grow to less than a height of 50 to 100 cm at the beginning of growth, with slow growth in the above-ground part and excellent growth in the underground stem (Bang, 2009). The planted area of ground cover plants are currently on the rise through the expansion of urban green spaces, and these plants play various roles that include landscaping, soil erosion prevention, microclimate control, and roadside reflection prevention. Wu et al. (2021) reported that planting ground cover plants and trees together was more effective in the remediation of soil contaminated with heavy metals than planting them separately. Lee et al. (2013) studied the effect of concentration of calcium chloride used as a road de-icing agent on the growth of ground cover plants including Pachysandra terminalis, Hosta plantaginea, and 4 species of woody plants. Kang and Zhao (2013) evaluated the drought resistance of 12 species of ground cover plants through a drought stress test under uncontrolled conditions. In the harsh urban environment, plants are not only suffering from stress caused by drought, calcium chloride as a de-icing agent and so on, but also are increasingly damaged by air pollution.
Air pollutants include sulfur dioxide, carbon monoxide, and ozone as gaseous pollutants, and particulate matter (PM) as a representative particulate pollutant. Cho et al. (2020) evlautated the response of trees to ozone by comparing the air pollution tolerance index accroding to ozone exposure of major street tree seedlings. Cheng et al. (2013) studied the physiological and biochemical responses of the ground cover plant, Hosta longipes to ozone stress and found that it can be used as an indicator plant for ozone. Meanwhile, of the air pollutants, PM, which has a fatal effect on health, can be classified into PM10, PM2.5, and PM1 according to particle size. By examining the concentration of heavy metals accumulated in landscape trees sampled from regions with different traffic densities, it was found that Prunus cerasifera had high accumulations of Cu, Ni, and Fe, and Ailanthus altissima showed high accumulations of Ca, Mg, and Mn. Heavy metals accumulation in street trees was also found to differ according to plant species and traffic density (Turkyilmaz et al., 2018). Beckett et al. (2000) conducted a wind tunnel test using five species of trees that are widely used as street trees, and found that the conifers Pinus nigra and Cupressocyparis leylandii were much more effective in reducing PM due to their finer and more complex leaf structures. Chen et al. (2015) investigated leaf traits, and three different sizes of PM accumulated on leaves, targeting 24 species of woody plants, and reported that PM retention capabilities of leaves, and specific leaf area (SLA) were significantly greater in highly polluted areas, and SLA was more affected with larger particle sizes; PM2.5 had more of an affect on leaf shape than the other sizes of PM did. In Beijing, China, an experiment on PM capture capacity was conducted on Rosa xanthina, a shrub, Broussonetia papyrifera, a broadleaf tree, and Pinus bungeana, a conifer, and found that shrubs had the greatest PM capture efficiency (Yan et al., 2016). Sillars-Powell et al. (2020) compared PM accumulation on leaves of shrubs including Hedera helix and Rubus fruticosu, and reported that the dense canopy of the two plants reduced airflow, and played a role in preventing the movement of and immobilizing PM. Perini et al. (2017) investigated the amount of fine dust deposition after planting four species of climbers and shrubs in an outdoor vertical greening system, and found that PM with particle sizes of 0.1 to 20 μm was accumulated in large amounts on leaves, in the descending order of Trachelospermum jasminoides, Hedera helix, Cistus, and Phlomis fruticosa. Kwon et al. (2020) conducted an experiment on reducing PM in an acrylic chamber by dividing 12 species of woody plants for landscaping into the three groups of vines, trees, shrubs and small trees, and concluded that the vine plant group was more effective in removing PM than the other two groups. As such, many studies have been conducted on particulate pollutants for shrubs and trees in multi-layered plantings, but for herbaceous species, most of these studies have been focused on indoor foliage plants, such as air-purifying plants selected by NASA (Cho, 2019). Since research on the PM reduction effect of outdoor herbaceous plants has mainly been concentrated on limited ground cover plants such as Sedum species and grasses (Speak et al., 2012), research on the effect of various ground cover plants has been lacking. In Korea, in addition to research on the improvement and preservation of Korean native species according to the purpose of development and use of native plants, and research on the collection and propagation technique of useful native floral plants (Suh, 2007), studies to expand the use of Korean native plants are also required.
Therefore, this study aimed to determine the PM removal capacity of Korean native ground cover plants that are highly usable in urban landscape spaces, and to provide basic data for selecting ground cover plants with high PM reduction effect in the future.
Research Methods
Plant Material
A total of 11 species of plants, which were received from the Korea National Arboretum (KNA), were used as plant materials: 4 species of Asteraceae (Aster scaber, Aster spathulifolius, Aster yomena, and Serratula coronat subsp. insularis) 4 species of Liliaceae (Allium senescens, Hemerocallis fulva, Hosta longipes, and Liriope platyphylla), and 3 species of Rosaceae (Aruncus dioicus var. kamtschaticus, Geum aleppicum, and Sanguisorba officinalis) (Table 1).

Characteristics and total leaf area of plants used in the experiment
These species of plants were described in a case study on the use of native plants by landscape type (Jang, 1999), and were also used in this experiment because we could obtain them from KNA. The plants were planted on horticultural substrate (wonjomix, Nongkyung Agroindustiral., Korea) using plastic pots with a diameter of 15 cm, and grew for 6 weeks in a greenhouse. They were used after 2 weeks of acclimatization in a laboratory environment for PM injection treatment.
Experimental method and data analysis
In an acrylic chamber (800 × 800 × 1000 mm, L × W × H) modeled as an indoor space, 6 pots per plant and the measuring instrument were placed at their designated position that was already marked. The experiment was conducted for about 5 months from mid-July to mid-December. For photosynthesis of the plants, an LED-based white light source was installed at the outer top of the acrylic chamber, and the light intensity at the very top of the plants was 55 μmol·m−2·s−1 PPFD. To minimize the effect of external light, the entire exterior of the chamber was covered with a blackout curtain. The room temperature was set to 25°C and controlled with an air conditioner. Mosquito coils (F-Killer, SC Johnson, Korea) were used as a source of PM, and a separate chamber for generating PM (PM chamber) was installed. The mosquito coils were cut to a fixed length and burned in the PM chamber. The PM chamber was sealed immediately after the mosquito coils began to smoke, and only smoke generated here was injected into the chamber containing the specimen plants (plant chamber) to minimize the effects of heat, carbon monoxide, and carbon dioxide generated by the combustion of the coils. PM1, PM2.5, and PM10 were measured through the mass concentration method (μg·m−3) using a particle counter (Aerocet 531S, Met One Instruments Inc., USA).
For 300 minutes after the injection of PM, the status of PM was automatically measured, and the experiment was repeated 5 times or more for each plant. The leaf area of the plants was measured with a leaf area meter (Li-3000A, LI-COR, USA) after the PM experiment was completed.
Statistical analysis was performed using the SAS 9.3 software package (SAS Institute Inc., USA), and the difference between treatment means was assessed at a 5% significance level with Duncan’s multiple range test.
Results and Discussion
Mosquito coils were burned in the PM chamber and the smoke generated was injected into the plant chamber so that the amount of PM10 reached 1000 μg. The resulting amount of PM10, PM2.5, and PM1 in the chamber was found to be 1017.9 ± 6.9 μg, 910.8 ± 23.6 μg, and 229.9 ± 7.4 μg respectively, in the ratio of 1: 0.895 : 0.226 (Fig. 1A). PM10 mainly occurs in natural conditions such as dust storms and resuspension of local soil, and in anthropogenic conditions such as road dust and various industrial processes; the higher the ratio of PM2.5/PM10, the greater the influence of particulate contamination on anthropogenic factors, while the smaller the ratio, the greater the impact of coarse particles such as dust storms (Querol et al., 2004; Sugimoto et al., 2016). In this study using mosquito coils, the ratio of PM2.5/PM10 was 0.894, which was relatively high. After 5 hours, the amount of PM10, PM2.5, and PM1 was found to be 123.9 ± 26.5 μg, 122.2.8 ± 26.1 μg, and 98.1 ± 18.3 μg, respectively, in the ratio of 1 : 0.986: 0.793, indicating that PM10 and PM2.5 decreased sharply, and PM1 decreased slowly (Fig. 1). PM remaining in the chamber gradually subsides and naturally decreases over time. However, after 5 hours, when the initial PM injection amount was converted to 100%, the amount of PM10 and PM2.5 in the control group decreased by 84.5% and 83.6%, respectively, while the average amount of PM10 and PM2.5 in the experimental group in which plants were used decreased by 88.1% and 86.9%, respectively. As in the study of Lohr and Pearson-Mims (1996), the group where plants were present showed a tendency to effectively reduce PM compared to the control group without plants. When extracting the amount of PM accumulated on the foliage of plants exposed to PM, it has been found that factors of the environment in which the plants grow, such as road traffic congestion, rainfall conditions, and wind speed have an effect (Przybysz et al., 2014). But in this study, both the natural reduction of PM and PM reduction effect of plants were investigated in a chamber to minimize such external influence. It was found that the larger the particle size, the faster the PM decreased. After 5 hours, both PM10 and PM2.5 were reduced by over 80%, but PM1 was only reduced by 40–50% (Fig. 1 F). Since PM1 was found to be more toxicologically dangerous than PM2.5 in terms of cytotoxicity and inflammation, and to have a greater association with pediatric lung dysfunction than PM2.5 (Jalava et al., 2015; Yang et al., 2020), it would be meaningful to determine the effect of plants on the reduction of PM1 in this study.
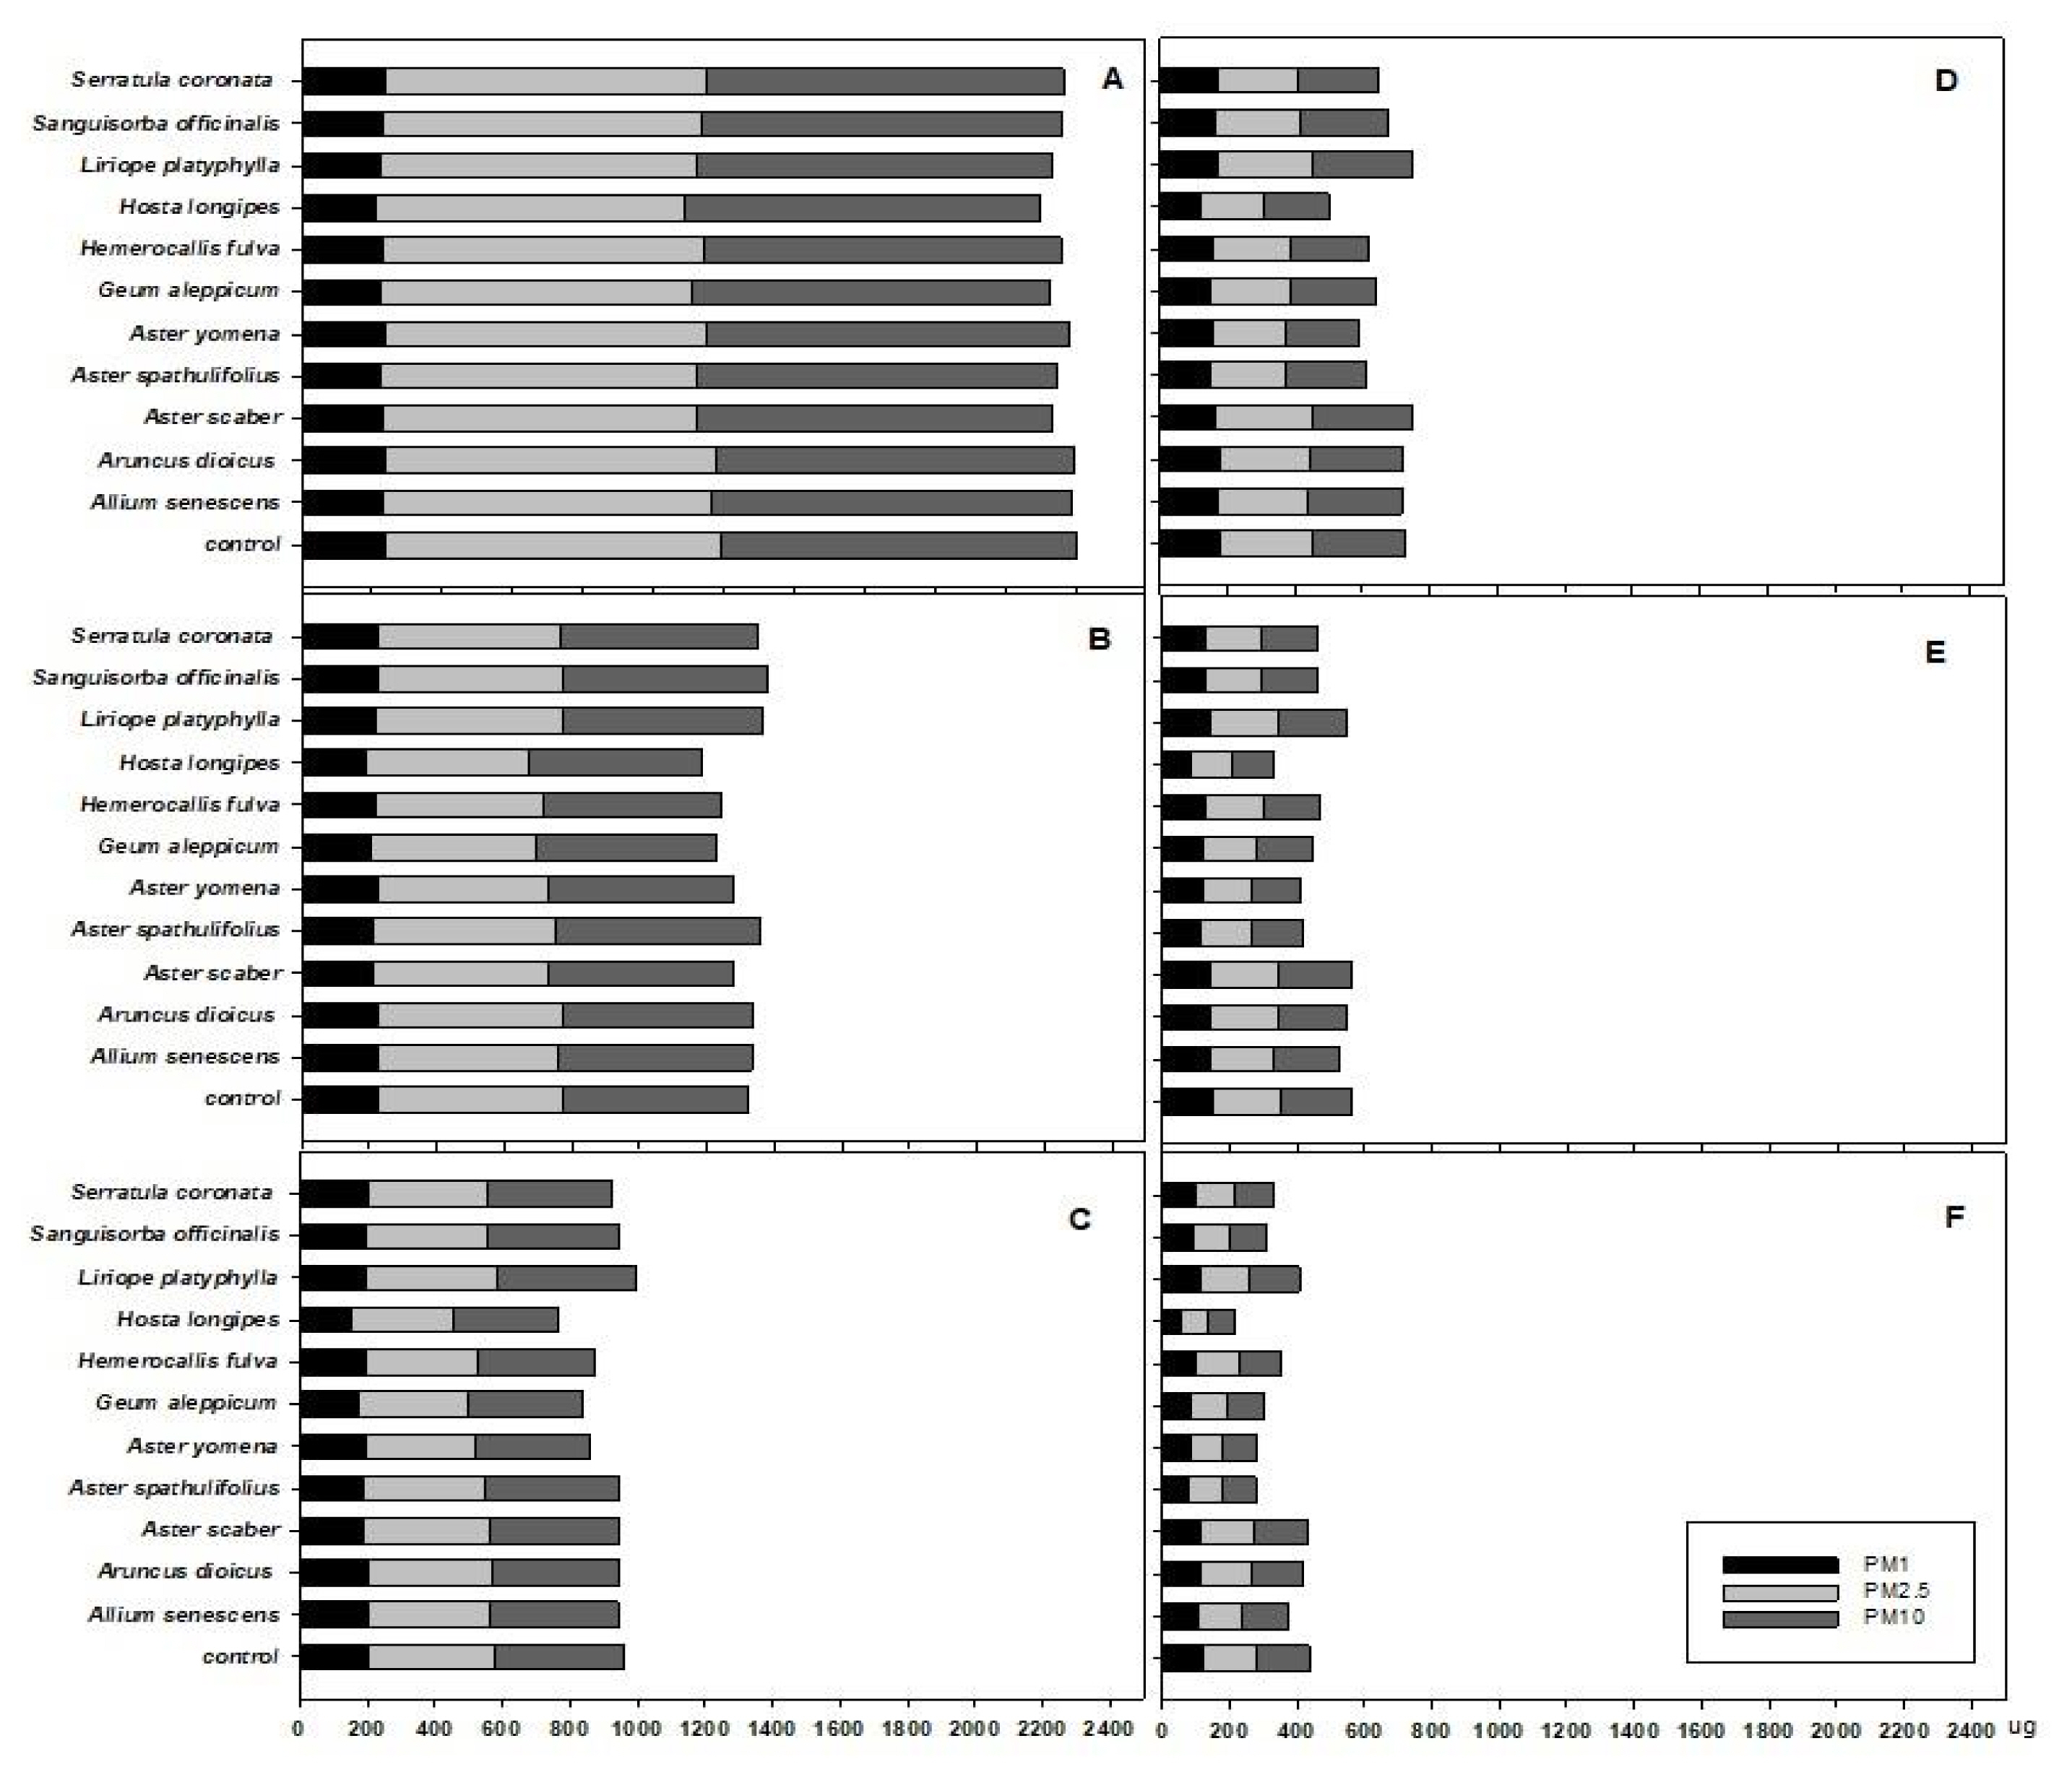
The amount of PM10, PM2.5, and PM1 in the chamber.
A : Start; B : 1 hour; C : 2 hour; D : 3 hour; E : 4 hour; F : 5 hour.
The Asteraceae is the most widely distributed flowering plants in the world and the most evolved plant taxon among dicotyledonous plants, and it is known that about 300 species in this family exist in Korea (Woo et al., 2010). PM reduction effect of plants in the Asteraceae species was investigated including Aster scaber, Aster spathulifolius, Aster yomena, and Serratula coronat subsp. insularis, and it was found that the reduction effect on PM1 between plants was significant different after 1 hour, on PM2.5 after 2 hours, and on PM10 after 3 hours (Table 2). After 3 hours, all of PM1, PM2.5, and PM10l showed a significant difference in their amount, and the chamber with Aster scaber had the highest remaining amount of PM, while the chamber with Aster spathulifolius and Aster yomena had the lowest.

PM1, PM2.5 and PM10 reduction of 4 Asteraceae according to elapsed time (%)
The Liliaceae is mainly distributed in the temperate zones of North America and East Asia in the northern hemisphere, and includes many ornamental plants widely cultivated for their attractive flowers (Kim and Kim, 2018). Liliaceae plants responded faster to PM than Asteraceae plants, and all three types of PM began to show a significant difference in amount 1 hour after being injected into the chamber (Table 3). The chamber with Liriope platyphylla was found to have the highest remaining amount of PM, while the chamber with Hosta longipes showed the lowest amount. Weber et al. (2014) compared the PM immobilization effect between herbaceous species planted along urban roadsides, and reported that of the plants used in their experiment, Taraxacum officinale and Poa pratensis, which form a cluster around stems, had a higher amount of accumulated PM on the foliage than Trifolium repens. The Liliaceae plants used in this experiment had a leaf distribution form similar to that of grasses which were fasciculate, and immobilized more PM than plants with leaves hung onto the stem. Sæbø et al. (2012) examined PM accumulation on leaves of 22 species of trees, and also found that Pinus mugo and Pinus sylvestris, which has needle-like leaves with short leafstalks in a cluster, were more efficient in capturing PM than Acer platanoides and Prunus avium with long leafstalks. Beckett et al. (2000) reported that Pinus nigra and Cupressocyparis leylandii, which are conifers with finer and more complex leaf structures, were much more effective in reducing PM. In a study on the efficiency of removing PM according to the morphological characteristics of plant leaves, Son et al., (2019) found that PM reduction was more efficient for plants with small leaf sizes than for plants with large ones, but stated that the PM reduction was the greatest for coniferous trees, as the morphological characteristics of plant leaves had a greater effect than the size of leaves. Therefore, as in the results of this study, the arrangement of leaves is also considered to affect PM immobilization.
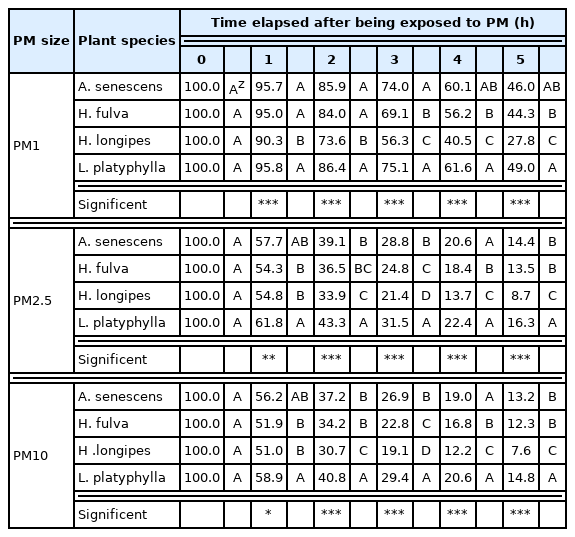
PM1, PM2.5 and PM10 reduction of 4 Liliaceae according to elapsed time (%)
The Rosaceae is distributed worldwide with over 3,000 species in 90 genera, mainly in temperate regions of the Northern Hemisphere (Kalkman, 2004; Potter et al., 2007). In Korea, there are approximately 144 species of Rosaceae in 37 genera (Lee, 2007), and various Rosaceae plants have been used as edible and medicinal materials in the private sector since ancient times (Kim, 2006). Rosaceae plants began to show significant differences in the amount of PM after 5 hours, but there was no difference between the plants (Table 4). After 5 hours, the chamber with Aruncus dioicus var. kamtschaticus was found to have the highest remaining amount of PM.

PM1, PM2.5 and PM10 reduction of 3 Rosaceae according to elapsed time (%)
Through comparing the correlation between leaf area and the remaining amounts of PM1, PM2.5 and PM10 after 5 hours, which was the end point of the experiment, it was found that there was a significant correlation in Liliaceae plants, but in other plant families there was no correlation (Table 5).
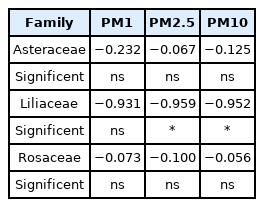
Pearson correlation coefficients (r) between leaf area and remaining PM1, PM2 and PM10 in the chamber after 5 hours
These findings are consistent with the results of Son et al. (2019), which found the morphological characteristics of leaves had a greater effect on the amount of PM than the size of leaves. However, in this experiment, if the leaf arrangements of all other plant families form in cluster and are relatively similar to those of the four species of Liliaceae, it is considered that the leaf area can be a factor significantly affecting the reduction of PM.
Conclusion
In this study, the amount of PM in a chamber was investigated according to time elapsed after the injection of particulate pollutants into the chamber in order to determine the PM removal efficiency of 11 species of herbaceous plants. The 11 species of plants used were compared by being divided into three groups including Asteraceae, Liliaceae, and Rosaceae. Liliaceae plants showed a significant negative (−) correlation between the leaf area and the amount of all three types of PM remaining in the chamber, indicating that the larger the leaf area, the less the PM remaining in the chamber. Asteraceae and Rosaceae plants showed a weak negative (−) correlation between the leaf area and the residual amount of PM in the chamber. Liliaceae plants showed a significant difference in the amount of all three types of PM between the plants after 1 hour, while Asteraceae plants showed this after 3 hours, and Rosaceae plants after 5 hours. Differences in the PM reduction effect between the plant species in Liliaceae appeared early, while those in Rosaceae appeared late. Therefore, when Liliaceae plants are planted as ground cover plants, their leaves develop quickly in early spring when a lot of fine dust is generated, so it is considered that selecting Liliaceae plants with a large leaf area will be effective in reducing PM in the air. Since this study was conducted with a focus on screening the PM reduction pattern for herbaceous plants, in the future, the relationship should be investigated between the microscopic characteristics of leaf such as leaf roughness, stomatal density, and trichome type, which could affect PM reduction, and the morphological characteristics such as leaf shape and leaf growth time. However, this study has significance in that it expanded the research scope from previous research focused on woody plants to that of ground cover plants. It is expected that this study will help improve air quality by promoting the planting of various ground cover plants to act as a biofilter.
Acknowledgements
This study was carried out with the support of ‘R&D Program for Forest Science Technology (Project No. 2019155B10-2021-001) provided by Korea Forest Service (Korea Forestry Promotion Institute).