Resetting the Evaluation Indicators for School Garden Education Service
Article information

Abstract
Background and objective
The vitalization of urban agriculture has increased various forms of experience-based education using school gardens, which raised the importance of school gardens in terms of value as well as the need to develop an implementation system for education-based agricultural experience service using school gardens. Thus, we reset the evaluation indicators from the previous study to establish objective evaluation indicators that enable quantitative comparison of school garden education services.
Methods
Analytic hierarchy process (AHP) and direct question (DQ) surveys were conducted on 20 experts from October 12 to 19, 2020 after establishing the purpose and subjects of evaluation, and then the weights were calculated using the Expert Choice 2010 program.
Results
First, we analyzed the problems of the previous indicators by categorizing the performance indicators and comparing and verifying them with six requirements of valuation. Then, we added ‘welfare values’ and established sub-indicators accordingly. The importance of value indicator in AHP was in the order of education values (0.544), health values (0.182), welfare values (0.164), environmental values (0.062), and economic values (0.049). The importance of environmental and economic values was relatively low, less than 0.1. The importance of sub-indicators was highest in cultivating character (0.144), followed by enhancing ecological sensitivity (0.141) > promoting mental health (0.134) > cultivating agricultural literacy (0.120) > improving social skills (0.104). And mitigating climate change in environmental values was lowest (0.009). Increase in income was the lowest (0.036). This can be regarded as the expression of change to increase the educational effect based on collective life and the connotative meaning of ‘school’. In the case of DQ, the AHP weight and order were the same, but the environmental and economic values were relatively low, and the result was different from AHP weight. For sub-indicators, the importance in DQ was highest in promoting mental health (0.136), followed by promoting physical health (0.085), ]cultivating character (0.082), social integration (0.072), and enhancing ecological sensitivity (0.071). After reviewing related experts, we came up with 5 evaluation indicators and 16 sub-indicators for school garden education service, which are objective evaluation indicators that enable quantitative comparison.
Conclusion
In the future, we will validate the socioeconomic values of school garden education services and contribute to revitalizing school gardens by establishing policy alternatives for effective operation and management of school gardens.
Introduction
School gardens take up a small space in cities that lack green areas, but they enable students to have various experiences and carry out urban farming (Jang, 2016). Recently, the vitalization of urban agriculture has increased all kinds of experience-based education in school gardens, and thus the importance of school gardens is increasing in terms of value. Moreover, school gardens, although they are small, serve as farmlands in the city that preserve the urban environment, providing space to recover the urban ecosystem and provide education that can chance the perception and attitude of future generations. Thus, there is a desperate need to develop an education-based agricultural experience service system using school gardens to investigate the effects of various activities in school gardens with the expanded base for urban agriculture. In this trend, deriving indicators for quantitative evaluation of school garden education service is important for activation of school garden education service, based on which it can contribute to increasing agricultural experience services. Nonetheless, studies on school gardens are limited to analysis on the current state of school gardens in metropolitan areas (AUAC, 2015; Jang & Oh, 2012; Paek, 2012) and educational functions, emotional and psychological changes (Hong and Kim, 2017; Kwack and Park, 2017; RDA, 2014; Cotugna et al., 2012), while very few studies aside from Hong et al. (2020) were conducted on comprehensive and objective valuation of agricultural experience service of school gardens.
Evaluation indicators are indicators that quantitatively and qualitatively present the achievement of performance goals intended to be attained when conducting a study, as well as tools to measure the accomplishment of goals or purposes pursued by a project (OGPC, 2015). According to Article 6-2 of the Framework Act on Government Performance Evaluation, indicators are to be set as objectively and quantitatively as possible to measure goal achievement, and when this cannot be done, they must be set in the form to assure this as much as possible. In other words, indicators must include core contents of performance goals and research projects, must not be set in minor or peripheral contents that considered only the ease of indicator development, and require separate efforts for development to ensure representativeness by benchmarking advanced countries or other cases and using specialized research agencies (OGPC, 2017). This study is a categorization and validation for systematic management of evaluation indicators developed in the previous study by Hong et al. (2020), and was conducted according to the valuation principles (OGPC, 2015) to solve the problem of input and output indicators that can be regarded as short-term performance by analyzing the reported indicators and come up with efficient management plans. Prior to the validation, this study rationally evaluated diverse values provided by school garden education service to improve the service and use the results in publicity for the purpose of contributing to the improvement of school garden education service. In addition, this study defined the value of school garden education service as the satisfaction or utility provided for the public and the stakeholders of school garden education service including students. Moreover, for simplicity and universality of terminology, this study referred to ‘valuation of education-based agricultural experience service using school gardens’ as ‘school garden education service’, set up principles for valuation based on literature review, and reviewed in what form the values are provided for the stakeholders of school garden education such as students, farm households, upstream and downstream industries, economically active population, and environment. Based on the above, this study derived improved evaluation indicators of school garden education service for each evaluation item and suggested sub-indicators to estimate them, thereby providing objective evaluation indicators that can be quantitatively compared.
Research Methods
Scope and contents
This study reset the indicators for valuation of school gardens we have proposed in our previous research. To review redundancies or conflicts among indicators after developing the list of evaluation indicators according to the purpose of evaluation in the previous indicators, we reviewed adequacy of the indicators by comparing the six requirements (RAIMBE) that match the ones in this study among the evaluation principles suggested in OGPC (2015) (Table 1).
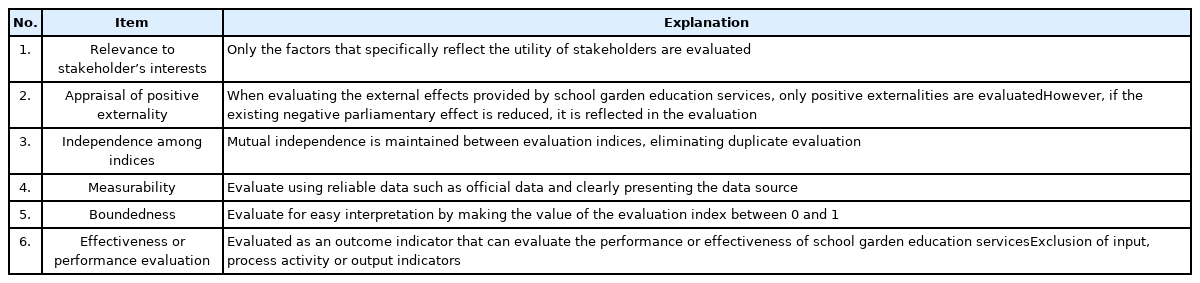
Valuation principles (OGPC, 2015)
Moreover, we compared the performance types (Table 2) suggested in previous studies (OGPC, 2017; RDA, 2014) with this study and reviewed the validity of the evaluation indicators, after which we calculated their weights based on the expert survey and derived the final evaluation indicators for school garden education service.

Classification of performance indicator types
Subjects and methods
The most important and difficult part of the Delphi method is to select the panel of experts (Lee, 2001). Anderson (1997) claimed that significant results can be derived from a small group of 10–15 experts. To verify the validity of the evaluation indicators for school garden education service, we decided that more extensive collection of opinions is necessary. Thus, we surveyed the opinions of total 20 experts that were engaged in work related to school gardens in the year this study was conducted, all in various fields such as the academia (offices of education, college professors, teachers related to agriculture and education), research institutes (Rural Development Administration, Korea Rural Economic Institute), field specialists (officials at Agricultural Technology Centers in each district), and policy experts (Ministry of Agriculture, Food and Rural Affairs, Korea Agency of Education, Promotion & Information Service in Food, Agriculture, Forestry & Fisheries, Ministry of Education). There was an equal number of male and female experts, evenly selecting 3 to 5 people from each field. 80% of them had at least 10 years of experience in work related to school gardens (Table 3).

Status of delphi panels on expert focus group
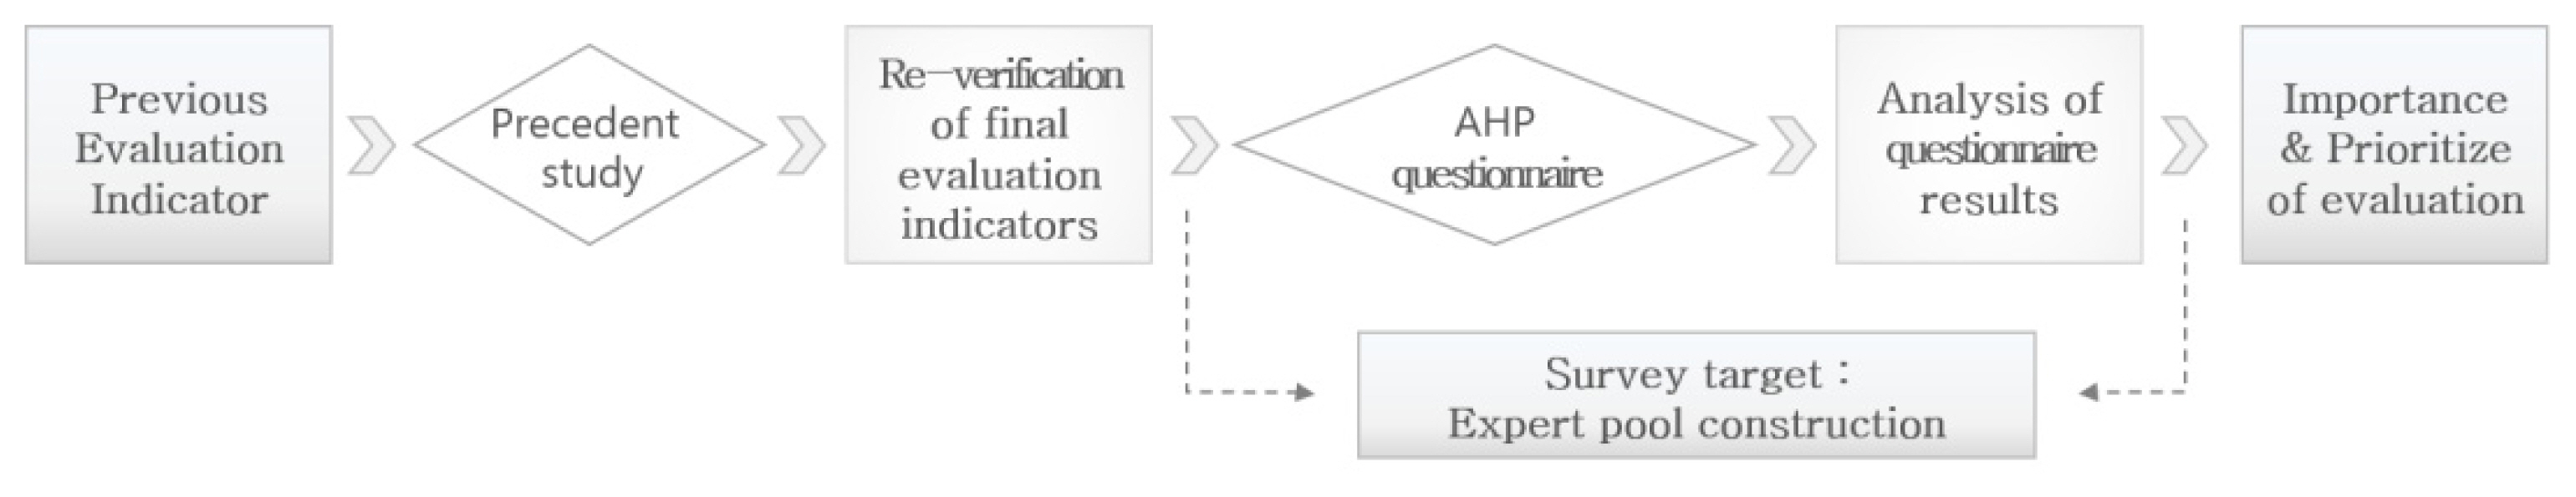
We obtained the contact information of experts engaged in school-related jobs and contacted them individually, after which we conducted a contactless survey from October 12 to 19, 2020 via email due to the prolonged COVID-19 pandemic. The survey items were in the form of pairwise comparison or direct response to derive weights from direct questions (DQ) and analytic hierarchy process (AHP). We collected the copies of the questionnaire and used the responses with the consistency ratio (CR) below 0.1 in the analysis using Expert Choice 2010. Moreover, we used the statistical technique of “direct questions” to predict the confidence interval of weights and determine the adequacy and presented as the complementary value of AHP weights. The experts were surveyed to calculate the weights, after which we surveyed the career experiences in the relevant field aside from their expertise as well as gender. Finally, we presented the importance of weights among factors of each evaluation item and prioritized the evaluation indicators of each item through AHP pairwise comparison of alternatives (Fig. 1).
Research method on this research.
Results and discussion
Deriving problems of existing evaluation indicators
As a result of comparing the evaluation indicators for school garden education service suggested in our previous report by performance type (Lee et al., 2014) and OGPC (2015) evaluation principles, we could find the following problems.
First, there was the adequacy issue of the indicators due to lack of evaluation purpose, object, and setting of evaluation principles necessary for rational and clear evaluation indicators. There was insufficient setting of a clear relationship between stakeholders and effects regarding for whom the effects presented in the indicators are provided, thereby violating the principle of the relevance to stakeholders’ interests.
Second, result indicators must be presented in terms of valuation of school garden education service, but many of the indicators had the character of input or process/activity indicators, thereby not properly presenting result indicators. In particular, most sub-indicators such as promoting agricultural awareness, improving eating habits, and future value of agricultural products were close to input, process, and activity indicators, thereby showing an issue in indicator setting.
Third, indicators in different dimensions were evaluated as the same dimension, thereby violating the principle of independence. In other words, there are three sub-indicators of health values such as promoting physical health, improving eating habits, and promoting mental health; and considering that physical and mental health are promoted as a result of improving eating habits, improving eating habits and promoting physical and mental health cannot be evaluated as the same dimension.
Fourth, there were indicators with similar characteristics, thereby violating the principle of independence. For example, sub-indicators of educational values such as improving social skills and activating the community were similar in character, and thus using these indicators simultaneously raised the concern of redundant evaluation.
Fifth, detailed indicators failed to embrace the concept of sub-indicators. In other words, beautifying landscape was included in the sub-indicators of ecological/environmental values, but beautifying landscape is not included in the general ecological/environmental values, thereby violating the principle of valuation.
As such, the precedent study that presented various indicators of school garden valuation had limitations in that it evaluated different dimensions of competition in the same dimension or evaluated only parts of the indicators without distinguishing the competitiveness unlike the report by Lee et al. (2014) that divided them into the causal structure of ‘result-cause-base’. Some evaluation indicators could not obtain objectivity and reliability, because survey results on experts or internal data that is not accessible from the outside were used (Table 4).

Problems of existing evaluation indicators according to performance type and evaluation principles
Classifying the elements of value by stakeholder of school garden education service
Based on the theoretical grounds of previous studies (Hong and Kim, 2017; Jang et al., 2017; Kwack and Park, 2017; Kelmmer et al., 2015; Jeong and Lee, 2013; Cotugna et al., 2012; Green growth committee, 2012; Moon et al., 2012; Paek, 2012; Kim and Jeong, 2008; Morris et al., 2000), we classified stakeholders related to school gardens into students, farm households, upstream and downstream industries, economically active population, and environment, and summarized the elements of value with the help of experts. Students are classified into health, education, and culture/welfare: health was classified into promoting physical health and promoting mental health; education into improving learning ability, cultivating character, improving social skills, cultivating agricultural literacy, and enhancing ecological sensitivity; and culture/welfare into enhancement of amenities that includes landscape improvement and cultural benefits, and social integration that includes gardening activities to alleviate discomfort among students and promotion of the awareness of the socially disadvantaged. Farm households are classified into income from sales to increase income of farm households, and increased consumption of domestic agricultural products by improving eating habits and promoting understanding of agriculture. Upstream and downstream industries are represented by increasing the added value of the upstream and downstream industries by increasing farm household income and providing materials necessary for creation and maintenance of gardens. Economically active population is classified into job creation to create and maintain gardens and job creation in the upstream and downstream industries according to the industry ripple effect. Environment is classified into improving environmental quality, mitigating climate change, and promoting biodiversity (Table 5).
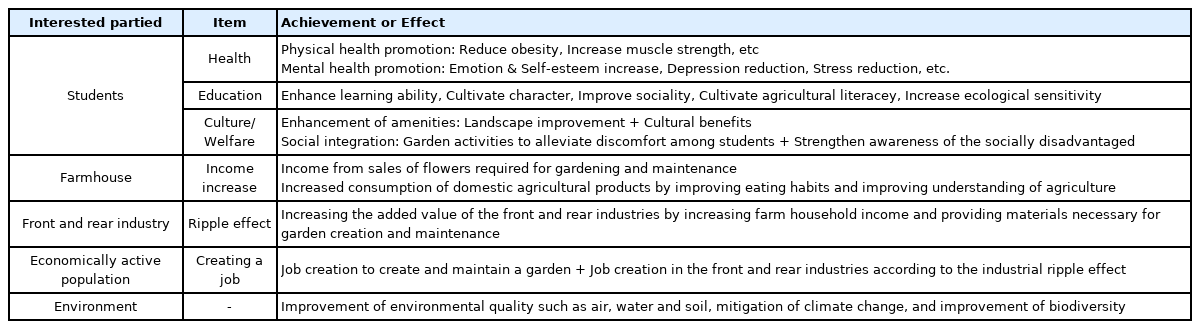
Performance or effectiveness of school garden education services by stakeholder
Suggesting evaluation indicators for school garden education service
After deriving the problems of the previous indicators according to performance types and evaluation principles, we added ‘welfare values’ to the 4 existing values based on relevant data research and expert validation. We simplified the ecological/environmental values into environmental values, selecting 5 value indicators such as x1 (educational values), x2 (health values), x3 (welfare values), x4 (economic values), and x5 (environmental values). For detailed indicators of each value, we constructed 5 indicators for educational values such as y1 (improving learning ability), y2 (cultivating character), y3 (improving social skills), y4 (cultivating agricultural literacy), and y5 (enhancing ecological sensitivity); 2 indicators for health values such as y6 (promoting physical health) and y7 (promoting mental health); 3 indicators for welfare values such as y8 (landscape value), y9 (enhancing cultural benefits), and y10 (social integration); 3 indicators for economic values such as y11 (increase in farm household income), y12 (industry ripple effect), and y13 (job creation); and 3 indicators for environmental values such as y14 (improving environmental quality), y15 (mitigating climate change), and y16 (promoting biodiversity), ultimately suggesting 5 values and 16 detailed indicators (Table 6). This is similar to the factors related to school gardens surveyed among teachers and parents in a report by the RDA (2014).

Value and evaluation item for school garden education service on this research
Relative importance and order of priority among factors through AHP
Consistency ratio results
Consistency of the pairwise comparison matrix is considered favorable when the consistency ratio (CR) is lower than 0.05 or 0.1 according to the rule of thumb. As a result of calculating the AHP consistency ratio, experts meeting the CR requirement lower than 0.1 were as follows: 6 experts for value indicators, and among detailed indicators, 8 for educational values, 19 for health values, 8 for welfare values, 11 for economic values, and 10 for environmental values. The means of the responses by experts that meet the consistency requirements applied to AHP weights are as shown in Table 7.
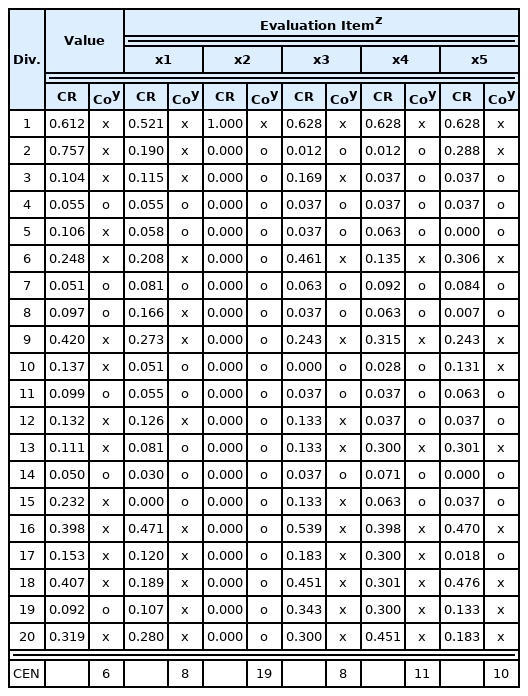
AHP consistency ratio calculation result
Relative importance and order of priority of the value criteria
The value criteria of detailed indicators indicate the weights of detailed indicators when the sum of the weights of each detailed indicator is 100%, and the total criteria indicate the weights of detailed indicators when the sum of the weights of all detailed indicators is 100%. In the scientific decision making methodology, the importance of value indicators of AHP weights was in the order of educational values (0.544) > health values (0.182) > welfare values (0.164) > environmental values (0.062) > economic values(0.049), showing that the importance of educational values was much higher than other value indicators, and environmental and economic values were considered relatively low under 0.1. The importance od detailed indicators of DQ weights was in the order of educational values (0.330), health values (0.221), welfare values (0.180), environmental values (0.117), and economic values (0.153), showing the same order as AHP weights. The importance of educational values was considered much higher than other detailed indicators, but the gap was not as big as AHP weights. On the other hand, environmental and economic values showed relatively low importance, but it was higher than 0.1, showing a different result from AHP weights (Table 8). This result is similar to the study by Hong et al. (2020), due to the expression of change to increase the educational effect based on collective life and the con notative meaning of ‘school’. Moreover, the report by RDA (2014) on school gardens also showed that the motivation for participation or expected outcome was highest for educational purpose and mental health and lowest for environment, but there was a gap from the opinion that the environmental effect is most important in terms of effect analysis.

Relative importance and priority of the value
Relative importance and order of priority of detailed indicators in the value criteria
(1) Relative importance and order of priority of each value criterion
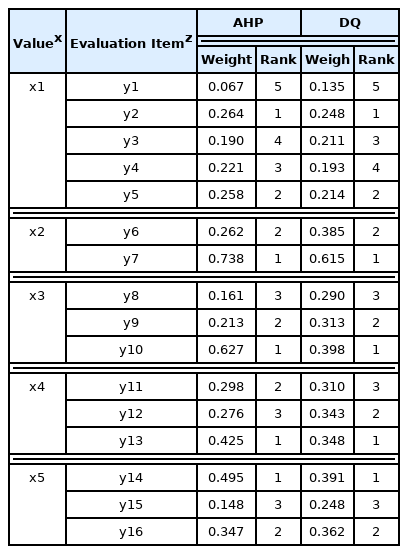
For relative importance and order of priority of detailed indicators in educational values, the importance in AHP was in the order of cultivating character (0.264) > enhancing ecological sensitivity (0.258) > cultivating agricultural literacy (0.221) > improving social skills (0.190) > improving learning ability (0.067), and DQ in the order of cultivating character (0.248) > enhancing ecological sensitivity (0.214) > improving social skills (0.211) > cultivating agricultural literacy (0.193) > improving learning ability (0.135), showing that the order was the same except improving social skills and cultivating agricultural literacy. This result is the same as the study by the RDA (2014) claiming that school gardens are the most important for cultivating character. For health values, the importance in both AHP and DQ was in the order of promoting mental health(0.738, 0.615) > promoting physical health (0.262, 0.385), showing the same result as the RDA (2014). For welfare values, the importance was in the order of social integration (0.627, 0.398) > enhancing cultural benefits (0.213, 0.313) > landscape value(0.161, 0.290). For economic values, the importance in AHP was in the order of job creation (0.425) > increase in farm household income(0.298) > industry ripple effect (0.276), and DQ in the order of job creation (0.348) > industry ripple effect(0.343) > increase in farm household income(0.310), showing that job creation was considered most important, which is the same result as the study by Lee (2017). For environmental values, the importance in both AHP and DQ was in the order of improving environmental quality (0.495, 0.391) > promoting biodiversity (0.148, 0.362) > mitigating climate change(0.148, 0.248), all securing consistency (Table 9).
Relative importance and priority of each evaluation items by value
(2) Overall importance and order of priority of detailed elements
The AHP importance of overall evaluation indicators was highest in cultivating character (0.144), followed by enhancing ecological sensitivity (0.141) > promoting mental health (0.134) > cultivating agricultural literacy (0.120) > improving social skills (0.104), showing that educational values generally had priority. Mitigating climate change in environmental values was the lowest (0.009). The importance in DQ was highest in promoting mental health (0.136), followed by promoting physical health (0.085), cultivating character(0.082), social integration(0.072), and enhancing ecological sensitivity (0.071), showing quite a difference between the two analyses. The lowest were mitigating climate change (0.009, AHP analysis) and increase in farm household income (0.036, DQ analysis) (Table 10). This result is different from the study by Lee (2017) who valuated urban agriculture, which is due to the limited space of ‘school’ and participants as well as educational purpose.

Overall importance and priority of each evaluation items
Conclusion
Recently, the vitalization of urban agriculture has increased various forms of experience-based education using school gardens, which raised the importance of school gardens in terms of value as well as the need to develop an implementation system for education-based agricultural experience service using school gardens. Keeping pace with this trend, we reset the evaluation indicators from previous research to establish objective evaluation indicators that enable quantitative comparison of school garden education service. We evaluated the relative importance and order of priority among the factors through AHP pairwise comparison of alternatives and came up with the following results.
First, we analyzed the problems of the previous indicators by categorizing the performance indicators and comparing and verifying them with six requirements of valuation. Then, we added ‘welfare values’ and selected 5 value indicators such as education, health, welfare, economy, and environment, and constructed total 16 sub-indicators: improving learning ability, cultivating character, improving social skills, cultivating agricultural literacy, enhancing ecological sensitivity (hereinafter ‘educational values’), promoting physical health, promoting mental health (hereinafter ‘health values’), landscape value, enhancing cultural benefits, social integration (hereinafter ‘welfare values’), increase in farm household income, industry ripple effect, job creation (hereinafter ‘economic values’), improving environmental quality, mitigating climate change, promoting biodiversity (hereinafter ‘environmental values’).
Second, experts that satisfied the consistency ratio (CR < 0.1) of the suggested evaluation indicators were as follows: 6 experts for value indicators, 8 for educational values, 19 for health values, 8 for welfare values, 11 for economic values, and 10 for environmental values.
Third, the importance of value indicators in AHP was in the order of educational values (0.544), health values(0.182), welfare values (0.164), environmental values (0.062), and economic values (0.049), showing that the importance of educational values was considered much higher than other value indicators, while the importance of environmental and economic values was relatively low under 0.1. The importance of sub-indicators was highest in cultivating character (0.144), followed by enhancing ecological sensitivity (0.141) > promoting mental health (0.134) > cultivating agricultural literacy (0.120) > improving social skills(0.104). Educational values generally showed priority, and mitigating climate change in environmental values was lowest (0.009). This can be regarded as the expression of change to increase the educational effect based on collective life and the connotative meaning of ‘school’.
Fourth, the importance in DQ was in the order of educational values (0.330), health values (0.221), welfare values(0.180), environmental values (0.117), and economic values (0.153), showing the same order as AHP. The importance of educational values was considered much higher than other value indicators, but there was not as much gap as in AHP. On the other hand, the importance of environmental and economic values was relatively low but higher than 0.1, showing a different result from AHP. For sub-indicators, the importance in DQ was highest in promoting mental health (0.136), followed by promoting physical health (0.085), cultivating character (0.082), social integration (0.072), and enhancing ecological sensitivity (0.071), and increase in farm household income was the lowest (0.036).
This study presented categorization and indicator plans for systematic management of evaluation indicators developed in the previous study, and was conducted to derive plans to solve the problem of input and output indicators that can be regarded as short-term performance by analyzing the indicators that are currently in use and efficiently managing the indicators. In the future, we intend to directly apply the selected evaluation method to the study areas of school gardens and validate the socioeconomic values of school garden education service by analyzing the results. This will contribute to promoting the use of school gardens by establishing policy alternatives for effective operation and management of school gardens.
Acknowledgements
This study is funded by the Rural Development Administration Project (PJ01364403).
