


Introduction
Most human activities occur in closed spaces filled with chemically diverse and complex air components. People spend an estimated 90% of a day (24 h) in indoor environments such as home, workplace, school, and public transportation (Pan et al., 2018). Because people spend most of their time indoors, the health risks due to indoor air pollution are greater than those due to exposure to external pollutants (Cincinelli and Martellini, 2017). People working or studying indoors may experience mild symptoms (e.g., fatigue, headache, and eye irritation) to severe effects (e.g., dyspnea, allergic reactions, and worsened asthma) because of pollutants (Brook et al., 2010; Environmental Protection Agency, 2009). The World Health Organization (WHO European Centre for Environmental and Health, 2010) said that indoor air quality would be an esssential determinant of healthy life and people's well-being..
Indoor air quality is affected by various causal factors such as the inflow of contaminated outdoor air, interactions among occupants, the composition of buildings, furniture, and the types of work performed indoors (Nazaro, 2016). These factors worsen the indoor air quality if adequate levels of temperature, humidity, air circulation, and ventilation systems are not provided and eventually have a considerable influence on the quality of life and productivity of indoor occupants. Therefore, creating a safe and comfortable indoor environment is an essential responsibility of building owners and managers.
Schools are where teachers, students and educational personnel spend most of their time. Consequently, various indoor pollutants such as allergens, particulate matter, and volatile organic compounds in the classroom not only deteriorate the health of students and educational personnel (Simoni et al., 2010) but also affect studentsŌĆÖ performance and their learning outcomes (productivity) directly or indirectly (Lee et al., 2012; Mendell and Heath, 2005; Sarbu & Pacurar, 2015; Wargocki and Wyon, 2017). Attention is a cognitive and psychological mechanism for students to perform optimally; therefore, scholars have studied the indoor factors that influence studentsŌĆÖ attention (Heath and Mendell, 2002). Shan et al. (2018), through research on the air quality of school buildings, showed that poor indoor air in school buildings can negatively affect studentsŌĆÖ cognitive abilities.
Accordingly, it has been suggested to reduce the adverse impact of air pollutants on the health and academic achievement of students and improve the indoor air quality in the classrooms by installing appropriate ventilation systems in the classrooms. In 2013, Polidori and his colleagues reduced air pollutants in classrooms by 90%ŌĆō96% after installing air conditioners with high-performance filter systems in nine classrooms in California (Polidori et al., 2012). Moreover, Martenies and Batterman (2018) reported that the incidence of asthma in children was reduced by 13%ŌĆō16% by simply installing a filter in the classroom that could reduce particulate matter (PM)2.5, which indicates the importance of an adequate ventilation system. However, Ko and Han (2018) raised safety issues due to chemical substances when utilizing a ventilation system such as a mechanical air conditioner. Therefore, the demand for a more sustainable air purification method was raised.
Plants are considered safe alternatives for air purification because they are environmentally friendly, sustainable, and remove indoor air pollutants. Several studies on optimizing the air purification performance of plants in connection with the air-conditioning systems have been conducted (Fraser et al., 2017; Irga et al., 2017; Llewellyn et al., 2008; Paull et al., 2018). Moreover, other studies also showed that the filtering function of plants could reduce indoor pollutants (e.g., formaldehyde, toluene, and benzopyrene) (Irga et al, 2017; Kwon and Park, 2017; Lee et al., 2015; Pettit et al., 2017). This plant purification system is called ŌĆ£Plant-assisted Biotricking Filters (PBTFs)ŌĆØ (Soreanu et al., 2013).
Although the usefulness of plants to remove indoor air pollutants has been reported, studies that objectively evaluate the degree of air purification and its impact on the human body of the system were insufficient. Therefore, this study aimed to measure the change of indoor air quality by constructing a plant-based biofilter system in the classroom and to evaluate the satisfaction level of the students regarding the indoor air quality of the learning space. Additionally, this study was intended to analyze the plant-based biofilter systemŌĆÖs impact on studentsŌĆÖ health and the change of their attentiveness that affects studentsŌĆÖ learning outcomes.
The specific objectives of this study are as follows:
to analyze changes in indoor air quality before and after the application of the plant-based biofilter system;
to examine the perceptions of students about changes in indoor air quality before and after the application of the plant-based biofilter system;
to assess the health effects perceived by students before and after the application of the plant-based biofilter system; and
to measure the attentiveness of students before and after the application of the plant-based biofilter system subjectively and objectively.
Research Methods
Participants
After the announcement of the recruitment of research participants on campus, a total of 14 students (6 Male, 8 Female) participated in the study. The study subjects participated in a 2 h program in a classroom equipped with a plant-based biofilter system and completed questionnaires before and after system operation.
Ethical considerations
The study was approved by the Institutional Review Board (IRB No: SMUIRB 2018-001). We explained the experiment process by verbal and obtained written consent from all participants. During the experiment, the volunteer participants were provided with extracurricular activities and informed that they could quit at any time if they did not want to.
Study design
This study used the one-group pre- and post-test design to analyze the effects of the operation of the plant-based biofilter system on indoor air quality, studentsŌĆÖ perception of indoor air quality, health effects, and subjective and objective attentiveness (Table 1). Although the one-group pre-and post-test design has the disadvantage of not being able to identify the effects of exogenous variables, it is used in cases where it is difficult to establish a control group and randomize it.
The experiment was conducted for 2 h, and the participants performed extracurricular activities for the first hour without the plant-based biofilter system operation, and for 1 h after that, they performed extracurricular activities with the plant-based biofilter system running. As for the measurement, 1 h after the start of the experiment, the indoor air quality (i.e., temperature, humidity, and PM2.5 and PM10) and the objective attentiveness of students were measured and the perception of indoor air quality, health effects, and subjective attention were surveyed by questionaire as pre-test. After 1 h of operating the system, the indoor air quality (i.e., temperature, humidity, and PM2.5, PM10) and the objective attentiveness of students were measured and the perception of indoor air quality, health effects, and subjective attention were surveyed as a post-test. Measurements and questionnaires conducted at 1 h intervals could cause testing effects owing to repeated measurements. However, it was conducted to understand the improvement effects due to system operation.
Study area and plant-based biofilter system
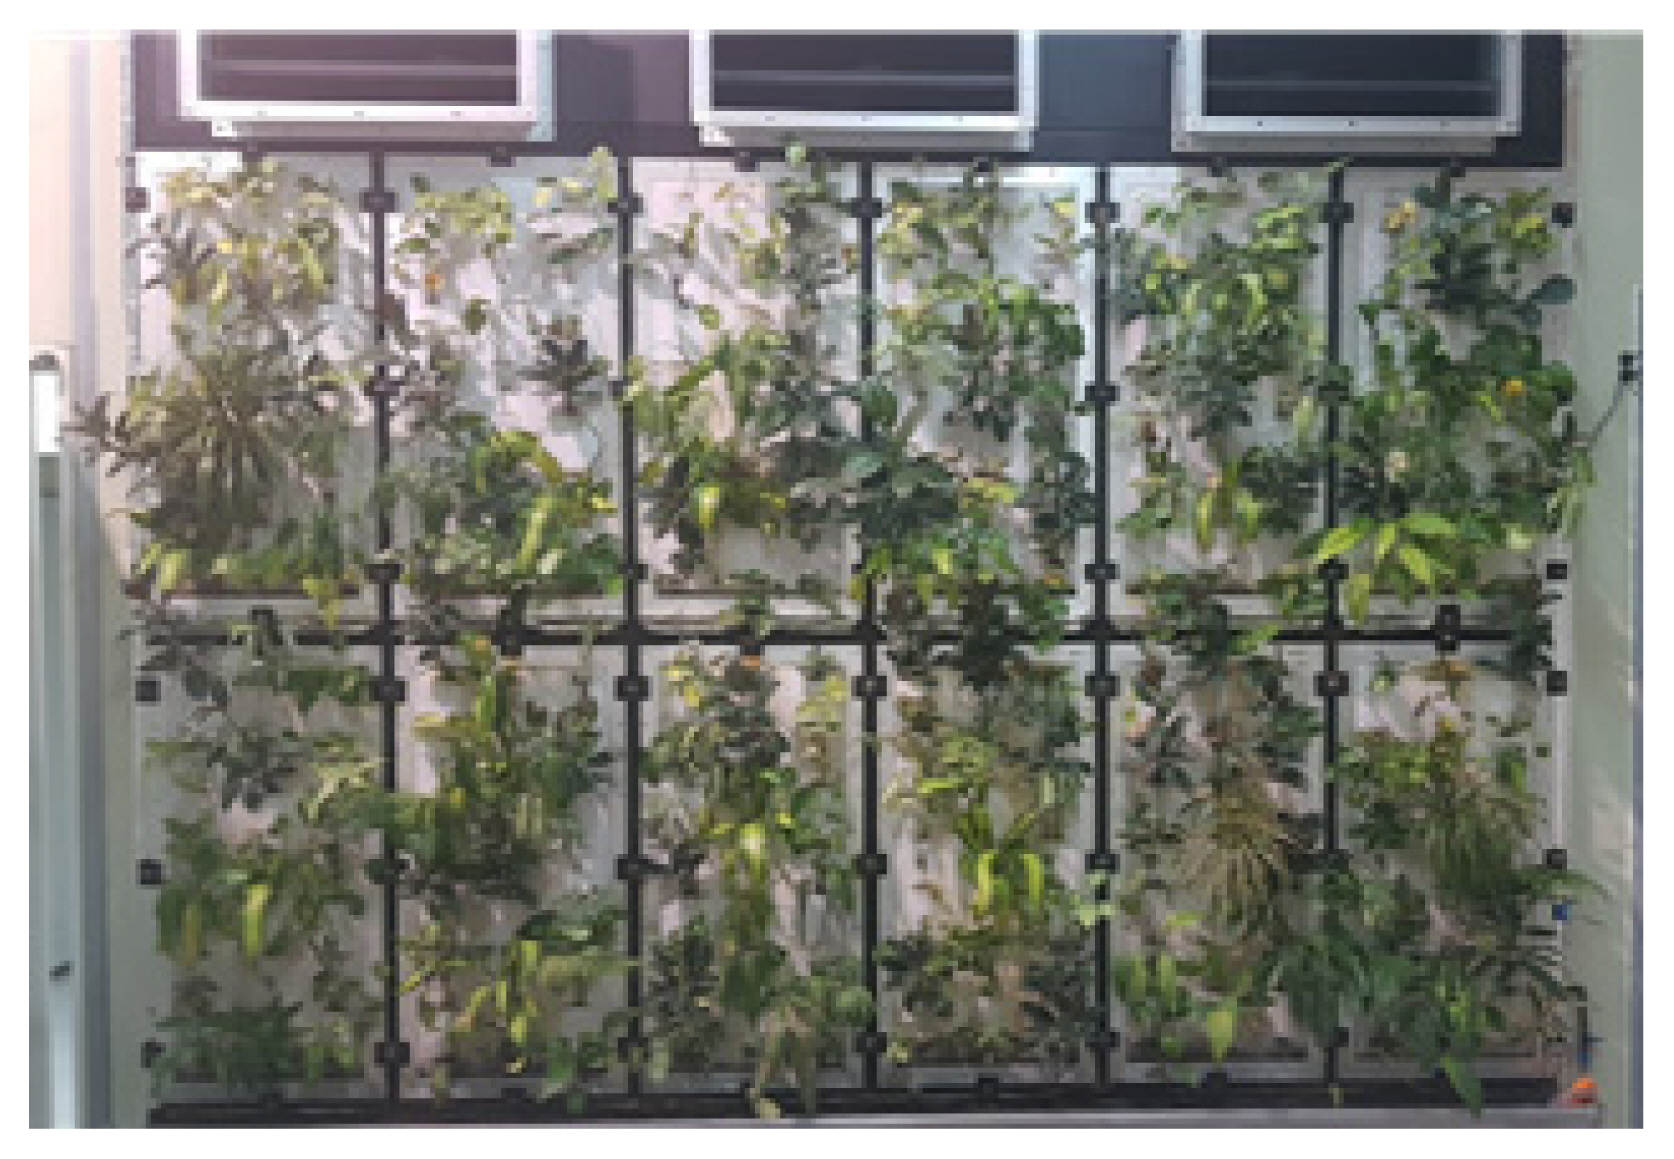
The plant-based biofiler system used in this study is a vertical hydroponic cultivation apparatus comprising 12 panels. It is designed to purify polluted indoor air through a filter (surface area = 6 m2). Each unit panel has a multi-layered structure with three layers of 50-mm filters. In this study, 288 air-purifying plants (24 species), including Hoya carnosa, Ficus elastica, and Epipremnum aureum, selected by Kim et al. (2018) were planted. The classroom, in which the system was installed, was finished with a gable roof and had space for 20 seats with a floor area of 52.8 m2 and a volume of 332.73 m3.
A water storage tank for irrigation was incorporated at the bottom of the plant-based biofilter system installed on the right inner wall of the classroom (Fig. 1). It supplied 55.80 1 /min of water to the top of the panel by a pressurized inverter pump, and it was connected to a control unit that could be used to set the irrigation cycle. A fan equipped with a low-noise EC motor (single phase/220 V, 1850 rpm, 0.5 kW) providing static pressure of 200 Pa, up to 2,000 m3/h air-conditioning performance, was installed at the top of the biofilter. It maintained the panel filtration wind speed between 0.1 and 0.3 m/s. It was designed to supply the filtration wind volume between 2,160 and 6,480 m3/h, while securing the stability of plants.
Indoor air quality measures
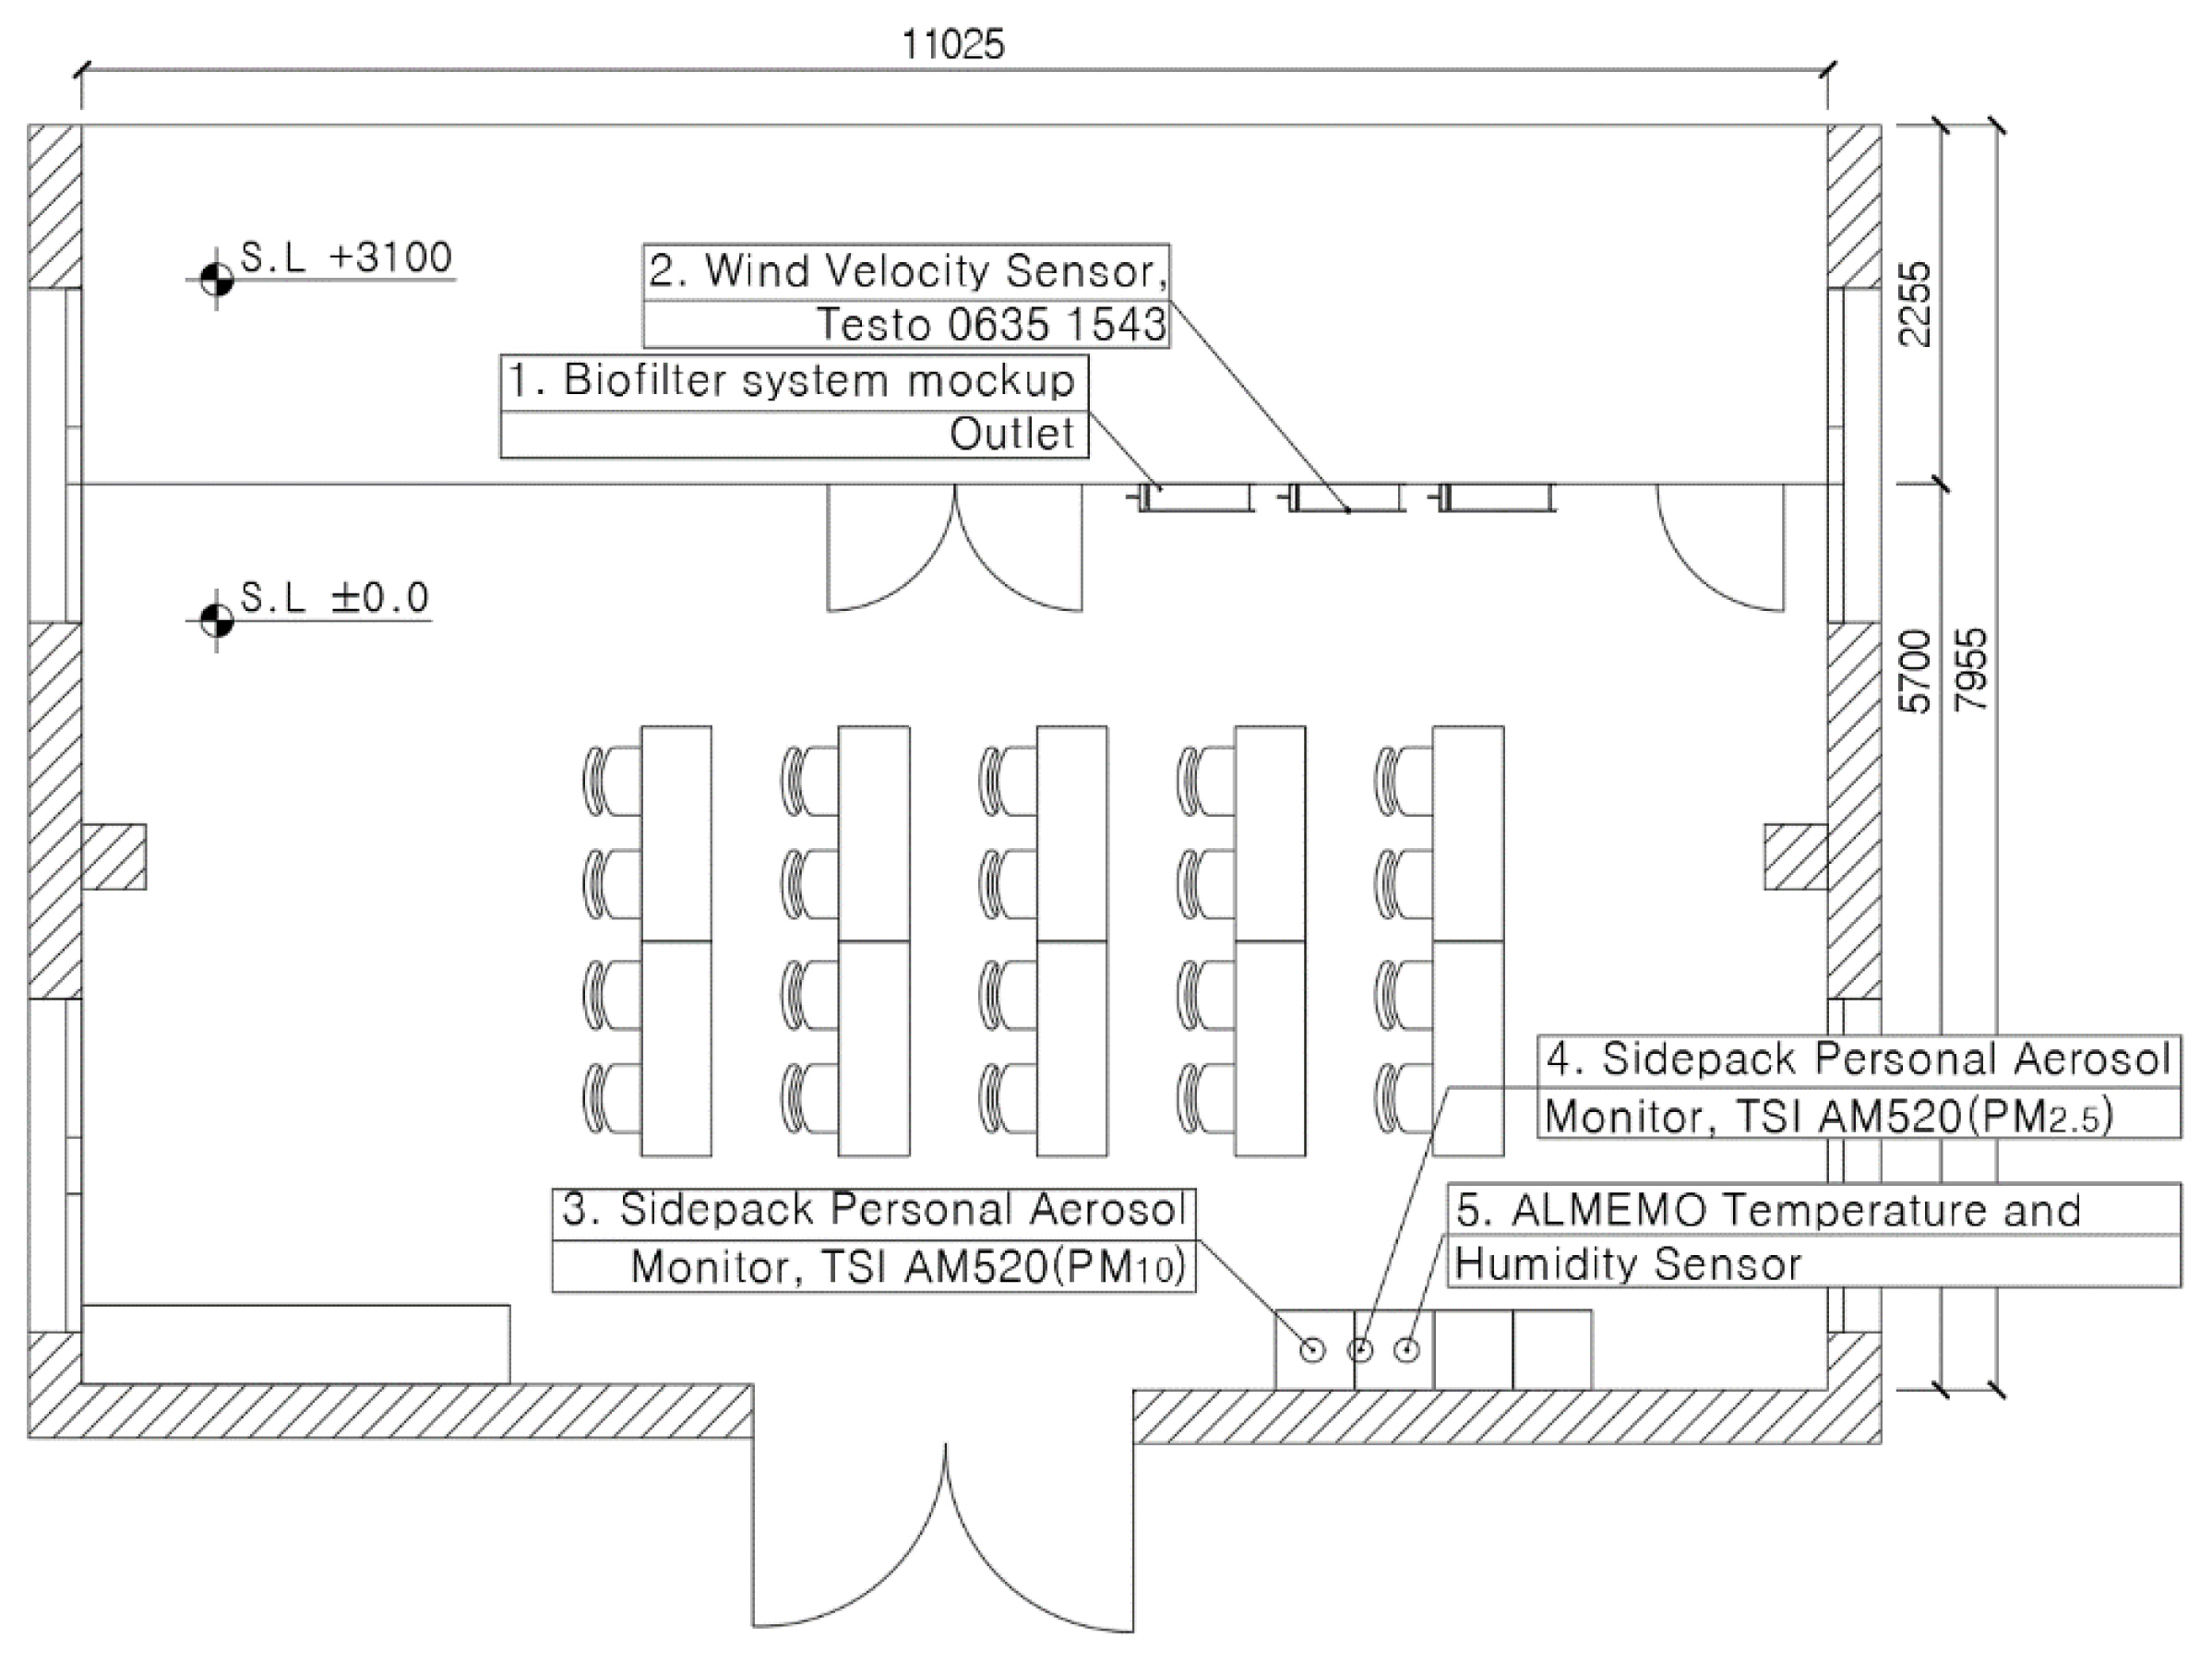
To evaluate the indoor air environment, an environmental monitoring infrastructure allowing time-series measurement was established (Fig. 2). First, the wind speed was measured by installing a hot wire wind speed probe (Testo 0635 1543, Testo, Germany) at the center of the blowhole located in the middle of the plant-based biofilter system to measure the amount of indoor ventilation. Moreover, two particle counters (AM520, TSI, USA) and a temperature and humidity sensor (ALMEMO, Germany) were installed on the right wall of the entrance of the classroom to measure the changes in indoor particulate matter concentration, temperature, and humidity due to system operation. Monitoring was conducted from 5pm to 7pm on December 11, 2019 in the same time as the active time of the participants, and the biofilter system was operated from 6pm to evaluate the effects on the participants according to whether or not the system is operated.
The infrastructure for monitoring the performance according to the operation of the plant-based biofilter system can be organized as follows (Table 2). The infrastructure was set up to monitor particulate matter, indicating indoor air quality, classified into PM2.5 and PM10, and temperature and humidity affecting indoor comfort in a time series. The particle counter was installed 1.5 m above the ground by referring to the air purifier national standard [KS C 9314:2013] and detected particles. Moreover, the wind speed measured over time with a probe installed at the central blowhole at the top of the system was converted into air-conditioning air volume using the duct air volume measurement method [SAREK A101-2011]. Monitoring was conducted on December 11, 2019, and all openings were closed during the experiment to minimize indoor air changes that could occur because of internal and external atmospheric exchanges.
Questionnaire
The questionnaire composed of general characteristics, perception of indoor air quality, health effects, and subjective and objective attentiveness.
General characteristics
The general characteristics included gender and age, and the health status consisted of questions asking the participants whether they smoke, have any disease history, and perceived health status, which were known to affect overall health.
Perception of indoor air quality
The perception of the occupants about indoor air quality was composed of items to measure the awareness of subjects about ŌĆ£air ambient,ŌĆØ ŌĆ£air odor,ŌĆØ and ŌĆ£freshness of the air.ŌĆØ These items were measured on a 5-point scale range from ŌĆ£very good (5 points)ŌĆØ to ŌĆ£very bad (1 point).ŌĆØ In this study, the mean value was calculated for each item and the reliability was .771.
Health effects
The health effects of indoor air on the occupants was measured twice by the structured questionnaire, while they participated in 2 h of extracurricular activities in the experimental environment. Health effects was composed of 22 questions about discomfort in the head, face, eyes, respiratory system, skin, and whole body. Participants were supposed to answer between ŌĆ£very severe (5 points)ŌĆØ and ŌĆ£not feeling at all (1 point).ŌĆØ
Subjective and objective attentiveness
Subjective attentiveness was evaluated using a tool developed by Kim (2006), which uses a 5-point scale range from ŌĆ£very much (1 point)ŌĆØ to ŌĆ£not at all (5 points).ŌĆØ A higher point indicates a higher level of attentiveness. The reliability was .96 at the time of development, and the reliability coefficient in this study was .901. Objective attentiveness was measured using a tool that standardized the Frankfurt Attention Inventory (FAIR) test developed by Moosbrugger and Oehlschlaegel of Germany into a form usable in South Korea (Oh, 2002). The FAIR test is used to measure cognitive efficiency and mental processing speed. The test can measure three types of attention. The first is selective attention (P). It refers to the ability to preferentially process a specific stimulus while ignoring the disturbing stimulus by how much information is handled correctly, defeating the disturbing stimulus at a given time. The second is self-control (Q). The ability to accurately handle multiple problems required at the same timeframe by distributing appropriate attention among multiple competitive target stimuli with the accuracy and quality of attention. The third is sustainability attention (C). When attention needs to be focused, how long the persistence is maintained. It refers to the ability of providing continuous attention when the stimulus is maintained for a certain period. The FAIR test first measures whether the examinee has a correct understanding of the question and then calculates the attention rating index. When the ŌĆ£mark value (M)ŌĆØ is less than 0.95, there is a possibility that the participant may have insufficient language comprehension or language ability. In this study, the participantsŌĆÖ understanding index (M) was confirmed to have fully understood the test instructions with an average of 1.00 (0.99ŌĆō1.00), and after that, the P, Q, and C values were calculated.
Data analysis
First, the frequency, percentage, mean, and standard deviation of general characteristics, perception of indoor air quality, health effects, and subjective and objective attentiveness were calculated using descriptive statistics. The pre- and post-experimental effect tests on the main variables were analyzed using Wilcoxon signed ranks test (Z), considering that the number of subjects was less than 30 and some variables did not meet the normality assumptions. The statistical significance was decided at p < .05, and the collected data were analyzed using the SPSS 25.0 software package.
Results and Discussion
Indoor air quality
Temperature and humidity
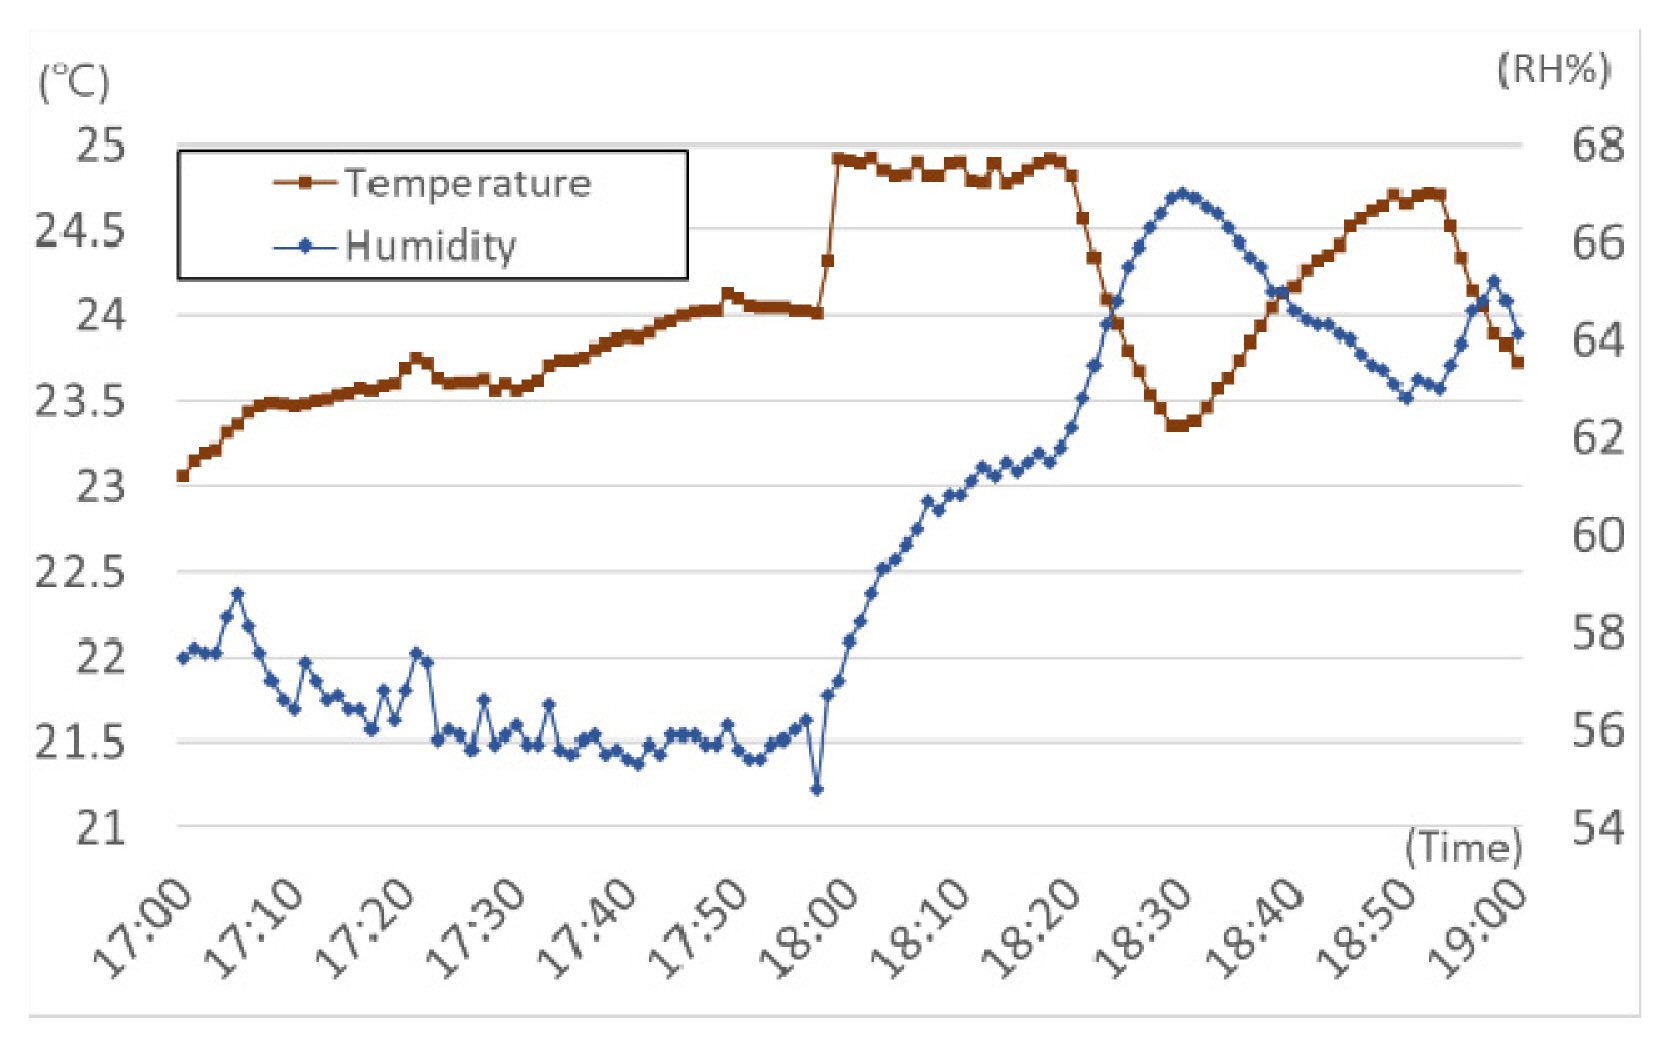
The temperature (T) and relative humidity (RH) of indoor air before and after the system operation during the entire measurement period are presented in Table 3 and Fig. 3.
The outdoor data derived from the open access statistics of the Korea Meteorological Administration was measured at a weather station - 12.8 km from the university. Before starting the plant-based biofilter system, temperature and humidity were measured every minute for 1 h from 5 PM to 6 PM. The average indoor temperature for 1 h was 23.7┬░C and average humidity was 56.3%. The plant-based biofilter system was operated after 1 h from the beginning of the experiment. The system was operating for 1 h, and indoor temperature and humidity were measured every minute. The average indoor temperature and humidity for 1 h owing to the operation of the system were 24.4┬░C and 63.3%. As a result, temperature and humidity owing to the operation of the system increased by 2.9% and 12.4%, respectively.
In the classroom environment, temperature is a critical factor that affects studentsŌĆÖ performance and well-being (Singh et al., 2017; Wargocki and Wyon, 2017). Liu et al.(2016) investigated studentsŌĆÖ perception regarding the comfort temperature in university classrooms and reported that satisfaction with indoor air quality changed according to the room temperature. Moreover, the comfort of temperature plays a vital role in the productivity of people staying in an indoor environment, and discomfort can decrease productivity (Canadian Center for Occupational Health and Safety, 2020; Al horr et al., 2016; Rupp et al., 2015; Haverinen-Shaughnessy and Shaughnessy, 2015; Tanabe et al., 2007). Fisk et al. (2003) argued that the room temperature suitable for human to work was 21┬░CŌĆō25┬░C, and productivity decreased by 2% for every 1┬░C increase above 25┬░C. The preferred temperature varies widely among people, and there is no single temperature satisfying everyone. Nevertheless, too high a temperature in an office makes occupants feel tired, while too cold a temperature makes occupants unstable and easily distracted. According to CSA Z412-17 Office Ergonomics (CSA Group, 2017), the optimal indoor temperature is 24.5┬░C (23┬░CŌĆō26┬░C) in summer and 22┬░C (20┬░CŌĆō23.5┬░C) in winter under 50% RH and air current of < 0 . 15 m/s. The temperature of this studyŌĆÖs classroom was 23.7┬░CŌĆō24.4┬░C, which was an environment suitable for students to study.
In this study, after the application of the plant-based biofilter system, the humidity increased from 56.3% to 63.3%. The rate was within the increase rate in RH of the activated carbon-based plant air filtration system (Wang and Zhang, 2011). The controversy over the perception of indoor air humidity and air quality and their effects on health has continued for a long time (Wolkoff, 2018). Discomfort due to irritation to the eyes and upper respiratory tract is a symptom that is typically caused by the dry air environment of an office (Bluyssen et al., 2016; Brightman et al., 2008; Wolkoff, 2013). Angelon-Gaetz et al. (2016) had 122 teachers report their daily symptoms in the form of a journal for 4ŌĆō12 weeks. The study revealed that respiratory (asthma-like) symptoms increased, yet not significant, when the humidity was 30% or less or 50% or more. Lukso et al. (2016) conducted a medical examination after having 7,637 office workers working in 12 buildings to wear a personal trap for 4 weeks and reported that symptoms of the upper and lower respiratory tracts significantly worsened at low humidity. Bakke et al. (2008) investigated the precorneal tear film (PTF) stability, nasal patency, and inflammatory markers of nasal lavage fluid of employees working in four university buildings. As a result, there was no change in symptoms when the humidity was low (15%ŌĆō35%), but when the humidity increased, the PTF value was significantly improved and the awareness of the dryness of the air decreased. Wang et al. (2017) reported that 7% of the participants felt discomfort at 50% humidity, but 48% of them felt displeasure when the humidity decreased to 45%. Increasing humidity to an appropriate level influences the positive perception of air quality, relieves eye symptoms, and improves work performance and sleep quality (Fisk et al., 2003). However, there are few studies on the effects of high humidity on peopleŌĆÖs perception and health. When RH is 70% or higher, water vapor is condensed on the surface, equipment, and inside building structures; when they are untreated, mold grows. Additionally, high humidity makes people feel suffocated. The Health and Safety Executive of the UK (2019) reported that the appropriate RH is between 40% and 70%. In this study, humidity increased from 56.3% to 63.3% after applying the plant-based biofilter system. Although the RH in this study met the criteria of HSE, it may cause discomfort to people even when the humidity is high, so the need to improve the increase in humidity due to the application of the system was raised.
PM2.5, PM10
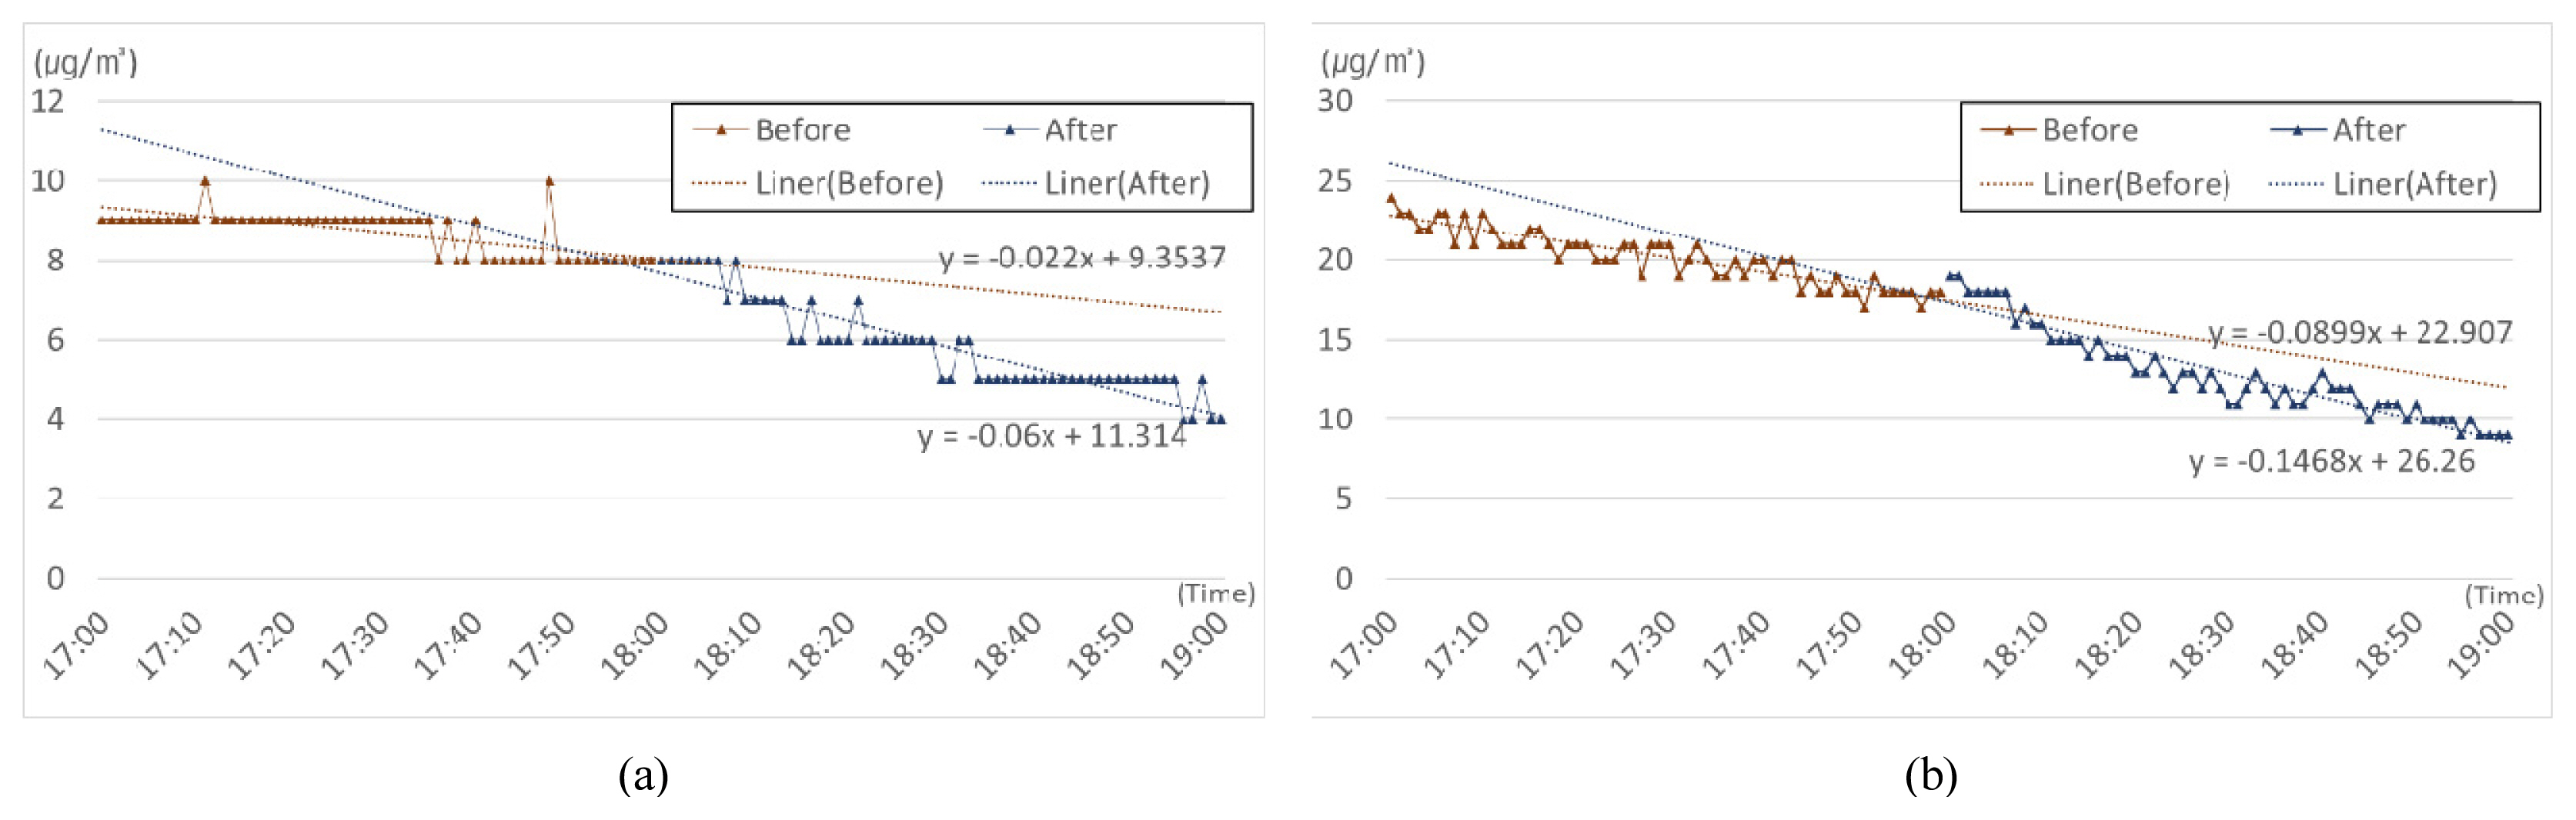
The particulate matter of indoor air before and after the system operation during the entire measurement period is presented in Table 3 and Fig. 4.
The average concentration of particulate pollutants in the classroom for 1 h before starting the plant-based biofilter system was 8.7 ╬╝g/m3 for PM2.5 and 20.2 ╬╝g/m3 for PM10. When the plant-based biofilter system was operated, PM2.5 and PM10 decreased abruptly to 4.0 ╬╝g/m3 and 9. 0 ╬╝g/m3, respectively. The average concentration of pollutants until the end of the experiment for PM2.5 and PM10 was 5. 9 ╬╝g/m3 and 12.9 ╬╝g/m3, respectively, recording a decrease rate of 32.2% and 36.1%, respectively. Looking at the change of PM before and after the operation of the biofilter system, in the case of PM2.5, it was analyzed as ╬▓ = ŌłÆ0.022 before operation, and ╬▓ = ŌłÆ0.06 after operation. And in the case of PM10, it was analyzed as ╬▓ = ŌłÆ0.090 before operation and ╬▓ = ŌłÆ0.147 after operation. It was confirmed that both PM2.5 and PM10 decreased noticeably after the operation of the system.
In general, the atmosphere contains particulate matter of various sizes suspended in the air (Wilson and Suh, 1997). particulate matter with an aerodynamic diameter between 2.5 and 10 ╬╝m adversely affects human health (Kloog et al., 2012). WHO (2018) reported that ~4 million people die each year owing to exposure to particulate matter in contaminated air. Particularly, it has been reported that inhaling particles of 2.5 ╬╝m or less can adversely affect the respiratory system, such as inflammation of the airways (Wu et al., 2016). Moreover, particulate matter can cause respiratory diseases such as lung cancer and pneumonia, chronic obstructive pulmonary disease, and cardiovascular diseases by penetrating deep into the lungs. Therefore, WHO (2000) recommends decreasing the concentration of PM2.5 below 10 ╬╝g/m3 per year, which is expected to decrease pollution-related deaths by - 15% . This study was confirmed to meet these WHO criteria.
Plants are known as a safe means of purifying air, while the results of studies on the reduction effect of particulate pollutants are reported to vary. A study, which evaluated the effects of wall greening on PM10 reduction for 6 h in an office (5.2 ├Ś 3.8 ├Ś 2.6 m), an improvement of only 4.6% was observed compared with natural reduction, and the result showed that it was difficult to reduce particulate matter with only purification plants in multiuse facilities (Kwon and Park, 2017). However, in a study (Ghazalli et al., 2018) that experimented with changes in particulate matter after installing air purification plants in the university hallway, it was reported that the installation of air purification plants had a great effect on reducing indoor particulate pollutants. In this study, the authors established a control zone and a treatment zone according to the presence or absence of wall greening in the 37-m-long corridor and analyzed the amount of particulate matter adsorbed on the glass slide. It was reported that the initial concentration of particulate pollutants increased by 4.6%, 15.1%, and 55.3% for PM2.5, PM10, and > PM10, respectively, but they decreased by 48.5%, 82.6%, and 65.5% after 5 weeks, respectively. However, since meteorological information such as temperature, RH, wind direction, and wind speed, which could affect the reduction of particulate matter, was not presented, it was difficult to objectively prove the effect.
To supplement the limited particulate pollutant purification capability of plants, some studies are partially evaluating the reduction in the field related to the plant-based biofilter system linked to air conditioners, which is the subject of this study. A study evaluating the effects of a soil-based plant-based biofilter on particulate matter reduction, which was conducted in a laboratory with a size of 10 ├Ś 7 ├Ś 3 m, reported that the biofilter reduced PM10 by 89.77% and PM2.5 by 73. 0% for 1 h under a single emission condition of particulate pollutants with a blowing volume of 90.72 m3/h. (Lee et al., 2015). However, a study of Lee et al. was limited to analyzing the reduction amount objectively, because the initial concentration according to the single emission condition of the pollutant was not presented. On the contrary, the results of this study showed that PM2.5 and PM10 reduced by 32.2% and 36.1%, respectively. The classroom where the experiment was conducted was a relatively clean space that satisfied the Ministry of EnvironmentŌĆÖs standards for air quality in multipurpose facilities. Thus, the above-mentioned reduction effect may not have a dramatic effect on occupants. Nevertheless, This is expected to have a positive impact on the protection of the respiratory system health of students who engage in learning activities in the classroom. It is suggested that a further study to confirm the air improvement effect of the plant-based biofilter system through repeated studies in a heavily polluted space will be conducted.
Air velocity and air volume
The air velocity and air volume before and after the system operation during the entire measurement period is presented in Table 4. The air volume was calculated using the time-series wind speed measured at the central air outlet of the plant-based biofilter system in the conversion formula provided in the duct air volume measurement method. Until 1 h after conducting the experiment, before the operation of the system, 0.01 m/s on average was formed in the classroom. However, after operating the system, an average wind speed of 0.38 m/s was measured, and the air volume was measured at an average of 765.3 CMH. The quality of air blown by the plant-based biofilter system satisfied fresh outdoor air quality standards. When the required ventilation of 36 m3/person ┬Ę h for education and research facilities among multipurpose facilities (Article 11 (43) of the Standard Rules for Facilities in Buildings) is applied, it (540 m3/h) satisfies the requirement for 15 people (1 teacher and 14 students).
Study participants
General characteristics
A total of 14 students (42.9% male and 57.1% female) participated in the experiment. The general characteristics of the participants are shown in Table 5. Among the 14 participants, 2 participants (14.3%) were smokers and 12 participants (85.7%) were nonsmokers. Participants were asked whether they had a disease; results showed that 2 participants (14.3%) had asthma, 10 participants (71.4%) had allergic rhinitis, 3 participants (21.4%) had a headache, and 1 participant (7.1%) had an allergic eye disease. Their perceived health status was confirmed as 3.29 out of 5 points.
Perception of indoor air quality
The indoor air questionnaire results before and after the system operations are given in Table 6. Students who participated in the experiment responded with 3.26 points (out of 5 points) on average for air satisfaction before operating the plant-based biofilter system. They responded that they were satisfied with a score of 3.60 points, 1 h after operating the plant-based biofilter system. When examining the value by item, air ambient was 3.36 before application and 3.64 after application, air odor was 3.14 before application and 3.50 after application, and air freshness was 3.29 before application and 3.64 after application. Excluding air odor, overall air satisfaction, air ambient, and air freshness statistically and significantly improved (p < .05). It was found that the occupants were satisfied with the overall indoor air environment, after the system was operated compared to before the operation. This made it possible to confirm that the plant-based biofilter system has an air purification effect.
Health effects
The health effects before and after the system operations are given in Table 7. The participants were asked if they had any physical symptoms 1 h after the commencement of the experiment, and they were asked again if the symptoms changed after applying the plant-based biofilter system for 1 h. Headache, light or heavy headedness, nausea, difficulty in concentration, loss of motivation, eye discomfort, throat irritation and dryness, sinus congestion, coughing and sneezing, and breathing problem complaints decreased but they were not significantly different. Throbbing headache, skin itching, dry skin, and the pain and discomfort of shoulders, back, and neck increased after applying the plant-based biofilter system. Dizziness, depression, sensitivity/ tension, rhinorrhea, secretion, and loss of strength in limbs did not change.
Wargocki (2013) argued that comfort does not fully reflect the serious health effects associated with exposure to pollutants existing in indoor air, even though it is an important indicator. Therefore, it can be said that the indoor air quality should be evaluated accurately only when subjects stay in the air for a long time and the effects of the air quality on their health are examined. Exposure to polluted air can result in many health consequences, such as minor upper respiratory tract irritation, asthma, allergies, chronic respiratory diseases, and heart disease, and it is also related to cognitive impairment (Kampa and Castanas, 2008). WHO divided environmental diseases caused by factors inside buildings into Sick Building Syndrome (SBS) and Building Related Illness (BRI). SBS causes mucosal irritation, neurotoxicity, asthma-related symptoms, skin irritation and dryness, and gastrointestinal problems (Tran et al., 2020). BRI indicates common diseases and symptoms that appear when exposed to bad indoor air such as dryness and irritation of the eyes, nose, throat, and skin, headache, fatigue, shortness of breath, hypersensitivity and allergies, sinus congestion, coughing and sneezing, dizziness, and nausea (Tran et al., 2020). Although no significant difference was found in this study, the symptoms of the nervous and respiratory systems were slightly reduced before and after the system was operated. It was shown that the application of the plant-based biofilter system is effective in reducing SBS and BRI defined by WHO. However, the complaints of some symptoms increased, especially skin itching and dry skin complaints increased. This is a different result from the RH of the room that has risen after the system is started, so careful interpretation is required. Additionally, in this study, participants were exposed to specific indoor air only for 1 h before operating the system and 1 h after operating the system. Therefore, it is difficult to expect any health effects to occur.
Subjective and objective attentiveness
The subjective and objective attentiveness before and after the system operations are given in Table 8. The subjective attentiveness of the students increased from 3.51 before application to 3.69 after application, which was statistically significant. In the objective attentiveness evaluation using a tool, performance value(P) decreased from 557.29 before application to 545.07 after application, quality value(Q) was reduced from 0.91 to 0.90, and continuity value(C) decreased from 530.20 to 513.58. They were statistically not significant.
Studies have been conducted on the effect of the indoor environment on the simple productivity of occupants. Wargocki et al. (1999, 2000a) revealed that when pollutants were present indoors, the text typing and calculation ability deteriorated significantly (p < 0.05), and logical reasoning, and the performance of serial addition and stroop task performance decreased significantly (p < 0.01). Wargocki et al. (2000b) argued that a 10% decrease in peopleŌĆÖs dissatisfaction with air quality could improve office work performance (e.g., text typing, addition, and proof-reading) and could be improved by 1.1% based on the results. Significant performance improvements occurred only when the intensity of general SBS symptoms such as headache and difficulty in thinking clearly was significantly reduced. Bak├│-Bir├│ et al. (2004) also obtained similar results from a study examining subjects exposed to pollutants in buildings, indicating that there was a relationship between indoor air quality and the job performance of people staying inside. In this study, it was also confirmed that the overall satisfaction of the participants, particulate matter concentration, temperature, and humidity improved after the operation of the system, and the subjective attention of the students significantly increased. However, the objective attention evaluating scores using the tool decreases, resulting in contradictory results. Due to this research method of one-group pre- and post-test, the FAIR test was repeatedly measured at 1 h intervals, and accordingly, the test effect was concerned. Nevertheless, the reason that the score decreased after applying the plant-based biofilter system can be considered and the concentration level of the participants exhausted 2 h after participating in the experiment. Attention refers to the higher function of the brain that maintains concentration continuously for problem solving (Oh, 2002). Therefore, to minimize the influence of the external environment, it is estimated that subsequent measurements in the 2 h experiment conducted without a break would have reduced studentsŌĆÖ attention. So, in future research, it is suggested that the experiment will be conducted while providing sufficient rest to students in a more stable environment to measure the exact effect of the plant-based biofilter system.
Strength and Limitation of Study
The strengths of this study were that it was the first experiment to compare the effects before and after applying the eco-friendly air purification system and to compare its effects. It does not evaluate changes in indoor air quality only as changes in air composition or physical conditions, but simultaneously investigated participantsŌĆÖ perception of subjective air quality. Moreover, to confirm whether indoor air affects the performance of the occupants, it was attempted to objectively evaluate the change in the attentiveness that affects their performance using verified tools in addition to the subjective evaluation of occupants.
Nevertheless, since this study has the following limitations, attention must be paid to the interpretation of the study results. The first limitation of this study was that it had a small sample size because it was a preliminary study conducted in a college classroom. A small-scale pilot study has limitations because of which its results cannot be generalized. The second limitation was that because of small sample size, a randomized double-blind could not be used, and a single group was compared pre- and post-experiment measurements. The single group pre and post comparisons cannot be clearly convinced of the relationship between experiment and effect. Particularly, the improvement effect of air quality can be confirmed by objective measurement, but the subjective evaluation of the air quality of the participants recognized that they were participating in the study, and the implementation of the intervention was confirmed. The possibility of a Hawthorne effect cannot be excluded. Thirdly, studentsŌĆÖ indoor air satisfaction and performance were evaluated only once. Moreover, the objective performance evaluations were conducted at 1 h intervals, so the test effect was concerned. In future studies, tests should be performed with sufficient time intervals before and after intervention. Fourth, health effects occur with long-term and continuous exposure. In this study, the exposure time before and after the operation of the system was as short as 1 h and single exposure, making it difficult to properly grasp the effect. In future studies, sufficient exposure should be conducted to compare differences in health effects before and after application of the plant-based biofilter system. Despite the limitations of the study, this study presented important findings for future research to improve indoor air quality despite its low power, since there are only a few studies on the indoor air quality in college buildings. Therefore, more meaningful results can be drawn if sufficient consideration and improvement are made for the limitations in future studies.
Conclusion
In this study, a plant biofilter system was built to create a comfortable indoor air quality in the learning space, and changes in indoor air quality were evaluated. Moreover, this study investigated how indoor air quality improvement, studentsŌĆÖ attentiveness, and health impact changes depend on the operation of the plant-based biofilter system. Results of this study show that the application of the plant-based biofilter system changed the air environment in the classroom. The operation of the plant-based biofilter system significantly decreased PM2.5 and PM10 and slightly increased temperature and humidity. Air satisfaction, attentiveness (influencing learning), and health impact partially improved, although the health effects were not significant. Results of this study confirmed the usefulness and effectiveness of the plant-based biofilter system improved indoor air quality in a school to some degree. It was also confirmed that it could contribute to finding solutions to reduce exposure to pollutants formed indoors and prevent the onset of symptoms. However, further studies need to be conducted for maintaining indoor air quality of multiuse facilities and evaluating the health effects and attention of occupants to present the objective performance of the plant-based biofilter system.