Growth Characteristics of Woody Plants for Irrigation Management of Container Gardens
Article information
Abstract
Background and objective
This study analyzed the growth characteristics, in relation to the soil moisture content, of trees planted in an environment with limited soil depth to provide the baseline data for effective irrigation management.
Methods
The experimental treatment was divided into soil moisture contents (SMC) of 20%, 15%, 10%, 5%, and 1%, and the respective watering times were set accordingly. As for plant materials, Nandina domestica, Euonymus alatus, Thuja occidentalis, Hibiscus syriacus, Pinus densiflora, and Pyracantha angustifolia, were chosen for this study, because they are highly likely to be used in urban street environments.
Results
The minimum irrigation point suitable for each species was determined by considering various aspects of visual quality and water efficiency in terms of plant growth, including characteristics such as height, root diameter, rootlet development, and weight. Our results indicate that N. domestica should be watered so that the moisture content of the soil is of at least 5%, based on the balance between the stem and roots, as well as on visual quality. E. alatus and P. angustifolia are suitable for watering that results in at least 10% SMC, considering the height, root growth, weight, and visual quality of plants. As for T. occidentalis, it showcases moderate growth with a soil moisture content of at least 5%. Finally, the minimum irrigation time required to obtain 15% SMC is appropriate, in terms of plant growth, fresh weight, and visual quality, for H. syriacus and P. densiflora.
Conclusion
This study suggested a basic irrigation guideline for container gardens where trees planted in environments with limited soil depth can be managed so that they are visually appropriate and in good condition of growth.
Introduction
Cities face social, economic and environmental problems derived from climate change such as urban heat islands, droughts, floods and heat waves. These urban problems cause emotional and physical threats to people, and constant efforts are made to solve them. Recently, attention has been focused on air pollution due to particulate matter and ozone, and policies and projects in the physical and ecological aspects are carried out to solve this problem. Various environmental problems in the city are known to be caused by decrease of green areas that serve as buffers due to expansion of urban districts following overcrowding and concentration into the city. Green infrastructure is emphasized as an alternative to solve this problem. Green infrastructure is a concept contrary to gray infrastructure, which is urban infrastructure like roads and railroads, and is a network comprised of green spaces and other natural and environmental elements. The Natural England report that appears in the UK government’s natural environment policy categorizes green infrastructure into parks and gardens formed in the city, amenity greenspace, natural and semi-natural urban greenspaces, green corridors, and community gardens, etc. (Natural England, 2009). However, as it is difficult to continuously secure actual green spaces due to increased area of pavements in the city, there are methods to secure green spaces by forming artificial grounds in the city such as rooftop and wall greening, container gardens, etc.
Moreover, street spaces in the city are a key element that builds the frame of the city and determines the image, as well as an important spatial element that can form a linear green infrastructure network. Plant elements such as street trees, flowerbeds and flowerpots are actively implemented along with the aspect of a pleasant pedestrian environment and landscaping. In particular, container gardens that can be built in spaces where plantation space cannot be secured are increasing for various functions and beauty (N.R. Jeong et al., 2017). In container gardens, plants are planted in a container (vessel or flowerpot) so that they can be implemented on pavements with impermeable layers where planting is impossible (Oh, 2013). Another benefit is that plants can be arranged in adequate spots by moving the containers, facilitating formation of green spaces in the city.
There are many factors to consider in maintaining plants planted in containers in urban streets, but most of studies were conducted on design in terms of aesthetics, such as a study on floral designs in terms of urban landscape improvement (Kim, 2008), study on types and design of plants in street-side flowerbeds (Byun, 2012), and study on urban public design applying flowering plants (Kim, 2010). However, container planting does not sufficiently fulfill the amount of evapotranspiration due to limited soil volume, thereby affecting plant survival and poor growth (DeGratano, 2000). Physical properties such as moisture content and permeability of planting soil and chemical properties such as pH, organic matter and salinity affect plant growth (Thorup, 1969; Adams et al., 1967; Mengel and Barber, 1974; Gerard et al., 1982). Unlike natural soil, containers use lightweight and artificial soil to limit the weight load and may be disadvantageous to plant growth due to limited soil depth and capacity. M.I. Jeong et al. (2017) suggested adequate soil depth considering the ornamental value by analyzing the growth reaction of main garden plants depending on the volume of containers. In particular, moisture inside soil is involved in plant metabolism such as photosynthesis and transpiration as well as absorption of minerals, and thus lack of moisture causes great damage to plants (Lee et al., 2016). Container planting an provide various effects such as securing urban green spaces, connecting green spaces, and providing biological habitats by building urban green infrastructure and thus must be maintained continuously. Maintenance of plants planted in containers requires adequate application of fertilizers, training and pruning, and irrigation management to maintain adequate soil humidity.
This study provides the baseline data necessary for irrigation management to maintain growth health by determining the growth characteristics of woody plants according to soil moisture in creating container gardens.
Research Methods
Plants used in the experiment
We conducted an experiment on plants likely to be planted on artificial ground and containers with limited soil depth to expand the green infrastructure of urban impermeable pavements. Evergreens commonly used as landscaping trees due to consistent form and non-fast growth as well as shrubs planted with forest trees for diversity of landscaping were selected as the plants for experiment. As shown in Table 1, the experiment was conducted on Thuja occidentalis, Pinus densiflora, Nandina domestica, Hibiscus syriacus, Pyracantha angustifolia, and Euonymus alatus.

Planted species used in the experiment
Method of experiment
This study was conducted in a rain shelter greenhouse to control the variables from precipitation in analyzing plant growth characteristics by soil moisture. The experimental plots were formed in 5 conditions of 1%, 5%, 10%, 15%, 20% soil moisture content (water-filled pore space; WFPS) (Fig. 1). Six three-year-old plants in the same size were planted in the container (65×75×30cm) with 25cm soil depth using nursery bed soil(Sunshine mix 4, Sun Gro Horticulture, Canada, peat moss 60–70%, perlite 30–40%), forming the experimental plots repeated 3 times for each treatment plot. After planting the plants, we managed them by irrigation 2–3 times a week for 60 days so that the plants can take root in the containers. Fertilization was done using 100g of a slow-release fertilizer (Osmocote, Scotts, USA, 11-11-17+2MgO+TE) every year. To prevent disease and insect pests that occur unexpectedly, we sprayed pesticides and germicides twice in summer.
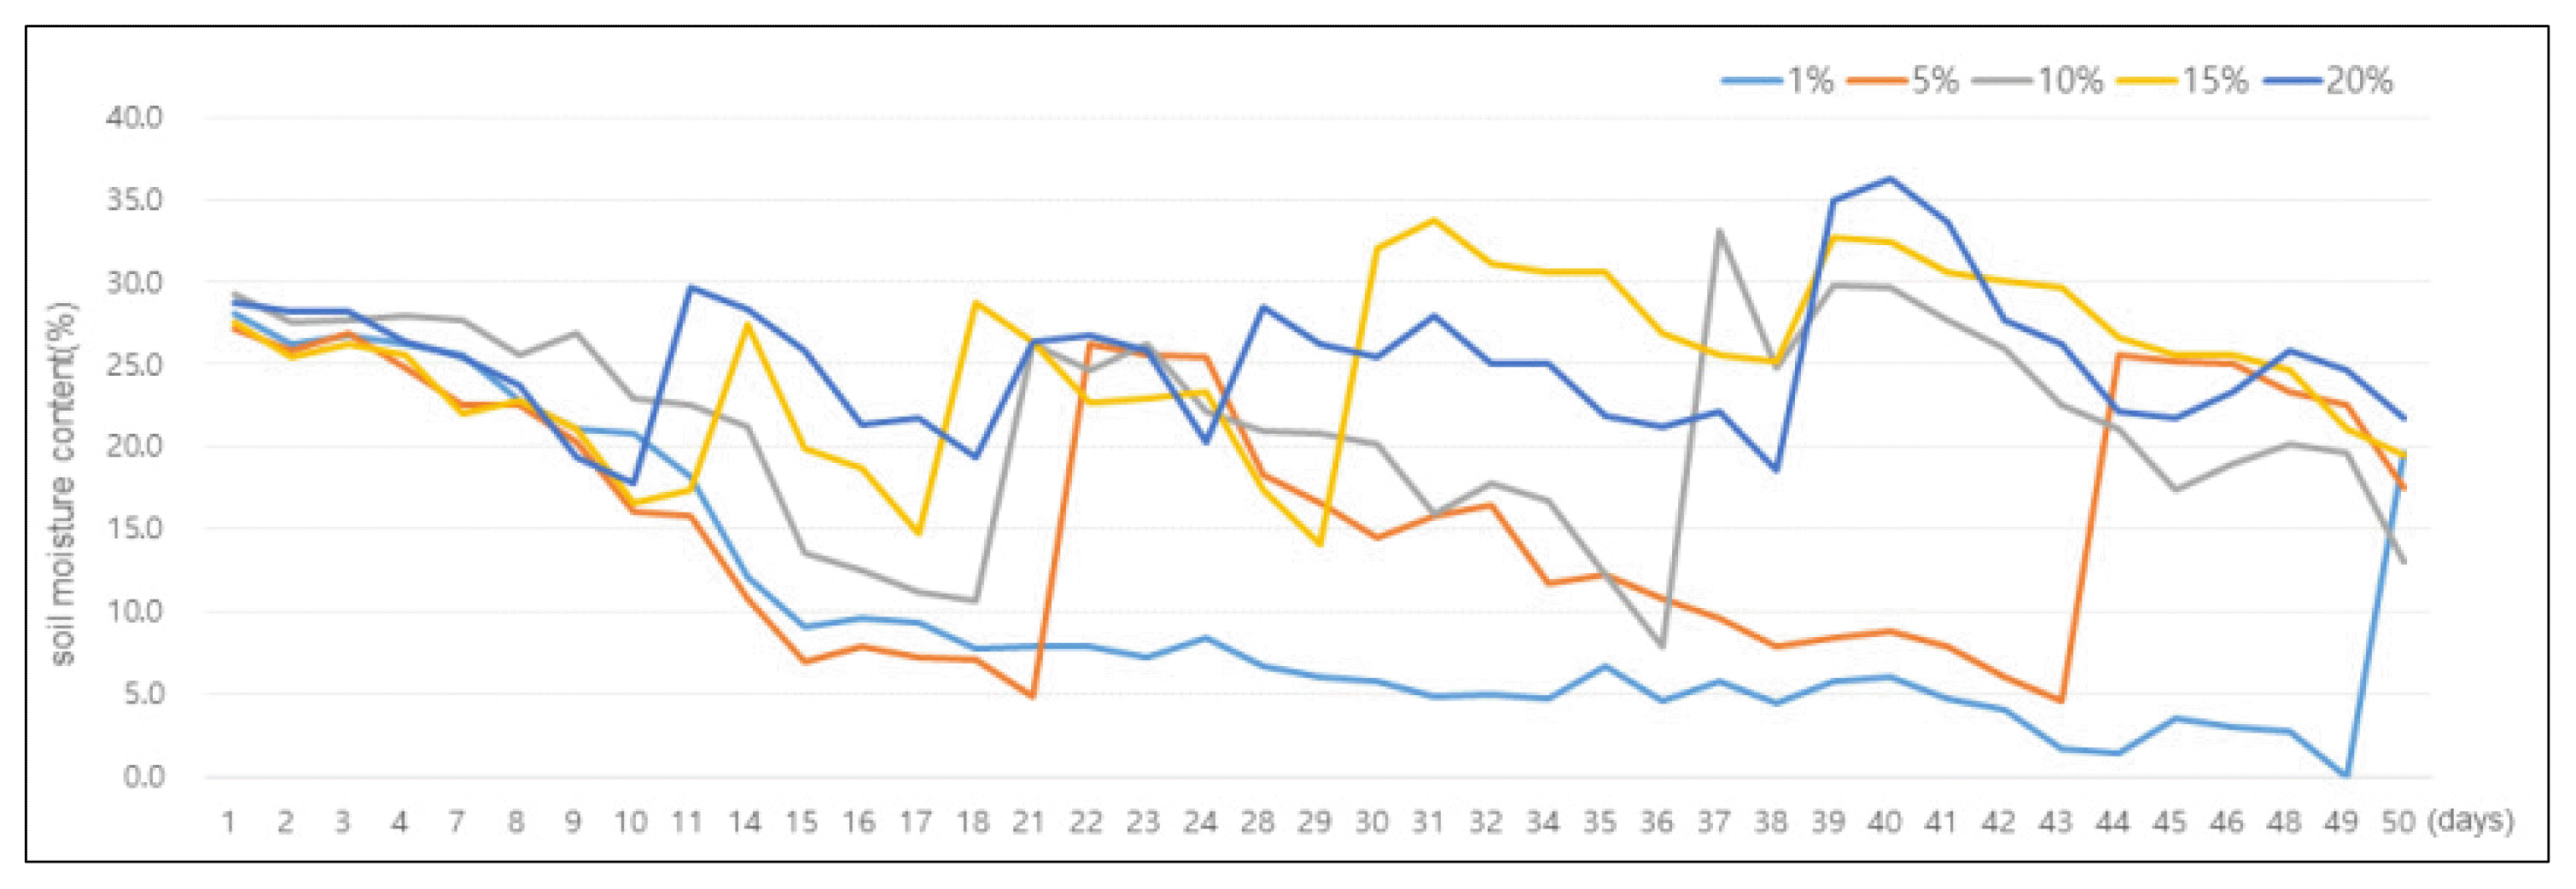
This is to explain the change in soil moisture content(SMC) over time in the experimental plots of different SMC. The blue line is the SMC of 20%, the yellow line is 15%, the gray line is 10%, the orange line is 5%, and the sky blue is 1%. The irrigation point of the 20% SMC is 10 days after, and the 1% SMC is 49 days after.
The point of irrigation was set as 1%, 5%, 10%, 15%, 20% soil moisture content, and irrigation was done upon reaching the starting point of irrigation. Since 60 days after planting, soil moisture content was measured using an FDR soil moisture sensor (WT1000B, Mi-Rae Sensor Co., Ltd, Seoul, Korea) at 10 a.m. every day. To analyze the relation between the values measured by the FDR sensor and actual soil moisture content, we checked with the manufacturer of the FDR sensor that it provides straight outputs within the scope of 0–100% soil moisture content. Plants with less than 20, 15, 10, 5, 1% soil moisture content are presumed to have reached the irrigation point, and thus 10L of over-head irrigation was performed each (Fig. 1). 10L of irrigation in the container with the same soil increased around 20%p of soil moisture content. We performed irrigation through measurement of each treatment plot and measured the number of irrigations every month to calculate the irrigation cycle.
Survey and analysis method
The experiment was conducted for 2 years to determine the growth response of plants. To examine the growth characteristics of plants in each treatment plot, we randomly selected 6 stocks of plants and measured the height and root collar diameter. according to the irrigation point. The height was measured from 60 days after planting at 30-day intervals from July to November 2016, and April to October 2017 up to the highest point of stems from the ground surface, and the diameter was also measured using calipers on the same day right above the ground surface. The height and diameter were measured by calculating the growth change (difference between growth at the end of the experiment and the growth at the beginning of planting). The H/D ratio was calculated by dividing height by diameter, and it is an index that shows the soundness of plants by evaluating whether the tree is stocky or spindly (Hughes and Freeman, 1967; Lee et al., 2006; Bayala et al., 2009). After all experiments are done in November 2017, the fresh weight was measured by dividing the tree into the above-ground branches and underground roots, and we calculated the T/R ratio that is the underground weight compared to aboveground weight. When the T/R ratio is 1, the underground and aboveground parts are well-balanced, thereby showing favorable growth (Sestak et al., 1971; Dominguez-Lerena et al., 2006). Moreover, the quality index was assessed to determine the ornamental value of trees. The quality index is rated on a five-point scale from poor (1 point) to favorable (5 points), generally considering overall growth state, dead branches, discoloration of leaves, fallen leaves, etc. The measured data is analyzed using the SPSS Statistics Program (SPSS ver. 24.0), and the analysis of covariance and Duncan’s multiple range test was conducted to evaluate the significance of treatment. Moreover, to predict the adequate irrigation point according to soil moisture content, we conducted a linear regression analysis with fresh weight as the dependent variable and soil moisture content as the independent variable.
Results and Discussions
Growth characteristics
Plant height
An analysis of the time series of plant height increase from planting in May 2016 to the end of the experiment in October 2017 shows that there was almost no change in growth for 1 year of planting for Euonymus alatus, Hibiscus syriacus, Pinus densiflora, but they grew rapidly after 1 year of planting, showing greater height in the treatment plots with high soil moisture content. Height of Nandina domestica, Thuja occidentalis, Pyracantha angustifolia grew continuously according to the growth period, showing great height in the treatment plots with high soil moisture content (Fig. 2). Soil moisture is a key factor that affects growth by being involved with metabolism, absorbed by the plant body through roots, and the treatment plots with high soil moisture content seem to be showing high growth speed.
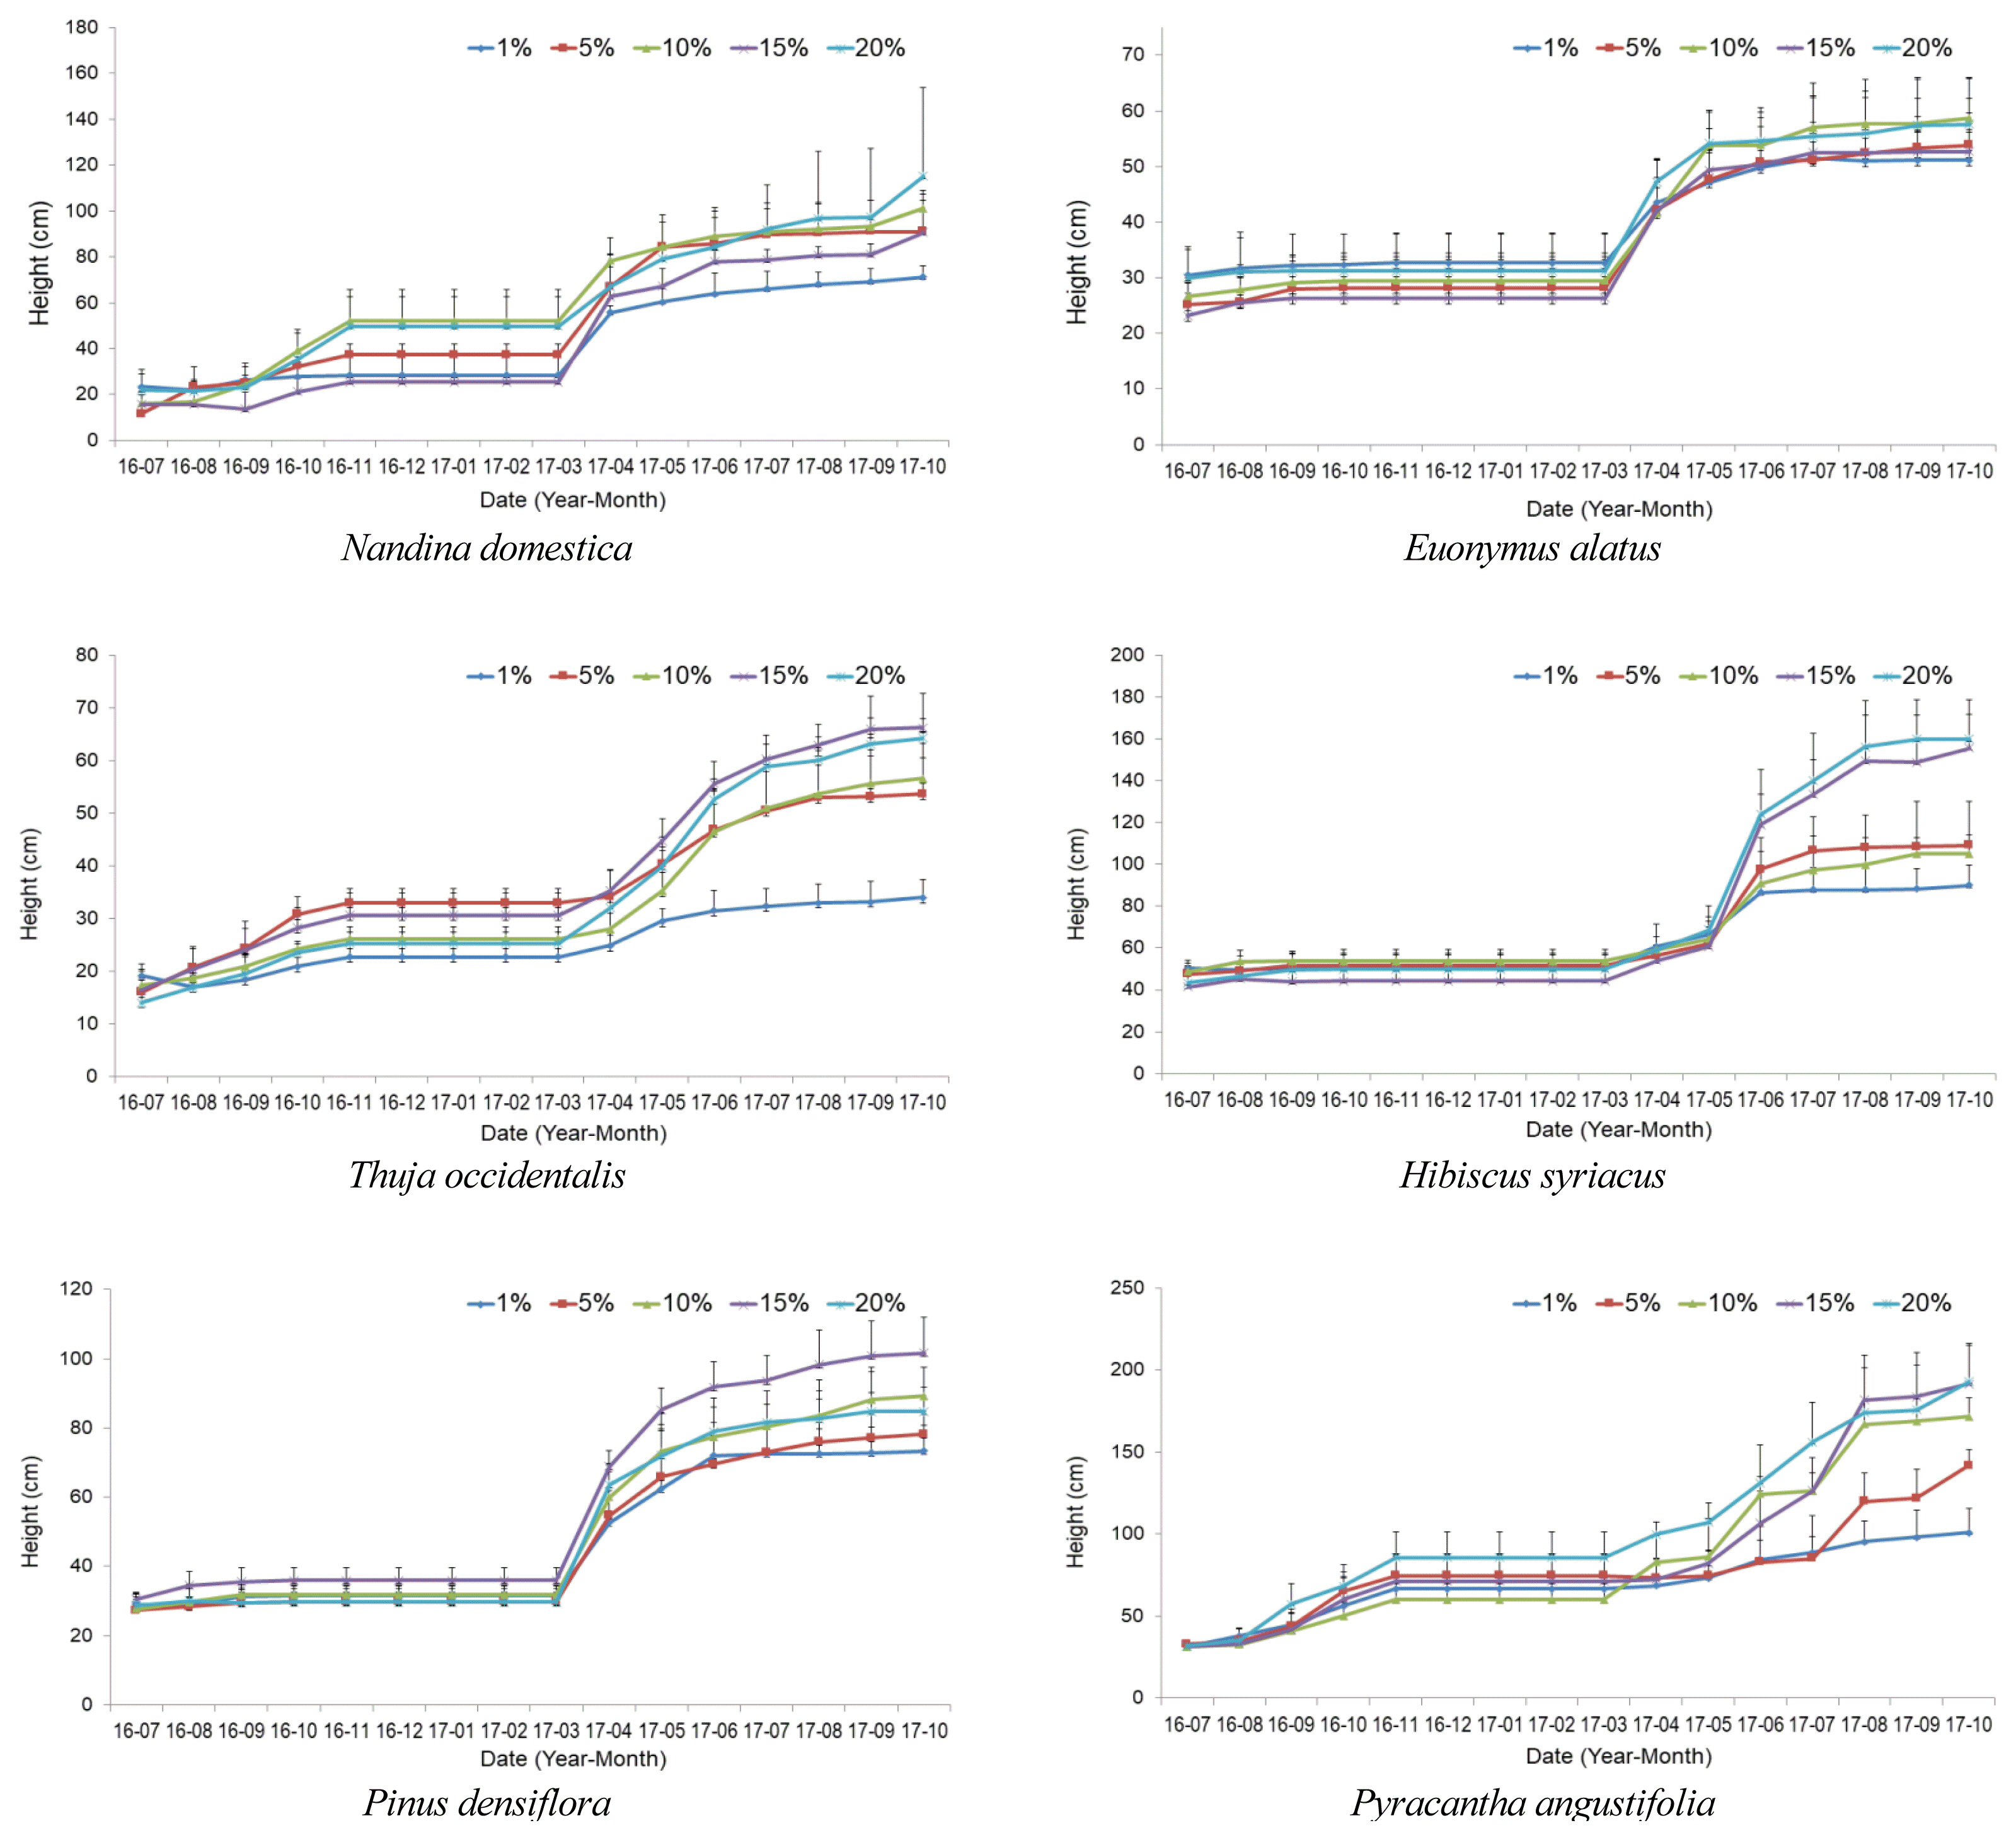
The growth patterns of plant height by soil moisture content. Height was measured every month from July 2016 to October 2017 on 6 subjects for each treatment. Growth characteristics are average values of 6 individuals by month (N=30).
Table 2 shows the results of analyzing growth amount obtained by subtracting the height measured in July 2016 from the height measured in October 2017. Euonymus alatus showed the highest growth at 1% and 10% soil moisture, Hibiscus syriacus and Pinus densiflora at 15%, and Nandina domestica, Thuja occidentalis, Pyracantha angustifolia at 20%. As a result of analyzing the difference in growth amount according to soil moisture content, there was a statistically significant difference in Thuja occidentalis, Hibiscus syriacus, Pyracantha angustifolia, with Thuja occidentalis and Hibiscus syriacus showing the most height growth at 15% and higher, and Pyracantha angustifolia at 10% and higher. Soil moisture serves as an extremely important constraint in the initial growth and settlement of plants, thereby affecting the growth of cell length (Kusaka et al., 2005; Shao et al., 2008). A study by Cameron et al. (2015) that analyzed the growth response according to irrigation management on Rhododendron showed that plant growth varied depending on the amount of irrigation. Sánchez-Blanco et al. (2019) explained that irrigation management can be a means to control the growth of ornamental plants. Soil moisture content is one of the key factors that determine the growth of plant height (Koch et al., 2004; Wu et al., 2011; Rustad et al., 2001) and varies depending on the type of plants.
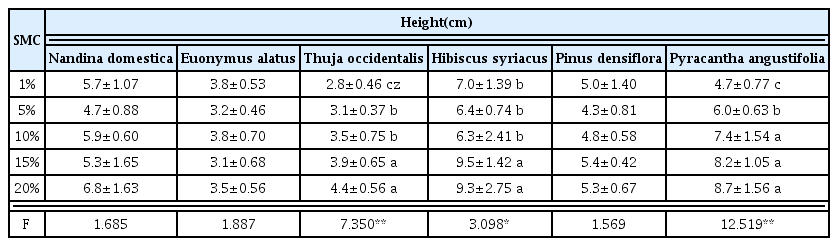
One-way ANOVA of growth change of height by soil moisture content (SMC)
Root collar diameter
An analysis of the time-series change in root collar diameter shows that all species showed poor growth for 1 year after planting, but growth tends to increase continuously in the second year (Fig. 3). There is a gap in growth amount among species depending on soil moisture content. Euonymus alatus and Pyracantha angustifolia are showing a growth pattern that has almost no difference due to moisture content, but Nandina domestica, Thuja occidentalis, Hibiscus syriacus, Euonymus alatus are showing relatively poor growth at 1%. Nandina domestica, Thuja occidentalis, Pinus densiflora are showing rapid growth at 15%, but fine growth speed at 10% as well.
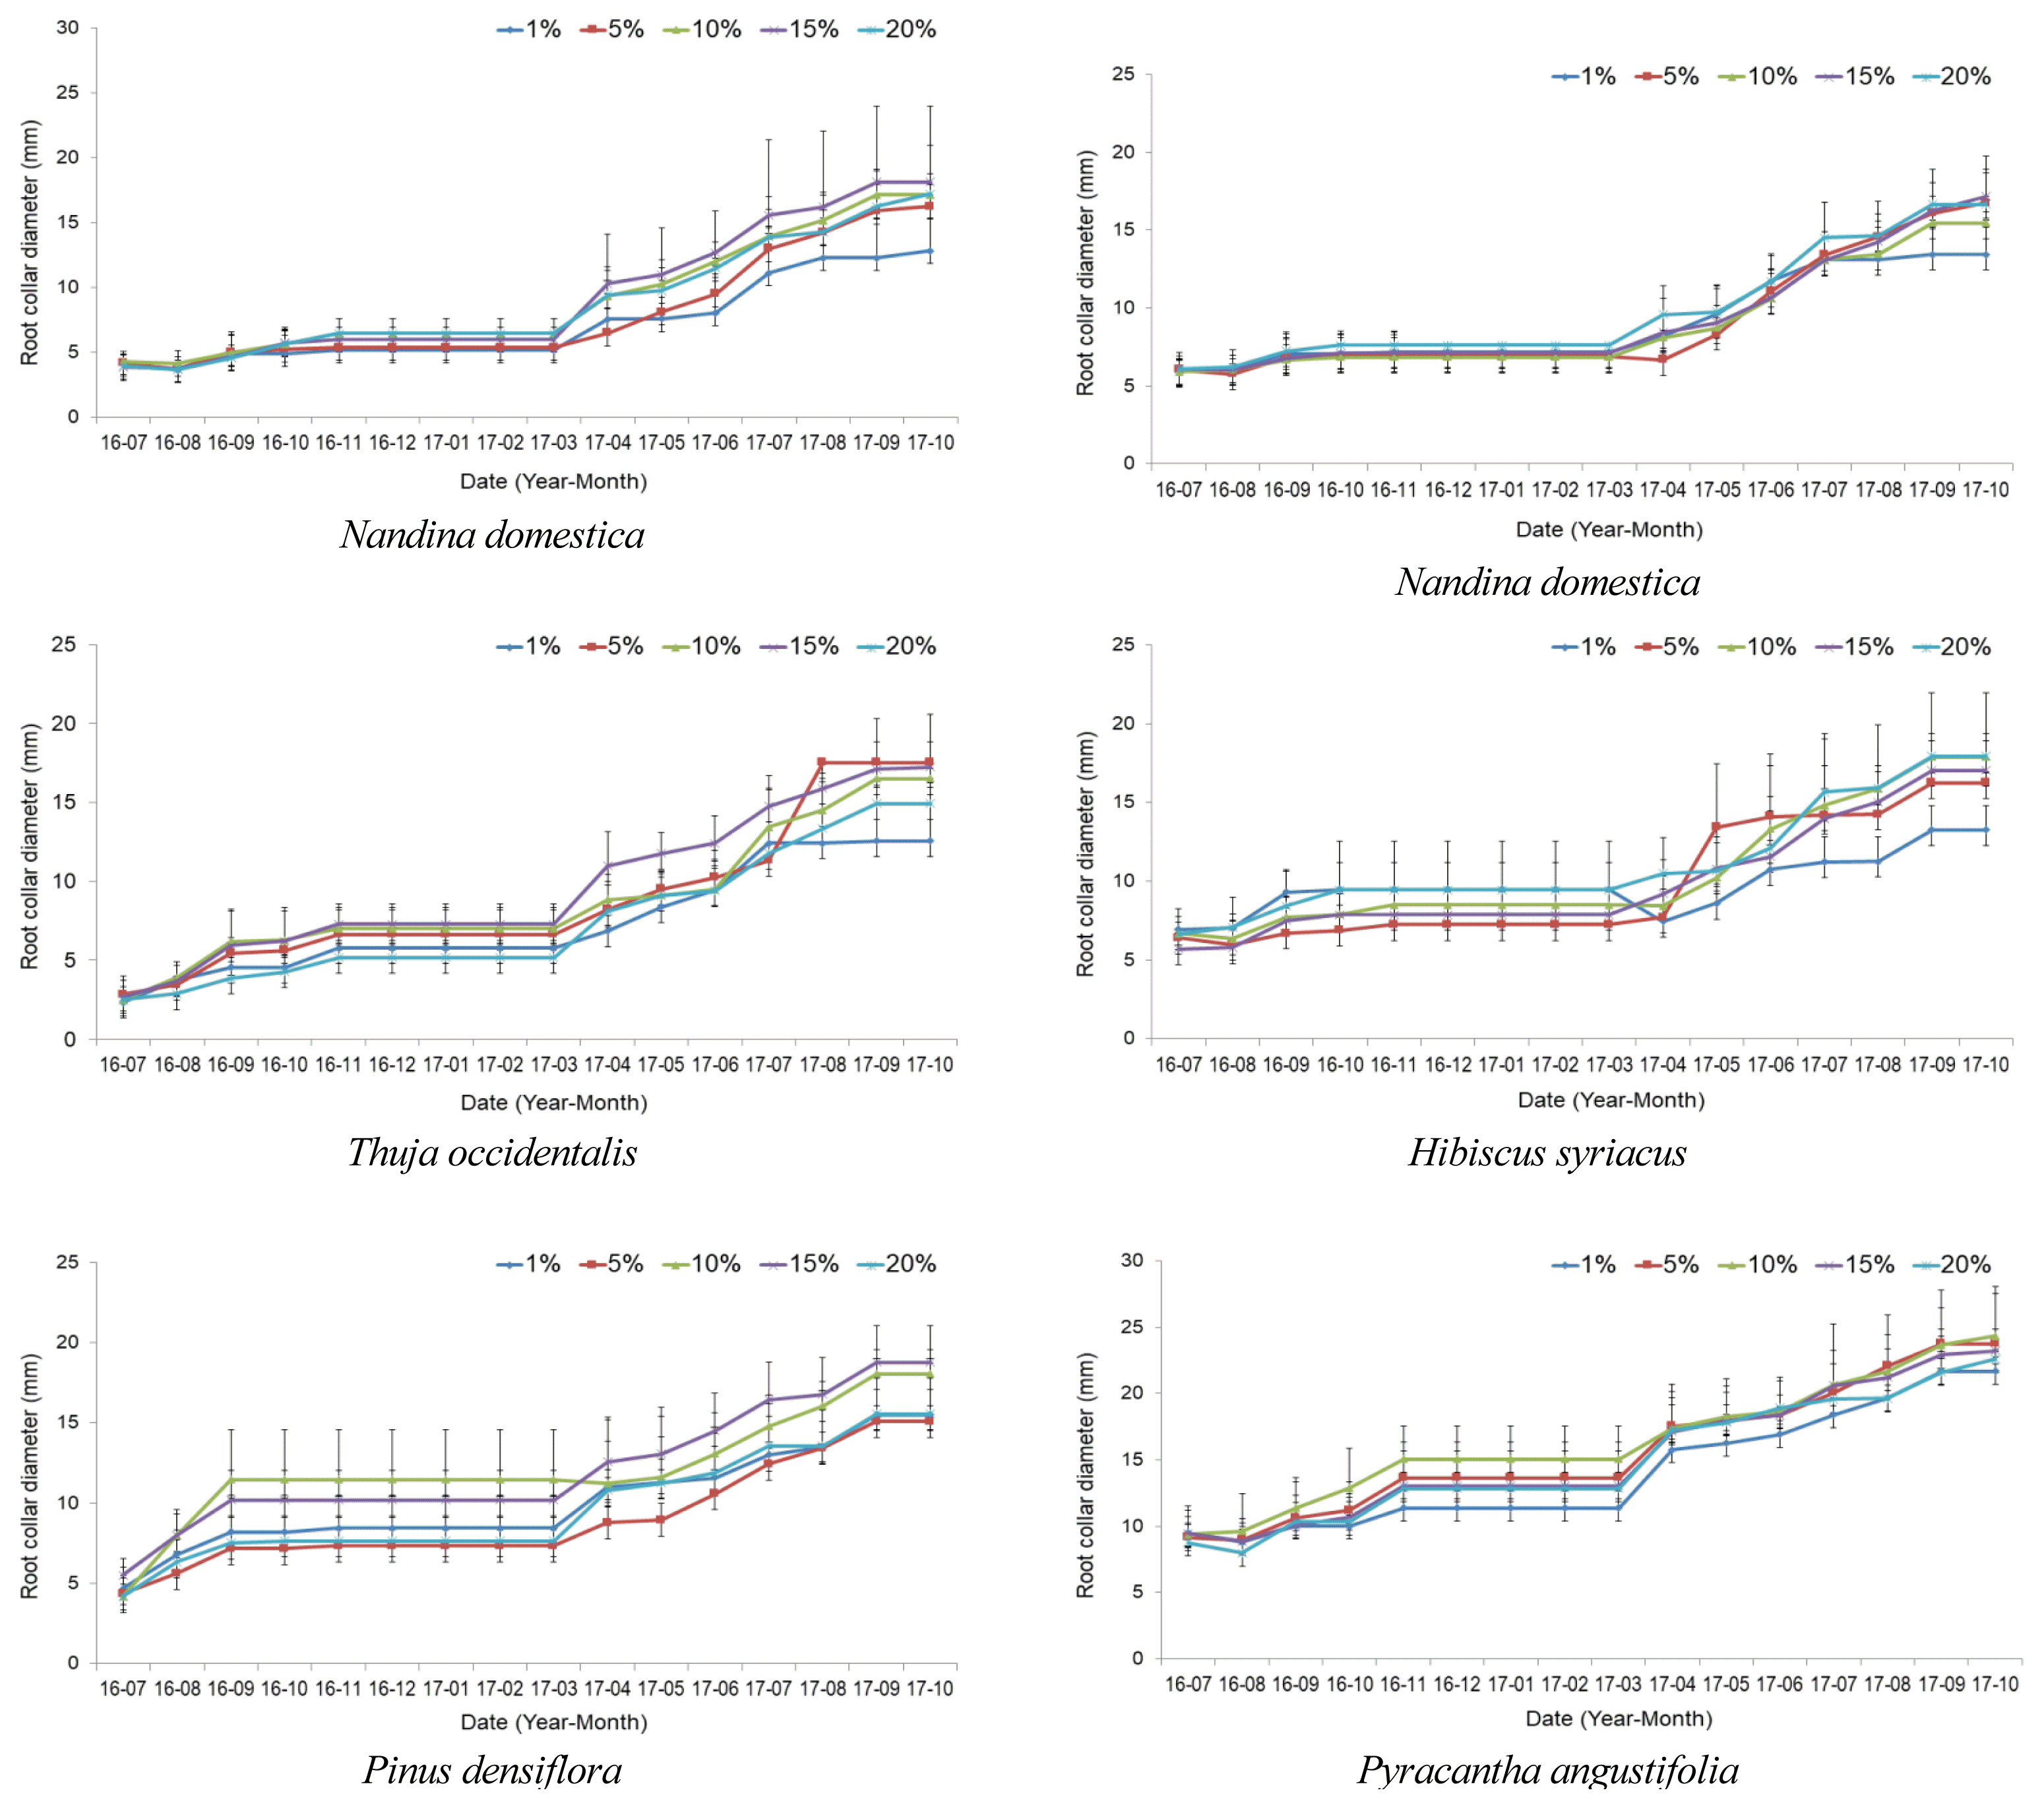
The growth patterns of plant root collar diameter by soil moisture content. Root collar diameter was measured every month from July 2016 to October 2017 on 6 subjects for each treatment. Growth characteristics are average values of 6 individuals by month (N=30).
Table 3 shows the results of analyzing the changes in root collar diameter growth. Diameter growth was biggest in Nandina domestica and Thuja occidentalis at 5%, Pinus densiflora and Pyracantha angustifolia at 10%, Euonymus alatus at 15%, and Hibiscus syriacus at 20%. As for statistical significance according to moisture content, there was a significant difference in Nandina domestica, Euonymus alatus, Thuja occidentalis, and all three species showed high growth at 5% and higher. Moreover, an analysis on the growth trend of diameter according to moisture content shows that it is beneficial for Pinus densiflora and Pyracantha angustifolia to maintain 10%, and Hibiscus syriacus to maintain 20%. Soil moisture content is a key factor that determines the tree diameter growth (Koch et al., 2004; Wu et al., 2011; Rustad et al., 2001), which shows a sensitive response to moisture deficit (Lee, 2015), and thus it is necessary to maintain adequate soil moisture in each plant.
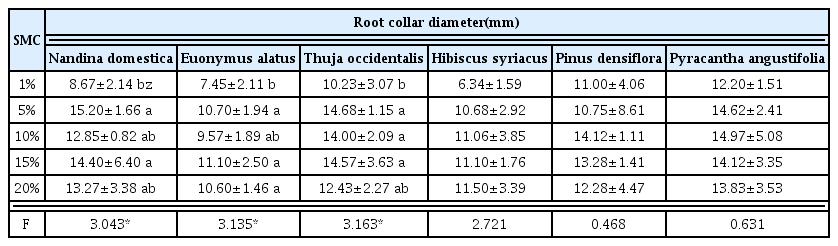
One-way ANOVA of growth change of root collar diameter by soil moisture content(SMC)
H/D ratio
The H/D ratio is calculated by the ratio of plant height and root collar diameter, and trees with low H/D ratio are considered sounder as they have relatively thicker diameter than those with similar heights. Thuja occidentalis and Pyracantha angustifolia show low H/D ratio at 1% moisture content, Nandina domestica and Pinus densiflora at 5%, Hibiscus syriacus at 10%, and Euonymus alatus at 15%. There was a statistically significant difference in Thuja occidentalis, Hibiscus syriacus, Pyracantha angustifolia. and Thuja occidentalis can show sound growth at 1% or 5%, Hibiscus syriacus at 5% or 10%, and Pyracantha angustifolia at 1% or 5%. The H/D ratio is low at 5% in all species, thereby showing a healthy growth state (Table 4). This is similar to the explanation by Pallardy and Rhoads (1993) that drier soil leads to lower H/D ratio, and relatively more root development. However, there is a gap in adequate soil moisture for growth depending on the plant.
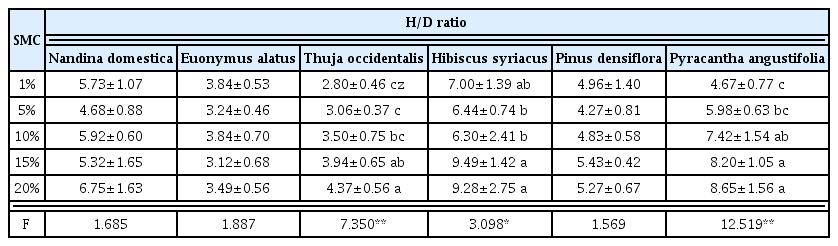
One-way ANOVA of H/D ratio by soil moisture content (SMC)
Fresh weight
Table 5 shows the results of analyzing aboveground fresh weight. Nandina domestica showed high growth at 5% moisture content, Euonymus alatus at 10%, Thuja occidentalis and Pinus densiflora at 15%, and Hibiscus syriacus and Pyracantha angustifolia at 20%. Hibiscus syriacus and Pyracantha angustifolia showed active aboveground growth with higher soil moisture content. There was a statistically significant difference in all species except Nandina domestica. Nandina domestica, Euonymus alatus, Thuja occidentalis are similar in all plots except 1%. All species were lightest at 1%, Pinus densiflora was heaviest at 15%, and Hibiscus syriacus and Pyracantha angustifolia showed high growth at 15% and 20%.
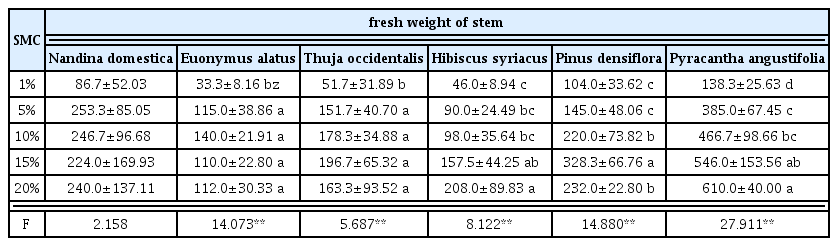
One-way ANOVA of fresh weight of stem by soil moisture content (SMC)
Rootlet development can be identified by underground fresh weight. Nandina domestica showed high rootlet development at 5%, Euonymus alatus at 10%, Thuja occidentalis, Pinus densiflora, Pyracantha angustifolia at 15%, and Hibiscus syriacus at 20%. There was a statistically significant difference in Euonymus alatus, Hibiscus syriacus, Pinus densiflora, Pyracantha angustifolia. Nandina domestica and Thuja occidentalis showed relatively poor rootlet development at 1%, but other treatment plots showed similar growth. Rootlet development was favorable for Euonymus alatus at 10% and 15%, Hibiscus syriacus and Pyracantha angustifolia at 15% and 20%, and Pinus densiflora at 15% (Table 6). Underground parts show constant growth even if stem growth is discontinued regardless of the aboveground growth point (Lee, 2015), and thus soil moisture with favorable underground development is the suitable humidity for plant growth.
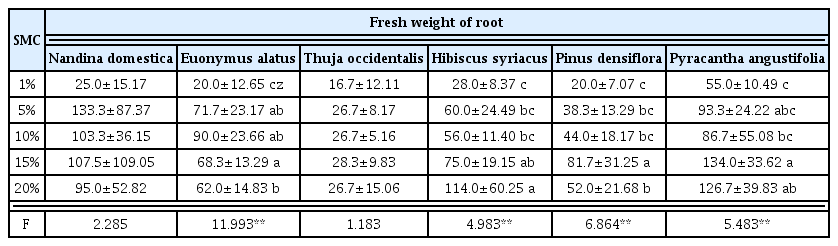
One-way ANOVA of fresh weight of root by soil moisture content (SMC)
T/R ratio, which is the ratio of aboveground and underground weight, increases when there is high soil moisture content or poor underground growth. Nandina domestica, Thuja occidentalis, Pinus densiflora, Pyracantha angustifolia showed extremely high T/R ratios, indicating that underground growth is extremely poor compared to aboveground. In other words, they lack root development compared to overall growth. Compared to other trees, Euonymus alatus showed the T/R ratio closest to 1 at 5%, 10%, 15% moisture content, and Hibiscus syriacus at 5%, showing a balanced growth aboveground and underground. An analysis of the statistically significant difference shows that Thuja occidentalis and Pyracantha angustifolia are showing a balanced growth at 1% (Table 7). Carbohydrates move to roots by photosynthesis of leaves even when stems stop growing in height (Lee, 2015). Thus, soil moisture content with favorable underground growth can be considered suitable for plant growth.

One-way ANOVA of T/R ratio by soil moisture content (SMC)
Quality characteristics
Root development
Visual assessment of root development shows that root lets developed more at higher moisture content (Fig. 4). Root development is relatively poor at 1%, but the trees show similar patterns at 10% moisture content and higher, and thus it is important to maintain an adequate range rather than increasing the moisture content. Excessive soil moisture decreases air content of soil, which inhibits root growth and affects activities and breeding of soil micro-organisms, and lack of soil moisture reduces both root volume and length (Franco et al. 2011; Ostonen et al., 2007), which is why adequate soil moisture must be maintained for each plant.
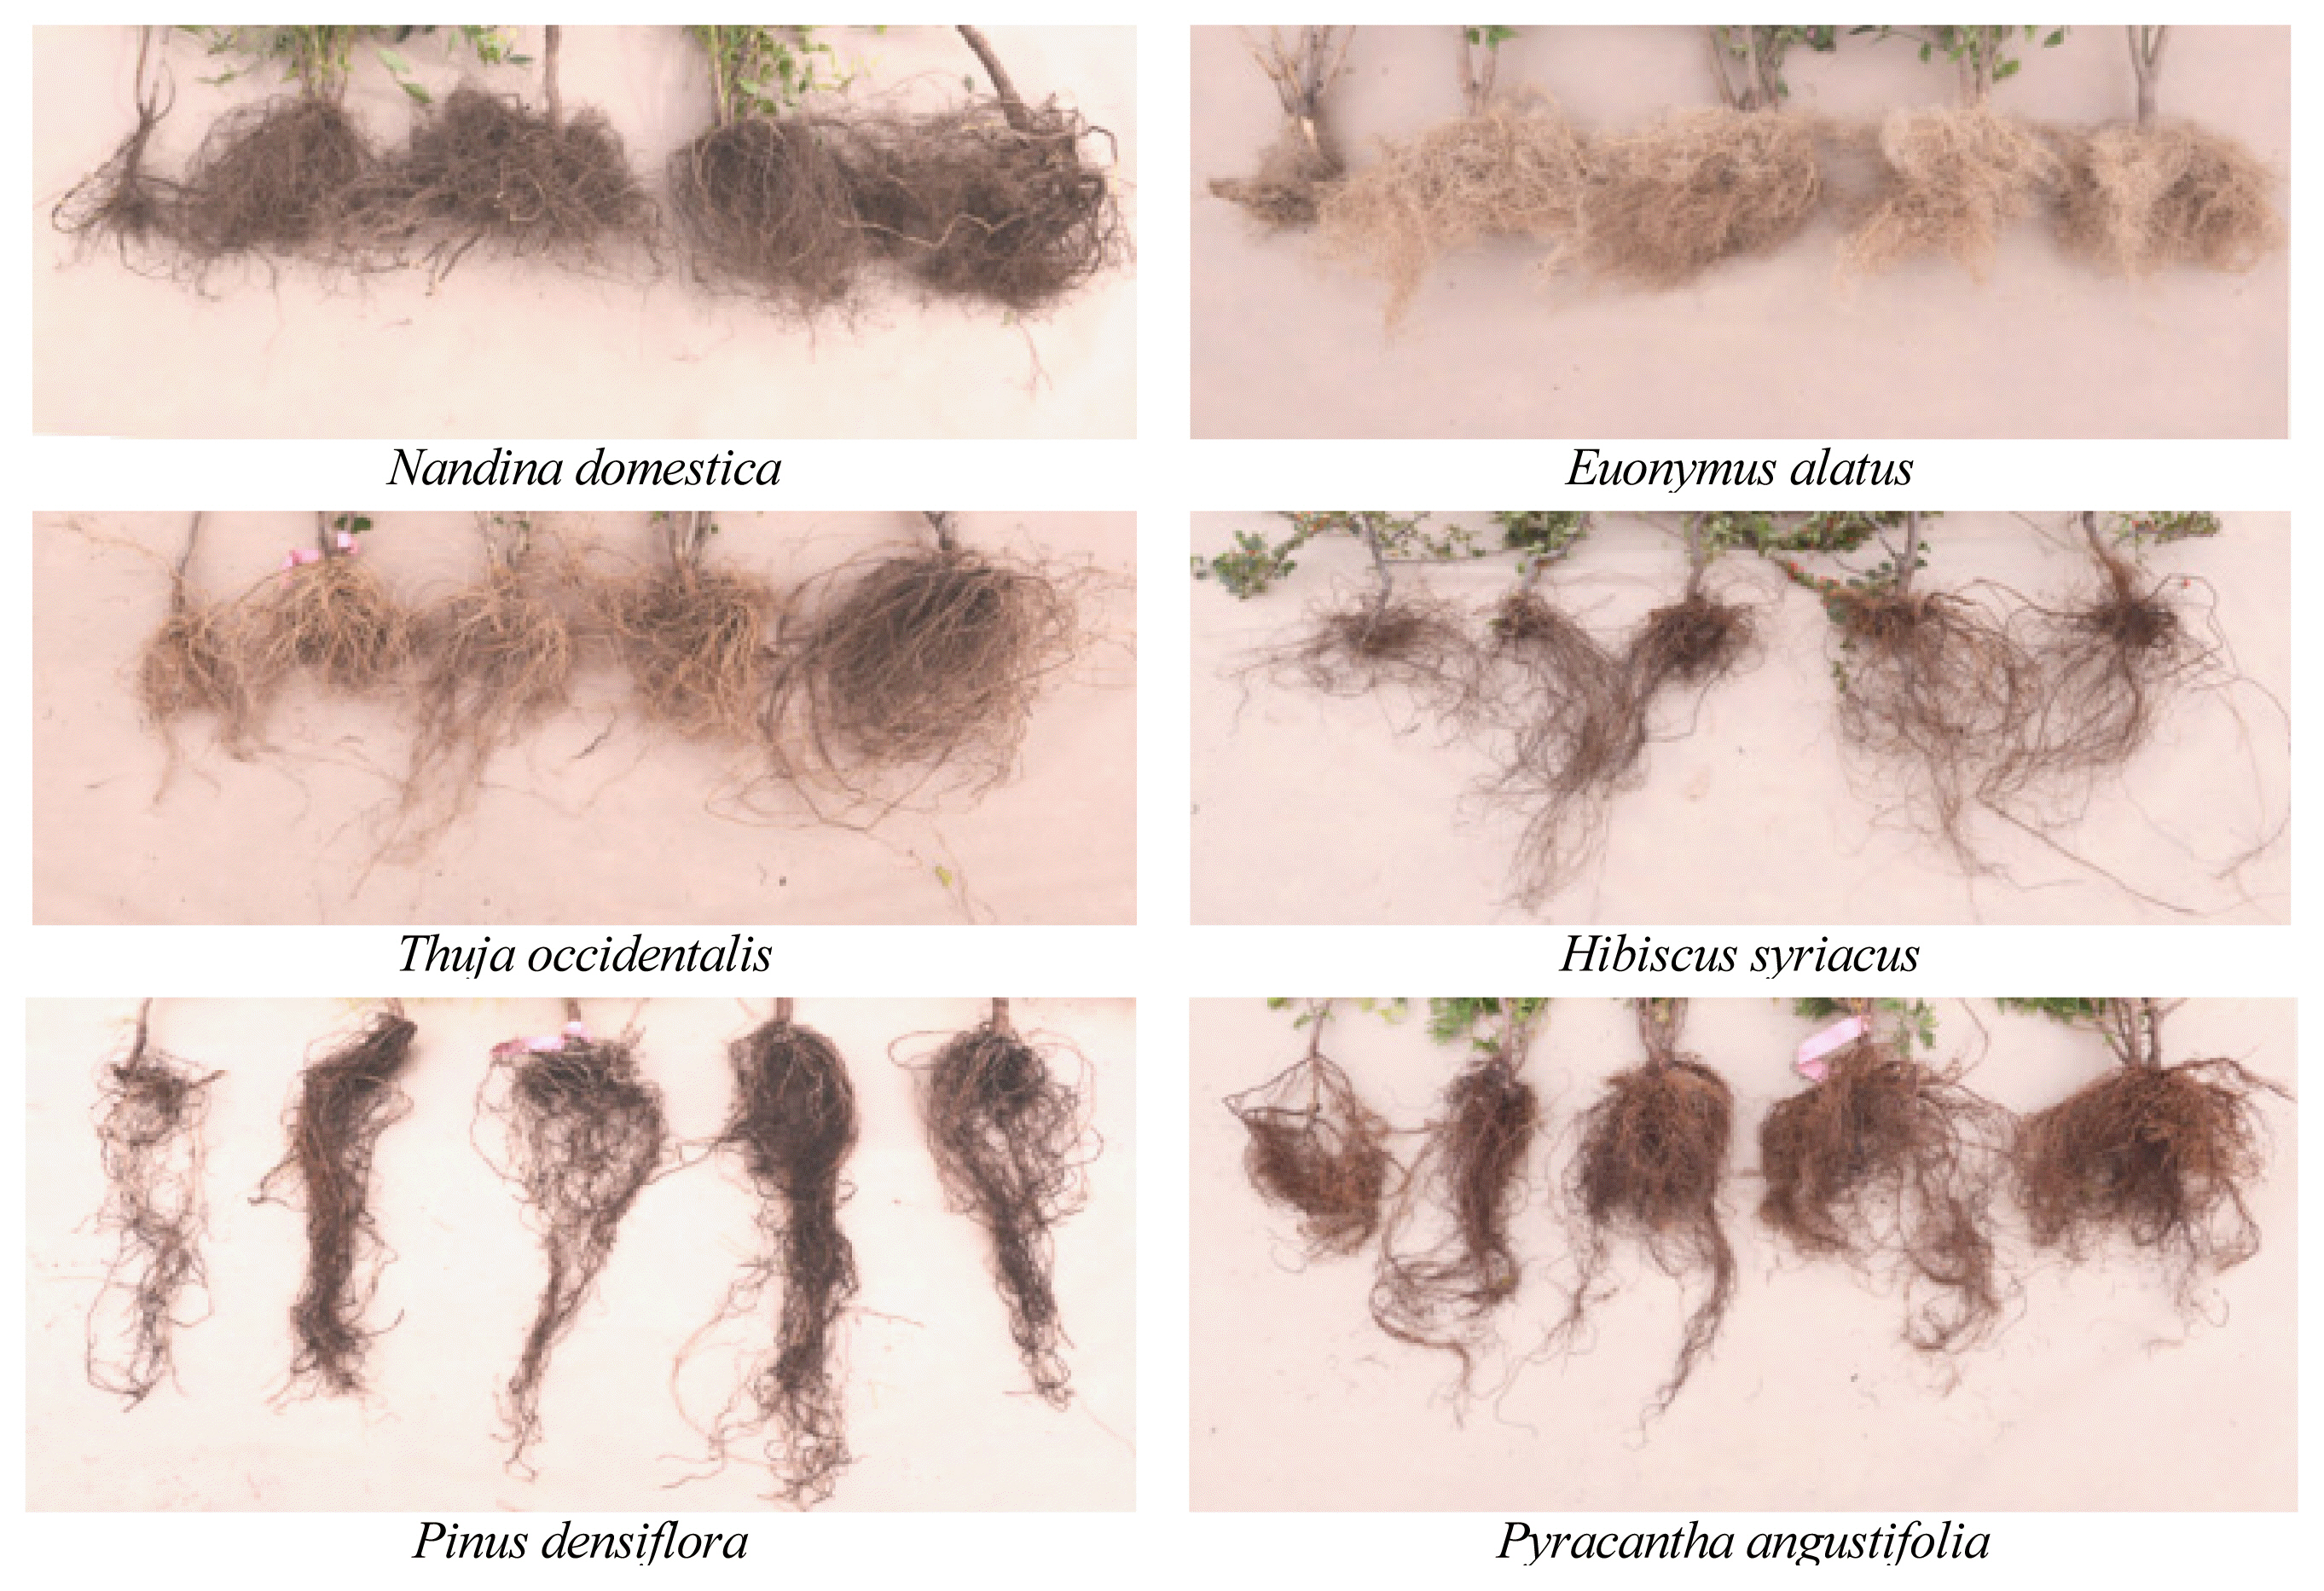
The root development of trees grown at five different SMC (from left to right = 1, 5, 10, 15, 20%). Root photographs were taken before measuring the fresh weight.
Ornamental value
To determine the aboveground state of growth and possibility to improve landscape as landscaping trees, we analyzed the visual ornamental value on a five-point Likert scale and showed the results in Fig. 5. There was not much difference in ornamental value according to moisture content for Nandina domestica, Thuja occidentalis, Hibiscus syriacus, Pinus densiflora, Pyracantha angustifolia, and they all maintained at least a certain level of visual quality at 5% and higher. Euonymus alatus has extremely low ornamental value, showing dead leaves and stems at 1%, and maintains a certain level at 5% and higher, but is low compared to other plants. Plants showing relatively favorable state of growth in containers are Nandina domestica, Thuja occidentalis, Pinus densiflora, Pyracantha angustifolia, which can be considered to have high utility as container plant species. Franco et al. (2006) explained that adjusting soil moisture plays a key role in producing high-quality seedlings for growth of ornamental plants, which shows that the role of soil moisture is important in order to maintain adequate ornamental value in addition to plant growth.
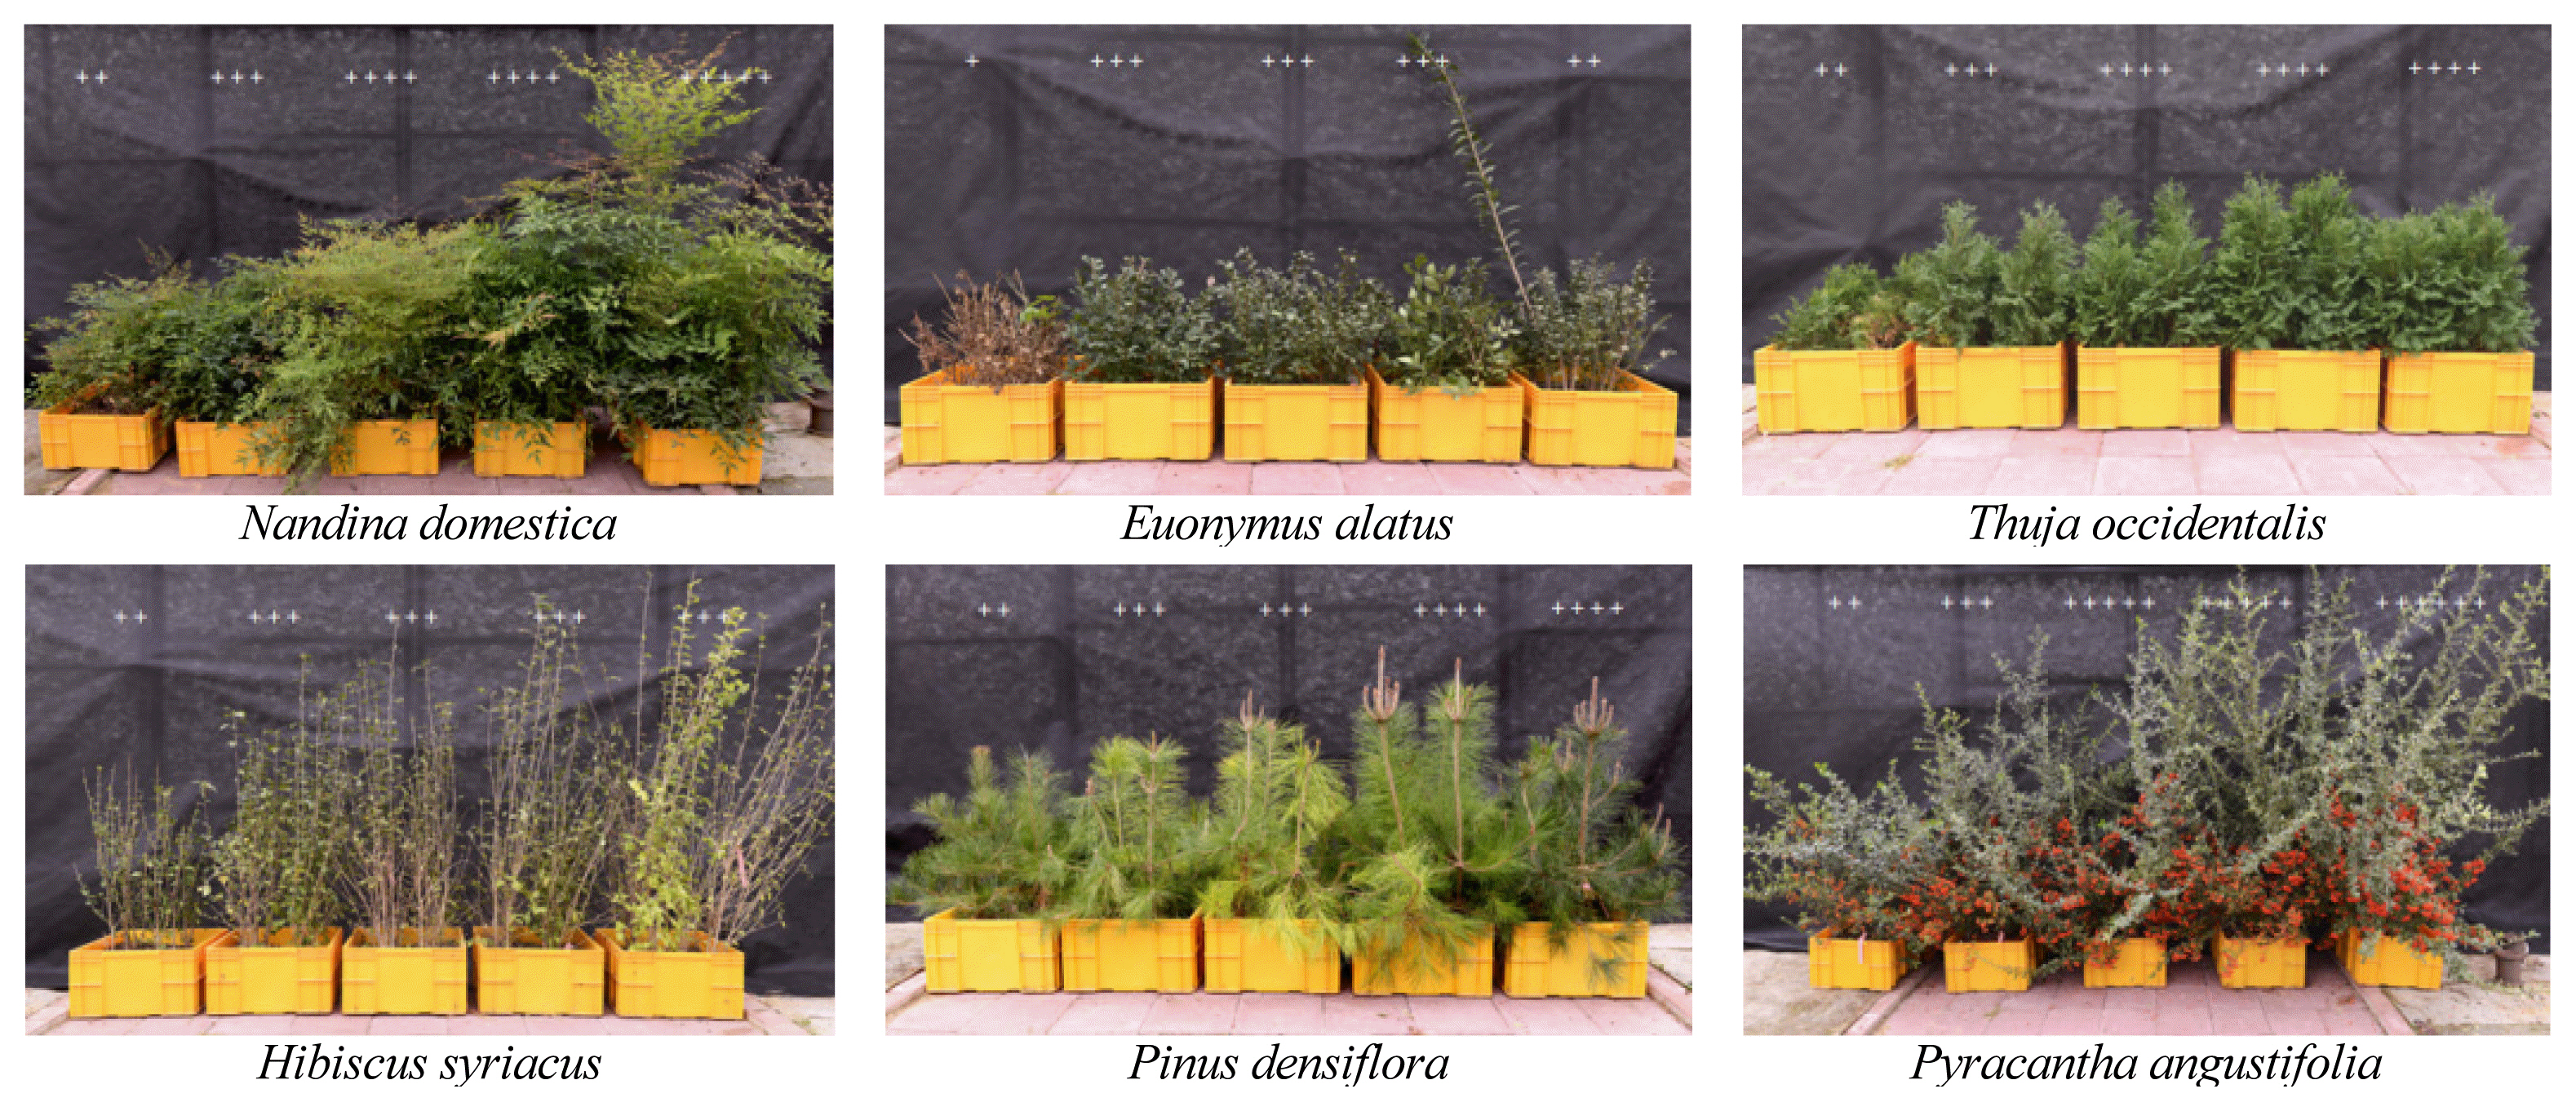
The quality index of trees grown at five different SMC. The higher the number of +, the better the visual quality, from left to right = 1, 5, 10, 15, 20%. The value of landscape was investigated and photographed in October 2017.
Predicting the starting point of irrigation
The optimum starting point of irrigation for each plant was predicted using a regression equation with soil moisture content as the independent variable and final fresh weight as the dependent variable (Fig. 6). The revised R2 of the predicted regression equation showed a high explanatory power at 0.77–0.96. The adequate soil moisture at the optimum irrigation point with active growth for each species is 14.8% for Pinus densiflora, 13.5% for Thuja occidentalis, 14.4% for Nandina domestica, and 13% for Euonymus alatus, and higher soil moisture content is better for Hibiscus syriacus and Pyracantha angustifolia up to 20%. During the experiment, there may have been obstacles to plant growth at less than 5% soil moisture content, which is why irrigation must be performed at least 5% soil moisture.
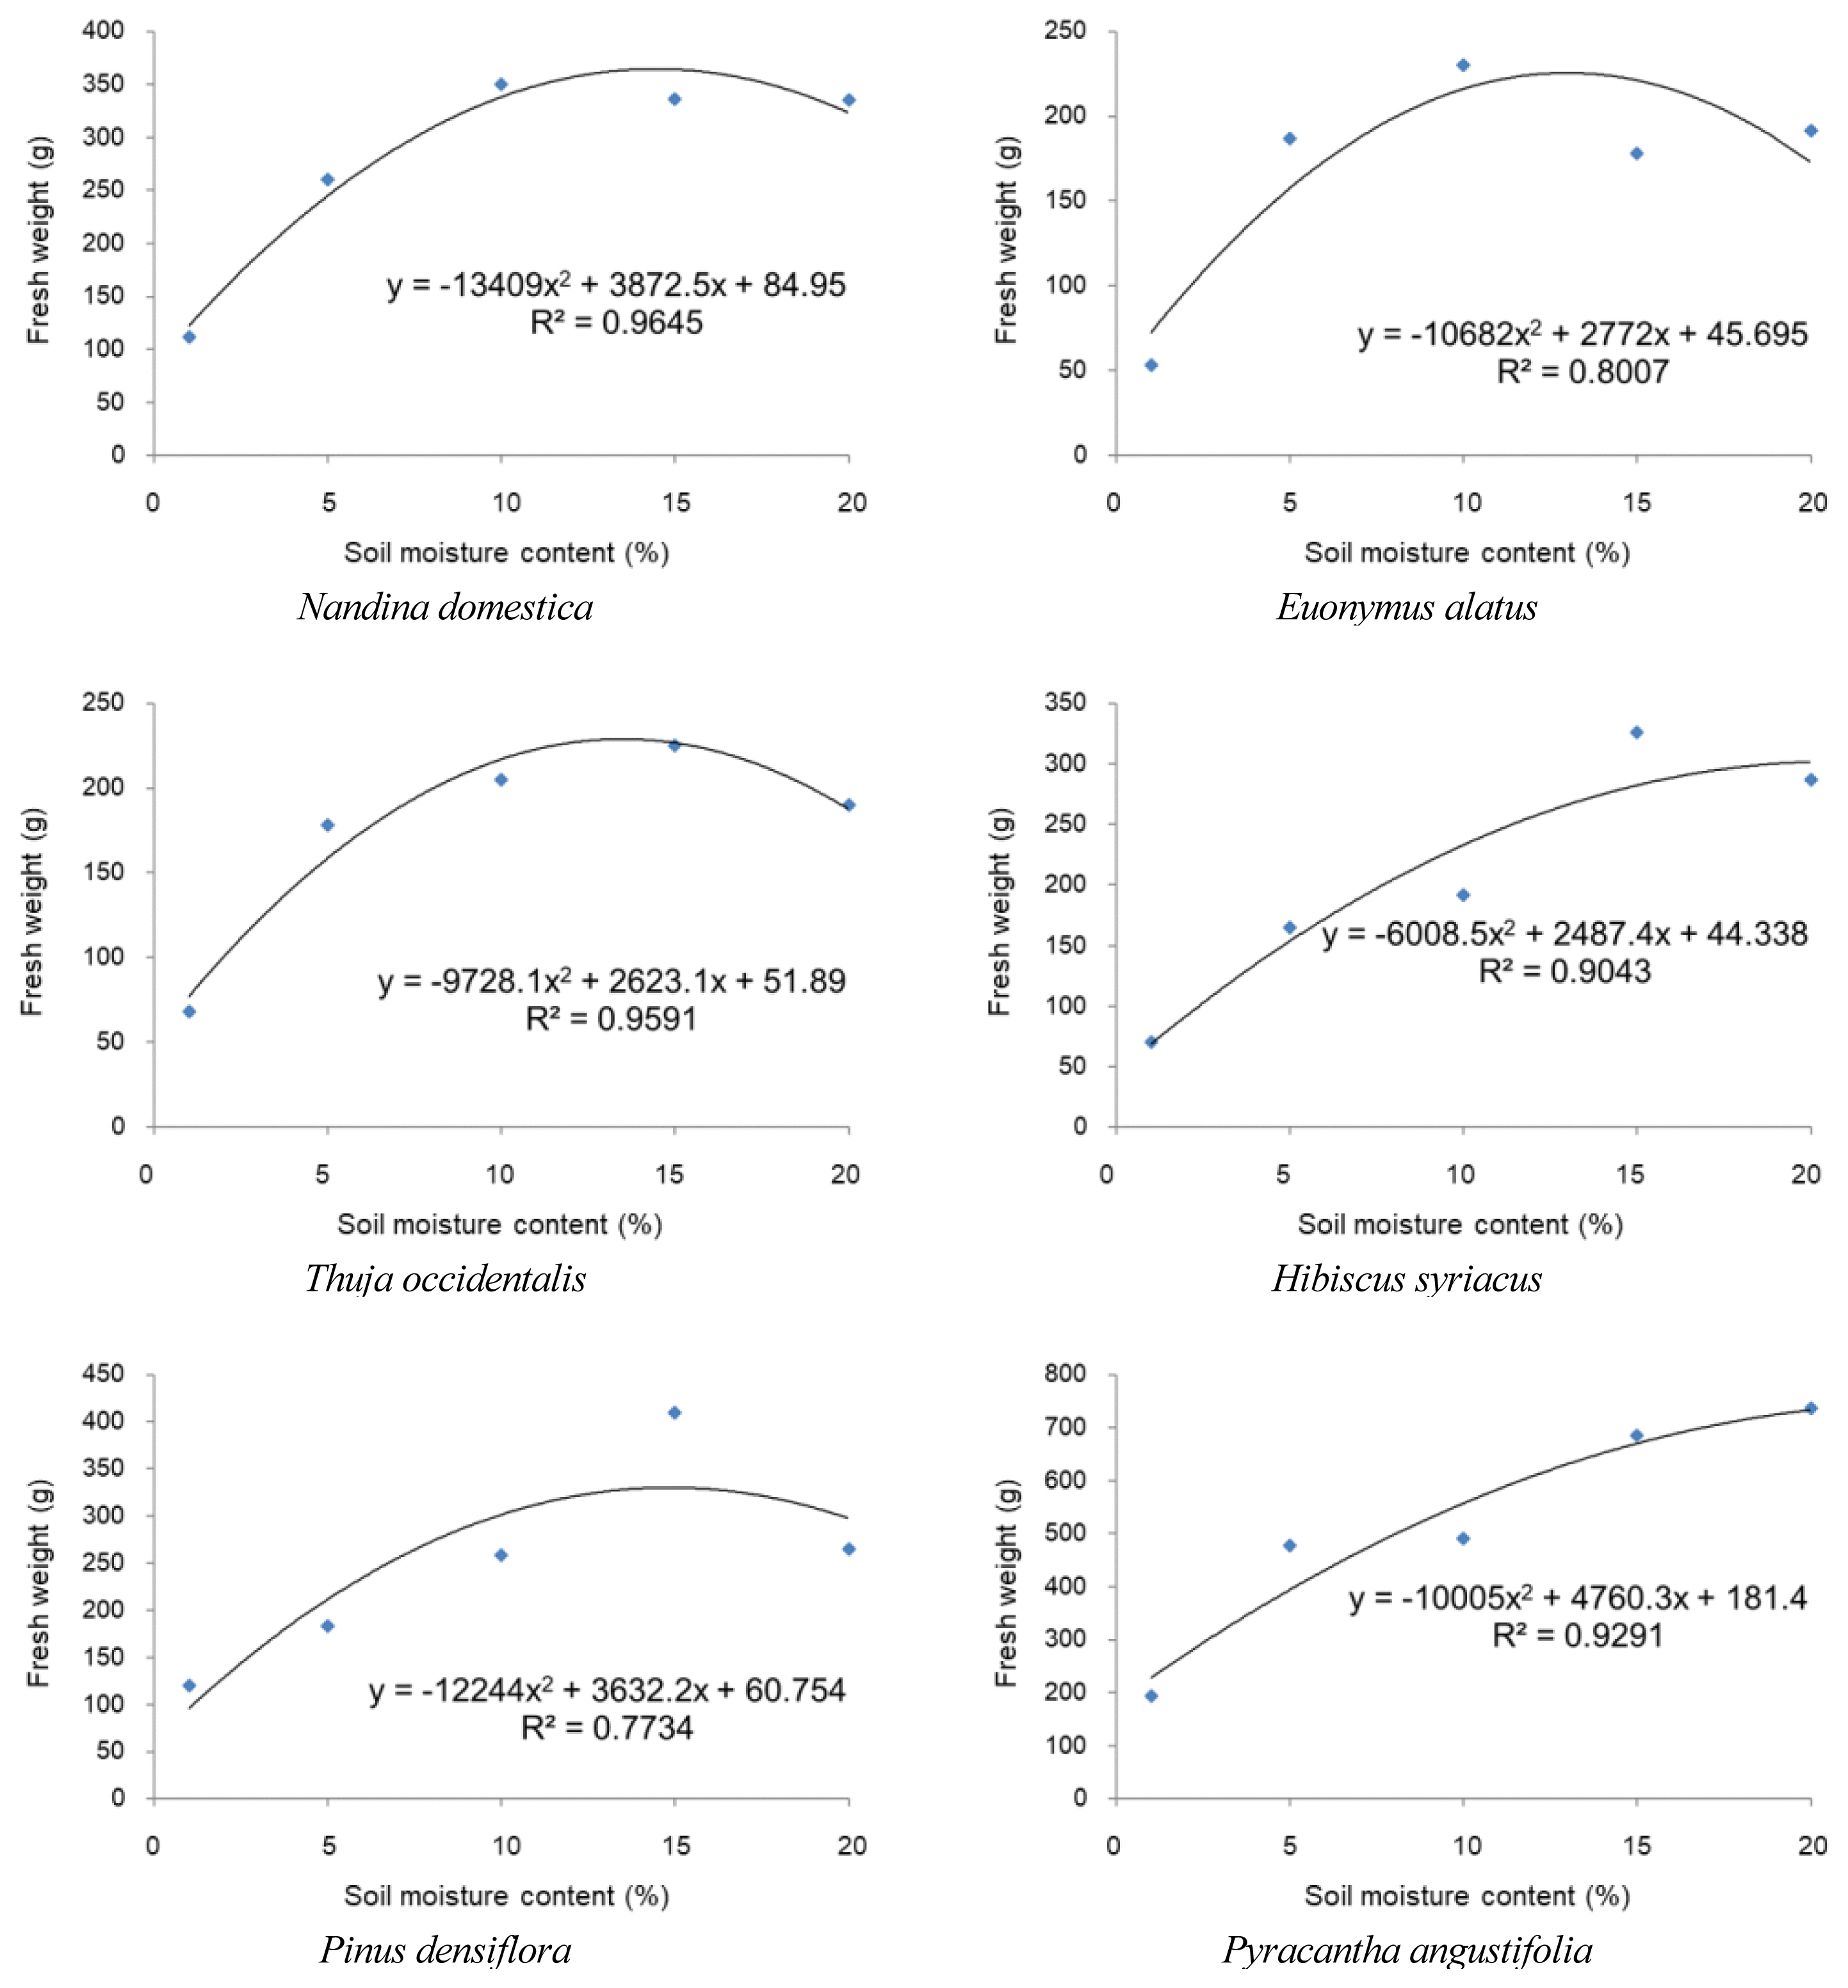
Prediction of irrigation point of each plant based on fresh weight of plants.
Conclusion
This study is to determine the adequate soil moisture for growth of each species by examining and analyzing the growth characteristics of landscaping trees planted in containers with limited soil depth depending on soil moisture content. The results showed that each species showed different growth characteristics depending on the soil moisture content. Considering statistical significance, height growth was high in Thuja occidentalis and Hibiscus syriacus at 15% and higher, and for Pyracantha angustifolia at 10% and higher. Diameter growth was high in Nandina domestica, Euonymus alatus, Thuja occidentalis at 5% and higher. The H/D ratio, which explains the balance between aboveground and underground, was favorable in Pinus densiflora at 1%, 5%, 10%, Hibiscus syriacus at 5% and 10%, Pyracantha angustifolia at 1% and 5%. For aboveground fresh weight, Euonymus alatus and Thuja occidentalis were heavy at 5% and higher, and Hibiscus syriacus, Pinus densiflora, Pyracantha angustifolia at 15% and higher. For underground fresh weight, Euonymus alatus was heavy at 5–15%, Hibiscus syriacus, Pinus densiflora, Pyracantha angustifolia at 15% and higher. The T/R ratio, which is the photosynthesis balance between above ground and underground, was favorable in Thuja occidentalis at 10% and higher, and Pyracantha angustifolia at 10% and 20%. Considering various aspects such as visual quality and economic feasibility including tree height and diameter as well as growth characteristics of rootlet development and fresh weight, the adequate soil moisture content for each species is as follows. Nandina domestica is constantly showing great height growth at 20%, but considering the harmony of aboveground and underground as well as visual quality, having 5% or higher soil moisture content would be enough. For Euonymus alatus and Pyracantha angustifolia, 10% and higher soil moisture content would be adequate considering visual quality as well as height and root diameter growth, and aboveground and underground weight. For Thuja occidentalis. 5% and higher moisture content would result in fine growth considering the state of growth such as diameter, H/D ratio, and fresh weight. For Hibiscus syriacus and Pinus densiflora, 15% would be adequate considering growth amount, fresh weight, and visual quality.
This study has significance in presenting the irrigation point that enables management of trees planted in an environment with limited soil depth to be visually adequate and have favorable state of growth. However, it also has limitations in that the results of growth were limited to 2 years, and that there were differences in growth even though similar sizes of plants were selected. Further studies must continuously monitor the changes in plant growth for sustainability of plants planted in other environments with limited soil depth in addition to just containers.
Notes
This paper was funded by the research project of Rural Development Administration (PJ010252012017)