The Relationship Between the Locational Types and Biodiversity in the Sites of Geumgang Riparian Ecological Belts
Article information

Abstract
Background and objective
This study was carried out to assess the relationship between the internal and external environments and the ecological items in five sites with a high level of artificial use intensity prior to the establishment of Geumgang River riparian ecological belts.
Methods
The sites were classified into forest type, cultivated land type and urbanized type in accordance with their respective locational types. Ecological items including plant ecology such as proportion, naturalization index and urbanization index of native species were analyzed and animal ecology such as the number of species and population of wild birds, amphibians and reptiles, mammals, and butterflies and dragonflies, which are indicator insects, were investigated. In addition, species diversity indices of wild birds, butterflies and dragonflies found in all the subject lands were computed.
Results
Among the plant ecological items, the ratio of native species in the forest type was higher than 90%, which was a satisfactory level, while the naturalization and urbanization indices were less than 10%. The number of species in the animal ecological characteristics was reduced in the order of forest type, cultivated land type and urbanized type. As the results of correlation analysis, the internal area of the planted area showed a negative correlation with the total of individuals. The area of grasslands showed a positive correlation with the number of dragonfly species and the total number of individuals, thereby illustrating that wet grasslands have positive effects. The area of surrounding forests, as an external environment, had a negative correlation with the urbanization index (UI) but a positive correlation with the inhabitation of butterflies and the total number of species.
Conclusion
The results confirmed the need for more diversified special compositions including planted land, grassland, wetland, bodies of water and waterways within the subject land in the wetland ecological belt along with the need for surrounding forest location and preservation from the perspective of purchase and restoration of land for enhancement of wider biodiversity in the future.
Introduction
To manage and improve water pollution in four major rivers in South Korea, the Ministry of Environment established an act on water management and resident support for each river basin and has designated and managed riparian zones based on the act. A riparian zone, as an interface between land and a river or stream, covers soil, plants and animals in the area and plays important roles such as controlling the flow of the river or stream, improving water quality, conserving water sources as well as being habitats for plants and animals (Forman and Godron, 1986). By purchasing lands within riparian zones and creating riparian ecological belts, the government has prevented the influx of non-point pollution sources, strengthened the connectivity of riparian ecosystems, and promoted biodiversity as well as water purification (Kang and Park, 2012).
The Geum River Basin Environmental Office started to purchase the lands within the water source conservation zone including riparian zones in 2003 and created riparian ecological belts for conserving and improving the quality of water sources such as Daecheongho Lake for multiregional water supply. As of December, 2018, 15.497 km2 of the targeted area (1,243 km2) was purchased and except the forest land (8.346 km2), 3.942 km2 of the area that needs to be ecologically restored (6.740 km2) was restored (Geum River Basin Environmental Office, 2019). In particular, since it is important to plan the belt-shaped land purchase one by one considering the creation of riparian ecological belts prioritizing areas with a high inflow load factor (Shim et al., 2014), it is necessary to purchase major non-point pollution sources - urbanized areas such as factories, restaurants, gas stations and residential areas - and create ecological belts by priority at the point of purchasing land based on the land cover classification instead of buying forests or agricultural lands.
Trends in the studies on the riparian zones of the four major rivers were reviewed in this study and were divided into institutional and policy suggestions, creation plans, assessment systems and management plans. Among those on systems and policies on riparian zones, Cho (2010) analyzed and suggested measures to improve the status and problems of land purchase systems that have been implemented under the Act on Water Management and Resident Support in the Yeongsan and Seomjin River Basins. Li and Koo (2017) surveyed the status and recognition of land acquisition for the restoration project in the Dong River basin to identify problems in the project and suggested strategic plans for the effective implementation and management of land acquisition projects appropriate for the environment of Korea. Shim et al. (2014) suggested methods of determining land purchase priorities for improving the water quality of rivers and effectively creating riparian ecological belts in consideration of inflow load factor and access to basins. Ban (2010) wrote landscape-type unit maps and assessed their ecological value to suggest a priority model through an landscape ecological approach for the creation of riparian green spaces. For the purpose of developing a diagnostic assessment method for the creation, conservation and management of riparian ecological belts, Cho and Choi (2014) compared with the evaluation method of riverine forests used in Japan and suggested an appropriate assessment technique. Park (2014) suggested methods of setting items, standards and grades for the ecological assessment of purchased lands within protected areas such as riparian zones, water source conservation zones and ecological and landscape conservation areas. Multiple studies have been also conducted on measures to create riparian zones such as suggesting models and techniques of planning riparian green spaces that reflect natural vegetation structures and setting plant species, standards of planting and models for creating riparian green spaces suitable for the growth conditions of plants (Kim, 2009; Kim, 2011; Park, 2013; Song, 2012). Regarding measures to manage riparian zones, Byon and Lee (2012) surveyed land use status, dominant species, alien species, plant coverage rate and ecological succession in the Yongsan River and Seomjin River riparian zones, divided the zones into conservation, restoration and improvement areas and suggested measures to improve the zones. Oh (2014) conducted a survey on the base environment and ecological environment of the riparian ecological belts created along the Han River, analyzed problems and suggested measures to manage the riparian ecological belts. Back (2019) conducted time series and AHP analyses on the water source conservation zones and riparian zones of the Geum River basin to suggest eco-friendly measures to create highly resilient riparian zones in purchased lands. These earlier studies mostly tended to focus on the classification of riparian zones from an interregional perspective and the creation, assessment and management of riparian zones through status analysis. It has been over 15 years since the riparian ecological belts were created in the Geum River basin, and in this respect this study aimed to conduct a survey on the ecological characteristics of each locational type, to analyze the correlation between the internal and external environments of study areas and their ecological status focusing on the areas that showed a relatively high use intensity before they were purchased and thus to identify environmental factors that affect the areas. By doing so, base data required to establish guidelines for determining land purchase priorities and classifying management types in the future will be provided.
Research Methods
Study sites
Among the riparian ecological belts created in the riparian zones of the Geum River basin, five sites with a high level of artificial use intensity were selected as study sites. Since the selected sites used to be high point and non-point pollution sources such as restaurants, residential areas, farms and rice paddies before the riparian ecological belts were created, this study identified the characteristics of and the relationship between the surrounding land use status after tearing down the facilities and biodiversity. Regarding the criteria for classifying locational types, Kim (2003) pointed out that over 100 m of a vegetation buffer zone near wetlands needs to be created for wild animals to live and move. Park (2014) also classified the types of purchased lands such as setting the areas within 30 m from the boundary of rivers or lakes as a vital zone and the areas beyond 100 m as a buffer zone. Based on this and the land cover classification, this study divided the areas within 100 m from the study sites into forest type, cultivated land type and urbanized type. The aerial orthophotos that were taken in October, 2012 and were provided by the Environmental Geographic Information System were analyzed to obtain land cover maps.
Specifically, the forest type included Jikdong located in Donggu, Daejeon and Namdaemunri located in Hoenammyeon, Boeungu, Chungbuk, and the cultivated land type included Sangjangri located in Munuimyeon, Cheongjusi and Yongbangri located in Iwonmyeon, Okchengun, Chungbuk. The urbanized type included Secheondong located in Donggu, Daejeon (Fig. 1). The area of the sites ranged between 5,845 m2 and 8,667 m2, and they were created between 2005 and 2012. Namdaemunri used to be residential areas and farms and a bio-circulation forest was created mostly with Liriodendron tulipifera in the site in 2005. Supplementary planting was performed in 2012. Secheondong located within the downtown used to have restaurants and a landscape forest was created with Prunus sargentii in the site. Jikdong and Yongbangri used to be rice paddies and wetlands and grasslands were created with herbaceous plants. In Sangjangri, a grassland with Miscanthus sinensis and a woodland with Acer palmatum and Pinus koraiensis were formed (Table 1).

The location map of survey site.

Current status of research sites
Survey content and methods
The study sites used to show a high use intensity in the past and 8–15 years have passed since riparian ecological belts were created. Their internal and external land use status was surveyed and they were divided into plant ecology and animal ecology for analyzing the status of ecology through on-site surveys.
Land use status
The areas within an external radius of 100 m from the study sites were divided into forest type, cultivated land type and urbanized type (artificial facilities like roads and residential and commercial areas) and the internal areas were divided into planting area, grassland and water surface. Their area was calculated individually. A 1/5,000 digital topographic map was used and the area of each type was calculated using ArcGIS 10.1.
Plant ecology
The flora and actual vegetation of the study sites were surveyed. The flora that grew in each study site was recorded on a 1/5,000 digital topographic map. The actual vegetation in the urbanized land was recorded based on its land use status and in the case of planting area, grassland and water surface, major dominant species were recorded. When it was difficult to identify plants on-site, they were collected and identified indoor. Plant species was listed according to the Korean Plant Name Index (KPNI), and naturalized species were identified based on the Korean Naturalized Plants Original Color Illustrated Book (Park, 2001). Based on the surveyed results of the flora, the ratio of native species, the ratio of naturalized species (number of naturalized species observed in a certain area/total number of plant species), urbanization index (number of naturalized species in a certain area/total number of naturalized species distributed across the country) were calculated.
Animal ecology
An animal ecology survey was conducted in three seasons including spring, summer and fall on amphibians and reptiles, mammals and indicator insects such as butterflies and dragonflies, and in four seasons on wild birds. The survey on wild birds was conducted using a line transect method. Using the method, wild birds that appeared within 25 m of the determined line were observed with the naked eye and binoculars while walking down the line, and the number of species and individuals were identified based on their cry and flying. Amphibians and reptiles were surveyed in the wetlands and the existing water systems within the study sites and the observed species, the status of habitats and the location of observation, the number of individuals, etc. were recorded. In the case of mammals, the number of species and individuals were surveyed either by directly observing them or by estimating and recording the excrement, footprints, coverts and traces of small mammals that were expected to live within the study sites. Butterflies as indicator insects were surveyed utilizing a line transect method and the number of species and individuals were recorded by counting them that were observed within 2.5 m of the surveyed line. Species were identified using the method suggested by Ju et al. (1997) and Kim (2002) and their name was found on the Korean Insect Name Book (Entomological Society of Korea and Korean Society of Applied Entomology, 1994). Since butterflies as primary consumers are the prey of secondary consumers and the food source of pollinators and wild birds (Blair, 1999) and are closely related to biodiversity, they were selected as indicator insects. The habitats of dragonflies were also surveyed utilizing a line transect method by recording the name of species and the number of individual imagoes that were observed within 2.5 m of the surveyed line. Those that were difficult to identify accurately were collected using a catcher (diameter 40 cm) to identify their name, and their species and name were identified based on Jung (2007). Dragonflies were selected as they were the secondary consumers that occupy the middle part of the food chain in aquatic ecosystems and are important indicator species from the perspective of biodiversity (Bae, 2016). Shannon’s species diversity was calculated targeting the wild birds, butterflies and dragonflies that were observed in all the study sites. The species diversity index (Equation 1) is a measure that reflects how many species there are in the state of species composition and is a representative value that involves the number of species and evenness (Ludwig and Reynolds, 1988). Shannon’s species diversity is a representative index of species diversity that highlights rarity and covers the number of species and evenness (Pielou, 1975).
N= Total number of individuals observed within an area, ni= Number of individuals of a species observed within an area
The correlation between the status of internal and external land use and biodiversity items by locational type was analyzed to identify influence factors in this study. Pearson’s correlation analysis was conducted on the internal and external environmental variables of study sites as a ratio scale. Statistical analysis was performed utilizing SPSS 12.0 for Window Program and the significance level was 0.05. On-site surveys were conducted three times in April, August and October, 2015, and for wild birds a total of four on-site surveys including the one in January, 2016 were conducted.
Results and Discussion
Status by study site
Land use status
The status of land use within a radius of 100 m from each study site was surveyed as its external status, and the forest rate near Jikdong and Namdaemunri was 72.3% and 52.0% respectively. The distribution rate of cultivated lands near Sangjangri and Yongbangri located near cultivated lands and forests was 49.9% and 55.6% respectively, while urbanized areas near Secheondong adjacent to residential and commercial areas accounted for 47.9%. Their internal environment was also surveyed, and the planting area mostly composed of woody plants in Namdaemunri and Secheondong where bio-circulation and landscape forests were created after riparian ecological belts were created accounted for 70.5% and 92.1% respectively. In Namdaemunri, Liriodendron tulipifera was densely planted and in Secheondong, Ginkgo biloba and Acer palmatum that were planted when there were restaurants in the past were still maintained and Prunus sargentii was planted later in a large area. In Sangjanri, Yongbangri and Jikdong where wetlands and grasslands were created, wetlands and grasslands were maintained and woody plants were observed in Sangjangri. Rice paddies were broadly distributed near Yongbangri, and grasslands mostly with aquatic plants and the surface of water accounted for 61.3% and 38.7% respectively. Sangjangri had step-shaped geographical features and its upper and lower parts were planted with Acer palmatum and Prunus sargentii. Along the bank around rice paddies, Salix koreensis grew and thus the area planted with woody plants accounted for over 50%. Grasslands and the surface of water accounted for 25% and 19.8% respectively. Jikdong had step-shaped terrace paddies surrounded by forests and grass lands where aquatic plants and some herbaceous plants were planted and the surface of water accounted for 90.2% and 9.8% respectively, showing a high cover rate of herbaceous plants (Table 2).

Land use status in the research sites
Plant ecology
To assess the naturality of each study site, the flora of three locational types including forest, cultivated land and urbanized types was surveyed. The number of observed species, the ratio of native species, the ratio of naturalized species and urbanization index (UI) were calculated. The number of observed species (Table 3) ranged between 127 and 219 (169 species on average), and that in Namdaemunri (forest type) was highest. The number in Sangjangri (cultivated land type) was lowest. The number of native species ranged between 108 and 198 (148 species on average), and that of naturalized species ranged between 11 and 32 (21 species on average). Namdaemunri showed the highest number of native species, while Secheondong (urbanized type) showed the highest number of naturalized species (32 species).

Flora of the research sites
Specifically, the overall ratio of native species ranged between 82.4% and 92.4% (87.3% on average). That in Jikdong and Namdaemunri (forest type) was highest (92.4% and 90.4% respectively), and that in Secheondong (urbanized type) tended to be lowest (82.4%). That in Sangjangri and Yongbangri adjacent to cultivated lands (semi-natural ecosystems) ranged between 85% and 86.3% (Fig. 2).
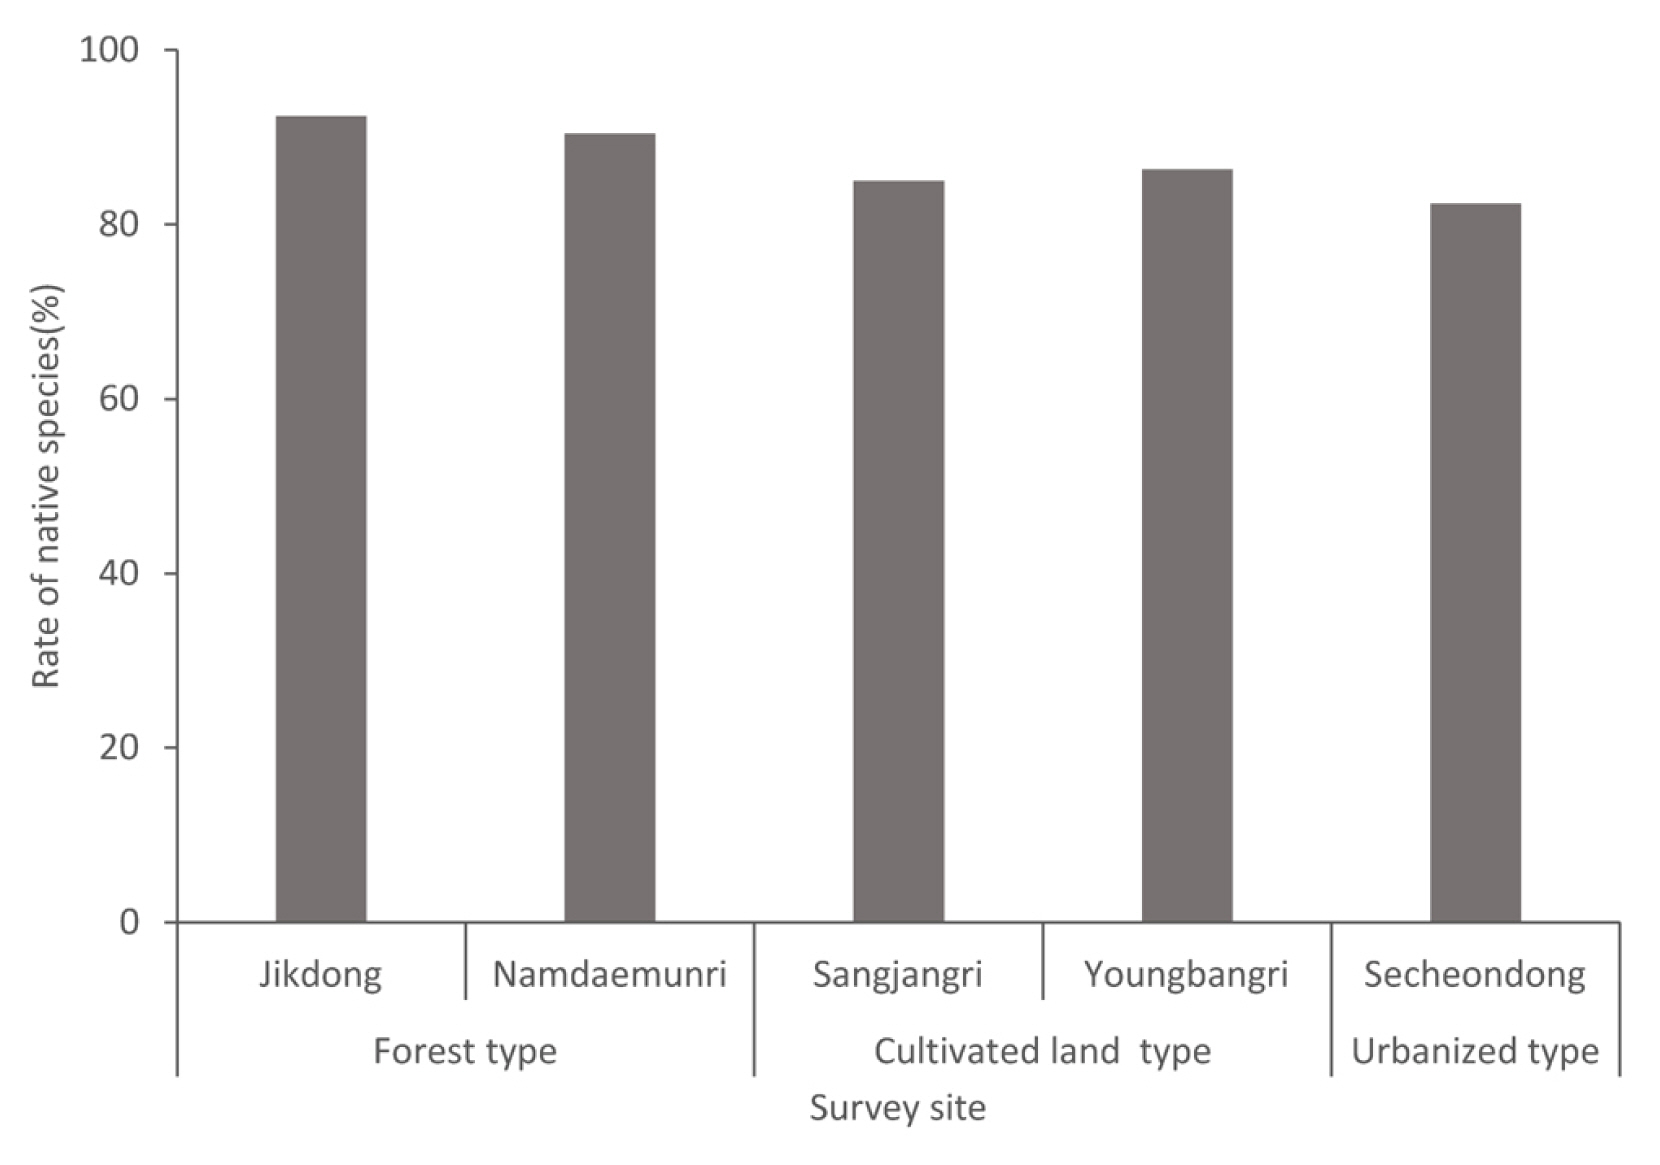
The rate of native species in survey sites.
The ratio of naturalized species (Fig. 3) in Jikdong and Namdaemunri surrounded by forests was 7.6% and 9.6% respectively, followed by cultivated land type (13.7%–15%) and urbanized land type (17.6%). That in Secheondong situated alongside roads and thus adjacent to commercial areas was highest. Such naturalized species are known to reduce the richness of native species and cause a decrease in naturality and the quality of habitats (Holmes et al., 2008; Richardson et al., 2007; Sax, 2002).

The rate of naturalized species in survey sites.
Urbanization index (UI) is an index that measures the level of the destruction of nature, that is, the level of urbanization (Yim and Jeon, 1980). The overall UI of the study sites (Fig. 4) ranged between 3.4% and 10%, and that of Jikdong (forest type) was lowest (3.4%), while that of Secheondong (urbanized type) was highest (10%). Compared to the results of earlier studies, the ratio naturalized species in Jikdong and Namdaemunri was similar to that of Mt. Daedun Provincial Park (7.7%) and the UI of the two sites (3.4%–6.5%) was lower than that of Mt. Daedun Provincial Park (10.6%; Park et al., 2018), showing relatively good conditions.

The urbanization index in survey sites.
Animal ecology
(1) Number of species and individuals
Jikdong and Namdaemunri of which surrounding land use was forest type showed the highest number of species (58–59 species). That in Sangjangri and Yongbangri (cultivated land type) ranged between 41 and 53, while that in Secheondong (urbanized type) was 31 (Fig. 5).

The number of species in survey sites.
The number of individuals was 254–312 species in the study sites of forest type, 190–313 species in those of cultivated land type, and 143 species in that of urbanized type (Fig. 6). In particular, Namdaemumri where a bio-circulation forest was created within its forests showed the highest number of wild birds (24 species), and Secheondong located within an urbanized area showed a relatively high number of wild birds (18 species), which can be attributed to the fact that large pole trees that have been grown since long before the forest was restored are mixed together in its planting area and thus that it has favorable environmental conditions for the feeding, hiding and inhabitation of wild birds. The number of individual dragonflies in Jikdong and Yongbangri where terrace rice paddies were distributed was 93 and 164 respectively, indicating that they have favorable conditions for inhabitation such as wet grasslands and open water surface.

The number of individuals in survey sites.
(2) Biodiversity
The biodiversity of the study sites was analyzed (Table 4), and the biodiversity of wild birds ranged between 0.5940 and 1.1423, showing the highest value in Namdaemunri and the lowest value in Yongbangri located near broad cultivated lands. The stable ecological niche of wild birds seemed to be formed as there were forests outside Namdaemunri and various types of vegetation environments including bio-circulation forests created within the study site such as Liriodendron tulipifera and Pinus koraiensis forests, trees that have grown naturally such as Morus alba and Spiraea prunifolia and shrublands near the boundary of forests such as Stephanandra incisa, Clematis apiifolia, Rubus crataegifolius and Rosa multiflora. The biodiversity of wild birds in Secheondong (urbanized type) was also relatively high (1.0118), which can be attributed to the fact that when tearing down restaurants lage pole trees such as Ginkgo biloba and Acer palmatum were maintained, while Prunus sargentii, a fruit plant, was planted in a large area. The biodiversity of indicator insects including butterflies and dragonflies in the study sites ranged between 0.6597 and 1.0415. The value in Jikdong and Sangjangri where wetlands with an open water surface and some grasslands were distributed was high (0.7578–1.0415), while that in Secheondong (urbanized type) was relatively low (0.6597–0.7595).

Species diversity index of location types
Correlation between the ecological status of study sites and internal and external environments
The correlation between the internal and external environments and ecological items in the five study sites of which artificial intensity was high before the Geum River ecological belts were created was analyzed and the results were as shown in Table 5. Since the area of the study sites as an internal environment and surveyed items did not show any statistical significance, the area of the study sites itself did not seem to have a significant impact on the inhabitation of plants and animals. The planting area of the study showed a negative correlation with the total number of individuals (r = −.892, p = .042), and the grassland showed a positive correlation (r = .898, p = .038). The results can be attributed to the fact that the number of individuals in Jikdong and Yongbangri (313) of which average ratio of grasslands was 75.8% without planting areas distributed was over 1.5 times on average higher than other study sites. In addition, the area of grasslands within the study sites and the number of butterfly species showed a positive correlation (r = .879, p = .049). As their grasslands were mostly wetland-type terrace rice paddies, the results were identical to those of Kim et al. (2018) that the number of dragonfly species tends to increase in land use types where those with an open water surface are partially distributed such as wetlands unlike fields, orchards and planting areas. These results seemed to be obtained since the number of dragonfly individuals was significantly higher than other items in Jikdong and Yongbangri of which locational type was wetland and grassland. The area of forests as external environments near the study sites showed a negative correlation with urbanization index (r = −.889, p = .043) and a positive correlation with the total number of observed species (r = .913, p = .03), the number of butterfly species (r = .919, p = .027) and their biodiversity (r = .937, p = .019). The results indicate that areas of which land use in surrounding areas is forests have a positive impact on the richness of various species than cultivated lands such as rice paddies, fields and orchards or urbanized lands, and in particular that it is necessary to create various types of spaces within target sites for the inhabitation of butterflies such as planting areas, grasslands and those with a water surface and also to secure and conserve forests near the target sites. That is, wetlands and grasslands surrounded by forests provide favorable spaces for the inhabitation of butterflies as Kim et al. (2014) pointed out that maintaining multi-layered forest vegetation contributes to the formation of spaces for the inhabitation of various species. When the land use type of surrounding areas was urbanized type, the study site showed a negative correlation with the ratio of native species (r = −.903, p = .036), the total number of species (r = −.886, p = .045), the number of herptile species (r = −.982, p = .003) and the number of dragonfly species (r = −.891, p = .043). In particular, there was no statistically significance in the correlation between the appearance of wild birds and mammals and the surveyed internal and external items, which can be attributed to the similar number of species and individuals in the surveyed sites.

The correlation between the internal and external environment of the site and the ecological items
Conclusion
This study examined the correlation between internal and external environments and the status of plant and animal ecology after creating the Geum River riparian ecological belts in the study sites of which artificial use intensity was high before the riparian ecological belts were created. As study sites, five sites that used to be farms, restaurants and rice paddies were selected and their external environments within 100 m from the study sites were divided based on their land use status into forest type, cultivated land type and urbanized type. The internal environments were divided into planting area, grassland and water surface. The results of the survey on the ecological environments showed that the ratio of native species in terms of plant ecology in Jikdong and Namdaemunri (forest type) was 92.4% and 90.4% respectively, and that in Secheondong (urbanized type) tended to be low (82.4%). The ratio of naturalized species in Jikdong and Namdaemunri surrounded by forests was 7.6% and 9.6% respectively and the value tended to increase in the cultivated land type (13.7%–15%) and the urbanized type (17.6%). The urbanization index (UI) of the forest and cultivated land types ranged between 3.4% and 7.5%, while that of Secheondong (urbanized type) was highest (10%). The total number of observed species in terms of animal ecology in the forest type was highest (59 species on average), followed by the cultivated type (47 species on average) and the urbanized type (31 species on average), and the number of individuals showed a similar tendency - on average 283 individuals in the forest type, 252 individuals in the cultivated land type and 143 individuals in the urbanized type. Specifically, many wild birds species (24 species) were observed in Namdaemunri where bio-circulation forests was created in its neighboring forests and that in Secheondong located within a urbanized region was relatively high (18 species) as large pole trees that have been grown since long before the restoration co-existed within its planting area. In addition, the forest type that was surrounded by forests and had grasslands distributed partially showed a high number of butterfly species (19 species on average). The number of individuals of dragonfly species in Jikdong and Yongbangri where wet grasslands with terrace rice paddies are broadly distributed was high (93–164 individuals) and that in other studies sites of which the area of the planting area was high ranged between 40 and 63 individuals. Their various wetland environments with terrace rice paddies seemed to have a positive impact on the inhabitation of dragonflies, since dragonfly species show various spawning behaviors such as spawning in water systems or in the body of plants or in the water systems where plants grow (Jung, 2007). The biodiversity of the study sites was also analyzed and that of wild birds ranged between 0.5940 and 1.1423, showing the highest value in Namdaemunri. The overall biodiversity of butterflies and dragonflies selected as indicator insects ranged between 0.6597 and 1.0415. Butterflies were observed near the boundary of forests, and their biodiversity was high in the forest type. In Jikdong and Sangjangri with a high distribution rate of aquatic plants, the biodiversity of dragonflies tended to be high. The correlation between the internal and external environments of the study sites and ecological items was also analyzed, and the area of the planting area of the study sites had a negative correlation with the total number of individuals, which can be attributed to the concentrated number of dragonfly individuals in the study sites that had relatively less planting areas. The area of grasslands had a positive correlation with the number of dragonfly species and the total number of observed individuals, indicating the positive effects of wet grasslands. In terms of external environmental factors, the area of forests near the study sites showed a negative correlation with urbanization index (UI) and a positive correlation with the total number of observed species and the inhabitation of butterflies. The area of urbanized areas near the study sites showed a negative correlation with the ratio of native species, the total number of observed species, the number of observed herptile species and the number of observed dragonfly species. This study examined the correlation between the internal and external environments and the status of ecology after creating riparian ecological belts in the five study sites of which use intensity was high. Currently, the land purchase within riparian zones is performed according to the criteria set for each land use, regulated zone and pollution source and additional scores (Geum River Basin Environmental Office, 2019), but it will be necessary to consider the land use status of surrounding lands and ecological characteristics of target sites when purchasing and restoring the lands in order to strengthen the resilience of biodiversity restoration. In particular, for sites with high naturality and rich biodiversity such as artificially used sites near forests or sites like step-shaped cultivated lands, it is necessary to set priorities and establish measures to monitor the sites. Since this study comprehensively analyzed the correlation between the internal and external environmental factors of the study sites that showed a high use intensity before land purchase and their ecological status, the detailed environmental characteristics of each study site were not considered. In particular, it will be necessary to survey detailed items, for example, for the inhabitation of dragonfly species, dividing their habitats into wetlands and grasslands or surveying items such as water depth and the cover rate of floating leaved plants and aquatic plants. An additional study will be required to suggest application techniques and monitor each target site considering the internal and external environmental factors of each site and the characteristics of inhabitation.
Acknowledgements
This research was funded by a 2017 research grant from Sangmyung University.