The Effects of Agriculture as a Family Business on Agriculture College Students’ Agro-entrepreneurship
Article information
Abstract
The Purpose of this study was to develop Agro-entrepreneurial education program for agriculture college students, In order to investigate the relationship between the types of agricultural starup business and the entrepreneurial intention, we surveyed 224 Agriculture college students in the 3rd and 4th grades using a questionnaire. The results of this study are as follows: First, college students majoring in agriculture have very low interest in establishing agricultural business. Second, there is a difference in the perception of agricultural entrepreneurship between agriculture college students who are engaged in farming as family business and those who do not. agriculture college students who are engaged in farming as family business (Successive Students). The effect of entrepreneurship on entrepreneurship was different by family business for successive students, initiative and challenge spirit had a significant impact on the agro-entrepreneurial intention. otherwise, non successive students have impacted by innovation and social responsibility. Third, in terms of entrepreneurship, the lower the challenge spirit, the greater the willingness to start an agriculture business. The results supported that for agriculture college students, in order to educate individual customized farming management, it is necessary to confirm whether or not agriculture is a family business.
Introduction
The employment rate in agriculture and ratio of engagement in farming by agricultural college graduates are very low at 5.9% and 4.2% respectively in 2008, showing poor inflow into the field of farming (Ma and Park, 2008). The statistics in 2013 also showed that the ratio of self-supporting people among agricultural college graduates was merely 10.9%. One of the causes is the lack of experts with management skills for advanced agricultural facilities and specialized technology in items due to the absence of practice-based education (Jeong, 2015). Another thing is that it is necessary to change the perspective from merely nurturing agricultural workers as laborers to be engaged in the primary industry to nurturing specialized human resources who manage farming as a business and support upstream and downstream businesses of agriculture (Ma et al., 2013).
This is because there is a rising need to nurture knowledge-based agricultural workers to meet the 21st-century knowledge-based society. In other words, unlike the past, people live in a knowledge-based society today and thus have shorter lifespan of knowledge. Thus, in terms of qualifications for agricultural workers, it is necessary to improve the direction for agricultural education to develop more specialized skills by polishing up the basic qualifications to generate and utilize knowledge and information so that new agricultural workers can adapt to the rapidly changing knowledge and information in agriculture.
Jyung et al. (2001) argued that the right kind of human resources required by 21st-century knowledge-based agriculture has a good balance of the basic qualities (basic agricultural knowledge, etc.) and specialized qualities (specialized knowledge, agricultural management skills) as an agricultural worker, as well as the basic qualities (communication skills, etc.) and specialized qualities (ability to create and share knowledge and information) as a professional worker. Ma et al. (2011) defined the image of specialized agricultural workers as agricultural workers living a good life with their careers in pride, professional managers with specialized techniques and management skills, and ethical producers fulfilling social responsibility.
Furthermore, to increase new inflow of specialized agricultural workers that received agricultural education into the field of farming, it is necessary to clarify the sense of purpose and constantly encourage achievement motivation for potential agricultural workers to set their career path to agriculture by developing and supplying career paths for each category and step of business startup and succession of specialized agricultural workers. This would promote interest and attractiveness of agriculture, thereby facilitating inflow of outstanding workers in the field of agriculture (MAFRA, 2015).
Recently, it is inspiring to find that agriculture as the 6th industry is contributing to increased attractiveness of agriculture by having agricultural college students to perceive agriculture not only as labor but as a business. Agriculture as the 6th industry is a series of activities that lead to the convergence of production, processing, distribution, sales and tourism services using resources that exist in rural areas (Park, 2013). These activities enable them to be engaged in business that creates new values by developing processed goods, connect to the restaurant business, and respond to tourism, interaction, healing and welfare (Kwon, 2014), which made agricultural college students perceive agriculture as a business beyond just labor.
The career choices of students are determined by individual characteristics such as inner motives and interests, family characteristics such as parents’ occupations and education levels, and lastly the characteristics of the highest level of schooling (Jang and Lee, 2012). In particular, as a result of investigating the effects on career choices and decisions of agricultural college students in the agricultural industry, their intention to choose a career in agriculture and forestry services was highest at 30.2%, and important factors related to such intention were their parents’ attitude toward entering the agricultural industry, and knowledge and experience in the industry. In particular, agricultural college students showed a statistically significant correlation among major, reason to enter, approval of parents, and knowledge and experience in agricultural business. Those majoring in agriculture (plant resources), who attended an agricultural college according to their own aptitudes and will, whose parents approve of their entry into the agricultural industry, and who better understand the value chain of agrifoods tended to have high intention of choosing a career in the agricultural industry (Ma and Kim, 2017).
Comparing the characteristics between succession of agricultural business and getting a new job or starting up a business, settlement as a farmer is relatively more advantageous when it is done by business succession than by starting up, mainly in terms of nurturing managers or building business or living foundations. Such advantage is also a benefit of family agricultural business. As a result of analyzing factors that affect settlement as a farmer, those from a farming family that graduated from an agricultural college and are at a young age tended to be engaged in farming in the form of succession due to financial reasons (Kim and Ma, 2005). Agricultural workers succeeding to business can save about 5 years in acquiring harvesting technology and agricultural product sales skills compared to new startup farmers, and also have share close ties with local residents (Lee and Goh, 2014). However, while startup farmers secure funds and obtain farming technology with their own individual efforts, successive farmers inherit such resources from their parents. Such management techniques or philosophies are fully inherited without any changes from previous generations, which may hinder new market explorations or expansions due to lack of innovation (Ma and Kim, 2010). This study is conducted based on the difference in the perception of new agricultural startups, especially entrepreneurship like innovation, between students engaged in agriculture as a family business and students that are not.
Research Method
Research subjects and method
Research subjects
To determine the relationship between the types of agricultural startup of agricultural college students and their startup intention according to entrepreneurship, a survey was conducted on 224 agricultural students in the third and fourth years at G University in Gyeongnam from October 3 to 14, 2016. As shown in Table 1, the distribution of demographic characteristics among research participants shows that there are 103 men (46.0%) and 121 women (54.0%), and their majors are related to the 6th industry such as animal life science, forest resource science, horticulture, and food science.
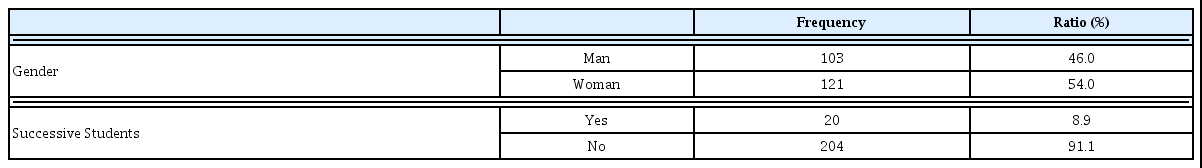
Distribution of demographic characteristics among research groups (N=224).
Entrepreneurship measurement survey
As a result of exploratory factor analysis on entrepreneurship, while there were 9 factors of 6th industry entrepreneurship measurement tools (Kim et al., 2016), there were 6 factors in this study as a result of factor analysis even though the same questionnaire was used. The 6 entrepreneurship factors explained 80.193% of total variance, and the reliability of each factor was high at more than 0.914.
As for the result of exploratory factor analysis on entrepreneurial intention that is the dependent variable, 5 variables as shown in Table 3 explained 87.997% of total variance, and the reliability of the questionnaire was very high with Cronbach’s Alpha=.965.

Explanatory factor analysis result for 6th industry entrepreneurship.
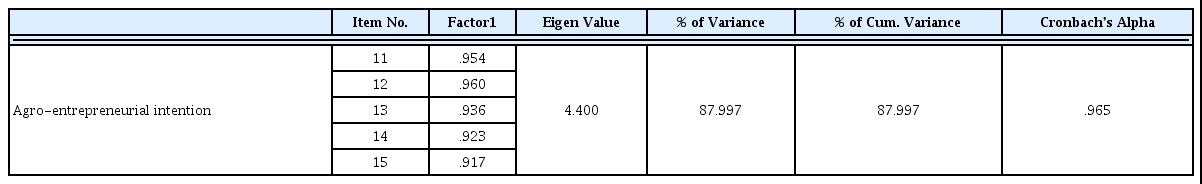
Agro-entrepreneurial intention Factor Analysis.
Data processing method
All data were statistically analyzed using SPSS 21.0, and common factors were extracted by conducting exploratory factor analysis on measurement variables about agro-entrepreneurial intention, 6th industry entrepreneurship, interest by type of agricultural startup. Principal component analysis was used for extraction, and the analysis was done using a varimax rotation with an eigenvalue of at least 1.0 and factor loading of at least 0.4. The scores of extracted factors were used in the hierarchical analysis according to succession. For more in-depth exploration, a logistics regression analysis was conducted according to agro-entrepreneurial intention to analyze the influence of 6th industry entrepreneurship according to succession. Moreover, the different perception about agro-entrepreneurial intention and 6th industry entrepreneurship according to succession was tested using independent samples t-test. The significance level of all analyses is α=.05.
Results and discussion
Descriptive statistics of research variables
This study determined the descriptive statistics of research variables among the research participants. As shown in Table 4, all research variables followed the normal distribution through the level of skewness and kurtosis, and agroentrepreneurial intention was very low with an average of 1.91. Interest by type of agricultural startup was minimum 2.02 and maximum 2.43 on average, which is also very low, and most interest in startup type turned out to be similar. As for 6th industry entrepreneurship, innovation, challenge spirit and initiative were average level, while social responsibility, risk sensitivity and networking capabilities were very low.
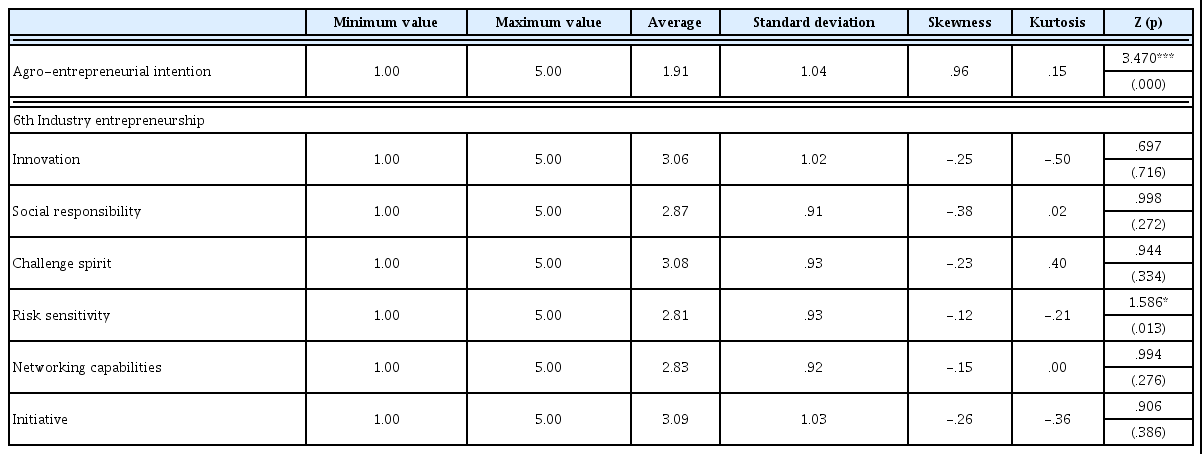
Descriptive statistics of research variables.
As shown in Fig. 1 and Fig. 2, entrepreneurial intention shows skewness in the right tail of the distribution, indicating that students have no intention of agricultural startup. Thus, in addition to multiple regression analysis through raw data, an additional analysis will be conducted using logistics regression analysis that distinguishes the case with intention from the case without intention. 187 (76.6%) out of all participants had no agro-entrepreneurial intention, and 57 (23.4%) somewhat had certain intention.
Histogram of agro-entrepreneurial intention

Histogram of Standarized agro-entreprenurial intention
Including test of differences between successive and non-successive students
As a result of examining the difference in agro-entrepreneurial intention and 6th industry entrepreneurship between successive and non-successive students through an independent samples t-test, it was found that as shown in Table 5, agro-entrepreneurial intention showed an average of 1.81 for non-successive students, but 2.98 for successive students, showing that agro-entrepreneurial intention was higher for successive students. However, the level was not very positive.
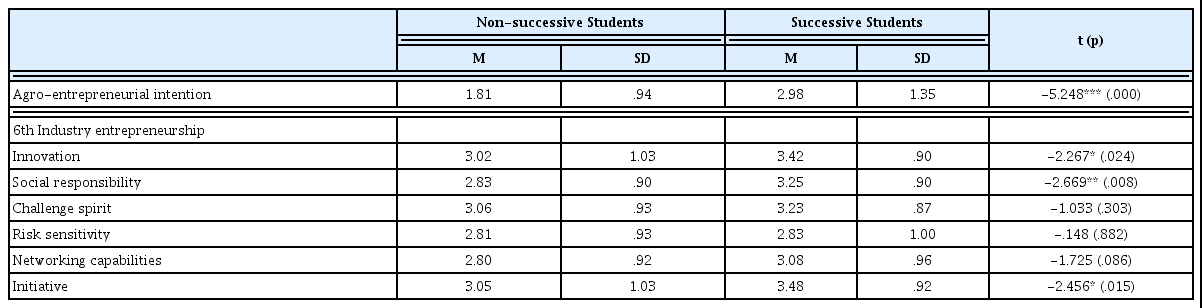
Descriptive statistics of research variables with difference certification.
As for 6th industry entrepreneurship, successive students showed high innovation, social responsibility and initiative, while other factors showed no difference between the two types.
Correlation between agro-entrepreneurial intention and 6th industry entrepreneurship
As a result of examining Pearson’s correlation coefficient to determine the correlation between agro-entrepreneurial intention and 6th industry entrepreneurship, as shown in Table 6, agro-entrepreneurial intention only showed a positive correlation with innovation (r=.192), social responsibility (r=.271), networking capabilities (r=.143), and initiative (r=.185) among 6th industry entrepreneurship, with very low correlation.
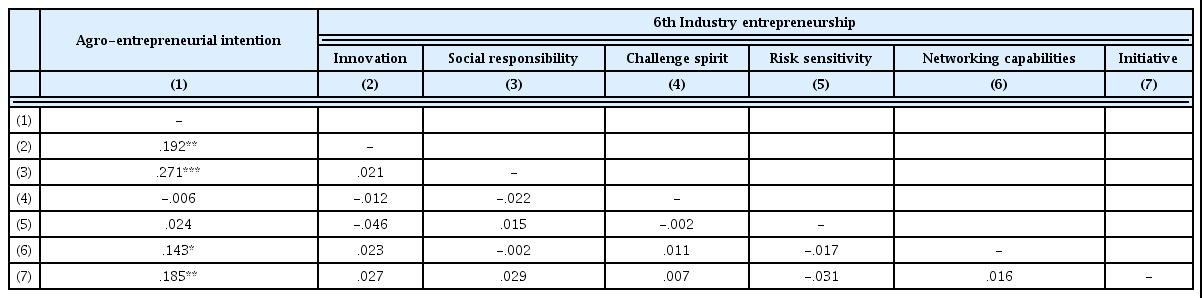
Correlation among research variables.
1) Moderating effect of succession status on the effect of agro-entrepreneurial intention according to entrepreneurship
The following is the result of hierarchical multiple regression analysis on the effect on entrepreneurial intention according to entrepreneurship. As shown in Table 7, in Model 1, 6th industry entrepreneurship had a significant effect on agro-entrepreneurial intention, which became stronger with higher innovation, social responsibility, network capabilities, and initiative in particular. The explanatory power of this model is 15.8%, and the regression model turned out to be statistically significant (F=7.421, p<.001). However, risk sensitivity failed to follow normality, and thus Model 2 that excluded risk sensitivity showed similar results as Model 1. In other words, even though risk sensitivity was excluded, higher innovation, social responsibility, network capabilities, and initiative led to stronger agro-entrepreneurial intention. Challenge spirit turned out not to affect agro-entrepreneurial intention at all.
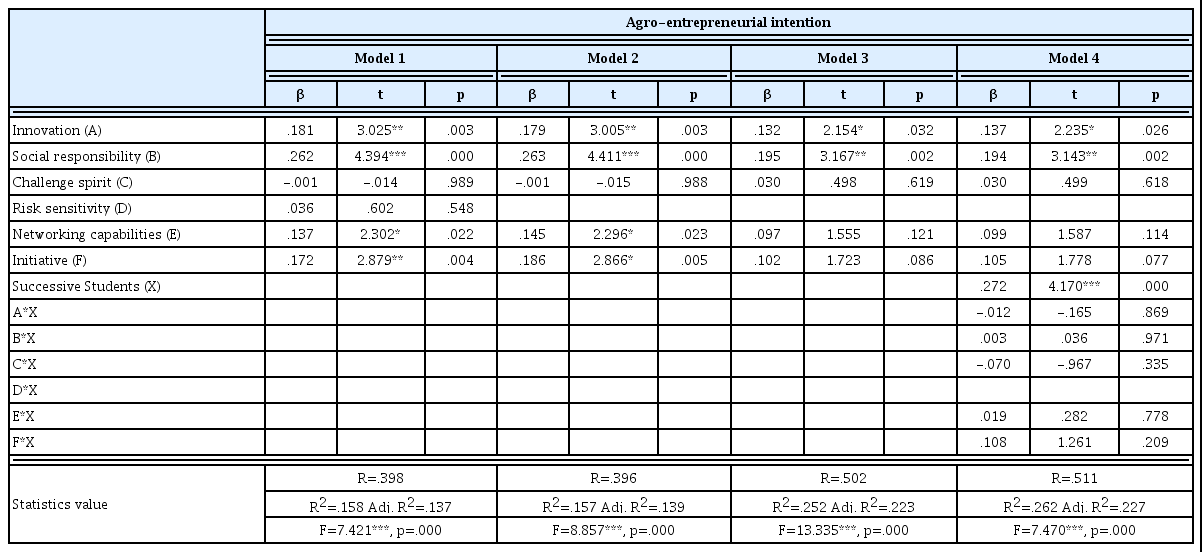
Analyze the Influence of agro-entrepreneurial intention on 6th industry entrepreneurship (multiple regression analysis).
Next, in Model 3 that excluded risk sensitivity and included the moderating variable of successive students, networking capabilities among 6th industry entrepreneurship turned out not to have a significant effect on agro-entrepreneurial intention with the significance level of 10%. However, this factor can be considered if there are many samples at this level. In addition, Model 3 that included succession status had an increased explanatory variable of 9.5% compared to Model 2, which shows the importance of the factor.
In Model 4, which included the interaction effect between independent variables and succession status, there was no interaction effect by all 6th industry entrepreneurship factors and succession status, with only the main effect by succession status. VIF of the final model was 1.104~2.296 and Dubin-Watson=1.716, showing that there is no multicollinearity of this model, and the explanatory power of the model was 26.2%.
However, as a result of residual analysis of this model, some measures were slightly off the normality on p-p plot (Fig. 3). For this reason, an additional logistics regression analysis was conducted by distinguishing the case with agroentrepreneurial intention and the case with no intention by dividing the dependent variables into two cases.

P-P plot of the standarized observed and expected values.
As shown in Table 8, in Model 5 that included risk sensitivity, higher innovation and social responsibility among 6th industry entrepreneurship led to more agro-entrepreneurial intention. Initiative served as a positive factor at the significance level of 10%. The explanatory power of the model was 11.3% (Cox & Snell R2) and the classification accuracy was 77.7%. However, Model 6 that excluded risk sensitivity showed similar results as Model 5, and the classification accuracy of the model was increased by 0.1% to 77.9%.
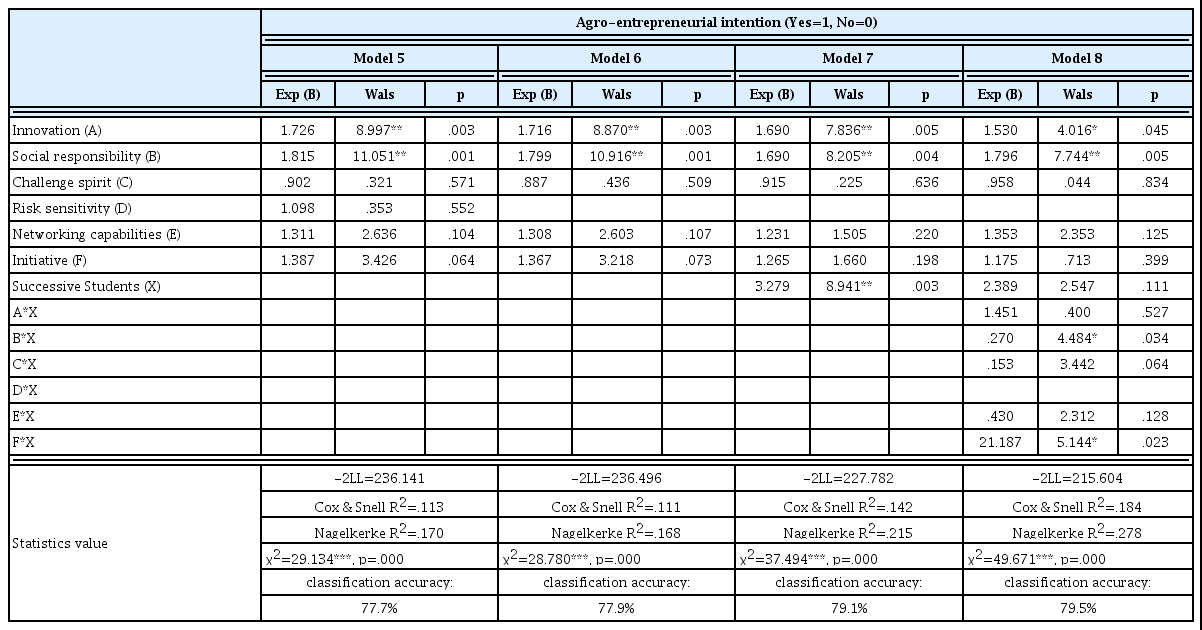
Analyze the influence of agro-entrepreneurial intention on 6th Industry entrepreneurship (logistic-regression analysis).
Therefore, for Model 7 that included succession status, this served as the biggest factor, and only innovation and social responsibility served as a highly important factor as 6th industry entrepreneurship. The explanatory power of the model was increased by 3.1% to 14.2%, and the classification accuracy was 79.1%.
To verify the moderating effect of succession status, Model 8 included the interaction effect between succession status and 6th industry entrepreneurship, which showed a different effect from the aforementioned hierarchical analysis. In the multiple regression analysis, there was no interaction effect between succession status and independent variables, but logistics regression analysis showed interaction effect between social responsibility and successive students, and initiative and successive students. The interaction effect between challenge spirit and successive students also appeared at the significance level of 10%.
In other words, as shown in Table 9, successive students are accompanied by initiative and challenge spirit, whereas non-successive students are only significantly affected by innovation and social responsibility, without any effect from initiative and challenge spirit. Thus, for students whose parents are not engaged in agriculture, innovation and social responsibility are the most important factors, and their agro-entrepreneurial intention can be increased by nurturing these factors. On the other hand, for students whose parents are engaged in agriculture, they need initiative and challenge spirit more than others.
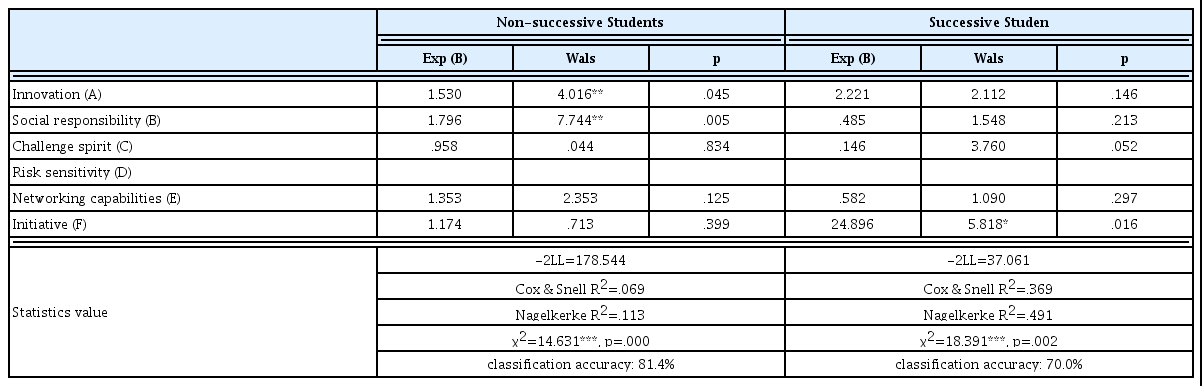
Logistic-regression analysis of 6th industry entrepreneurship Influenced by family business.
It has been reported that home environment and satisfaction in entrepreneurship education have an indirect effect on entrepreneurial intention mediated by career orientation (Park et al., 2011). To encourage entrepreneurial intention of college students, it is most important to nurture entrepreneurship through entrepreneurship education (Shim and Lee, 2015). In sum, to encourage systematic agro-entrepreneurial intention of new agricultural workers through college education, it is necessary to provide systematic education of customized entrepreneurship in association with the occupations of the students’ parents to instill entrepreneurial intention, through which agricultural startups will increase.
Conclusion
As a result of measuring the interest in agricultural startup among 224 agricultural college students in G University located in Gyeongnam, it was found that their interest was very low, and so was their agro-entrepreneurial intention. However, in the comparison between students that are engaged in agriculture as a family business and students that are not, the former had significantly higher agro-entrepreneurial intention. In the moderating effect of succession status regarding the effect of agro-entrepreneurial intention according to entrepreneurship, it was found that agro-entrepreneurial intention became stronger for successive students. Among 6th industry entrepreneurship, successive students showed high innovation, social responsibility and initiative, while other factors showed no difference between successive and nonsuccessive students. Agro-entrepreneurial intention only showed positive correlation with innovation, social responsibility, networking capabilities and initiative among 6th industry entrepreneurship, and agro-entrepreneurial intention turned out to be stronger with higher innovation and social responsibility.
The logistics regression analysis showed an interaction effect between social responsibility and succession status, and initiative and succession status. The interaction effect was also significant between challenge spirit and succession status. Successive students whose parents are engaged in agriculture were accompanied by initiative and challenge spirit, while non-successive students only had innovation and social responsibility that significantly affected agro-entrepreneurial intention.
Therefore, innovation and social responsibility are the most important factors for those whose parents are not engaged in agriculture. Once these factors can be nurtured through education by reflecting them on curriculums and extracurricular programs, agro-entrepreneurial intention of students will increase. For those whose parents are engaged in agriculture, their agro-entrepreneurial intention can be cultivated through education that promotes initiative and challenge spirit.
In conclusion, it is necessary to run various curriculums and extracurricular programs to cultivate entrepreneurship aside from agricultural education in order to provide career paths for agricultural college students. In particular, for such entrepreneurship education, prior investigation and counseling must be done in order to identify the parents’ occupations to distinguish successive and non-successive agricultural students, which will contribute to the inflow of new selfsupporting agricultural workers.