Evaluation Model of the Negative Air Ion Generation due to the Square Type of Green Space
Article information
Abstract
This study analyzed the placement shape and correlation of green space focusing on anion that is one of curing substances. As its result, it was found out that the meteorological element becomes different and the generated amount of anion also gets different along such different meteorological element in case the shape of placing green space. As the result of analyzing the correlation with meteorological element , it was analyzed that it was the positive correlation in case of time, temperature and relative humidity and it was also analyzed that it was negative correlation in case of wind velocity and amount of light. But, in case of wind velocity, it was considered that the further complement research is required as the sampling distribution was shown as so biased by the windproof effect of the trees planted at the outskirts of green space in case of wind velocity. Based on th analyzed results as above, it suggested the model of generating anion by implementing multiple regression analysis such as y = -2462.383 + 0.304x1 x 72.746x2 x 7.315x3 x - 0.138x4 (x1; time, x2; air temperature, x3; relative humidity, x4; luminous intensity, R2; 0.691).
Ⅰ Introduction
Rapid industrialization and economic growth in Korea in the 1960s and 1970s have destroyed the ecosystem and forest in Korea. In addition, the process of urbanization accelerated by increasing urban population in big cities in modern society has resulted in various problems such as changes in the climate of cities and the broken water system. In particular, a series of serious environmental problems has emerged in urban areas such as desertification caused by the increasing amount of impermeable land cover, increasing emissions of pollutants due to the rising number of vehicles and the increasing amount of energy consumption, and the decreasing amount of wind caused by high-density and high-rise buildings. Human beings are also exposed to the risk of various physical and mental diseases in urban environments densely populated with artificial structures. These environmental problems are not just problems that Korea is facing only, but the world has paid more attention to the problems in urban areas. Recently, the importance of green spaces for big cities is growing in addressing these environmental problems, securing pleasant urban environments and reducing various environmental risks (Kim et al., 2015).
Green spaces in urban areas play a role not only in reducing the stress of people living in urban areas (Mitchell and Popham, 2008), but also in lowering urban temperatures, absorbing carbon dioxide, controlling humidity through evaporation, and improving urban environments by providing shades (Kim et al., 2011). The importance of green spaces is also emphasized from a perspective of health promotion in urban areas. Green spaces generate substances that have a positive impact on human bodies such as phytoncide and negative air ions, and have a significant impact on the health of urban dwellers and pleasantness in cities. In particular, studies have been continuously conducted on negative air ions since the 1960s, and proved the air cleaning effect of its electrical property and the positive effect of boosting human metabolism (Ji, 2003; Ji 2005; Nam, 2013; Park et al., 2014).
Earlier studies on negative air ions can be divided into three groups. The first group includes those on the generation of negative air ions in green spaces and they targeted outdoor spaces and examined the correlation of the concentration of negative air ions with land cover, green space types, biotope types and meteorological elements (Kim et al., 2012; Nam, 2013; Kim et al., 2014; Kim et al., 2015). Studies in the second group are on the generation mechanism of negative air ions by plants, and measured and analyzed changes in the concentration of negative ions in the air and the decreased amount of particulate pollutants caused by the physiological functions of plants including the amount of transpiration and photosynthesis (Park et al., 1998; Lee, 2003; Lee, 2004). Lastly, the third group includes studies on the effect of negative air ions generated in green spaces on human bodies, and they identified the direct effect of green spaces or negative ion generators on human beings (Lee, 2012). Those on the generation of negative air ions in green spaces, targeting outdoor spaces, analyzed various factors and their correlations with the concentration of negative air ions, but the results of the studies differ depending on researchers, which makes it more difficult to identify the actual correlation of negative ions with the factors. Against this backdrop, this study aimed to measure and analyze changes in the environment of green spaces over time and changes in the amount of negative air ions that have a positive impact on the health of human beings and are generated in green spaces, and to review earlier studies that show different results on the generation of negative air ions in outdoor environments depending on researchers.
Ⅱ Methods
1 Scope
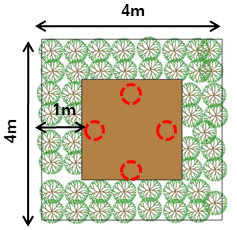
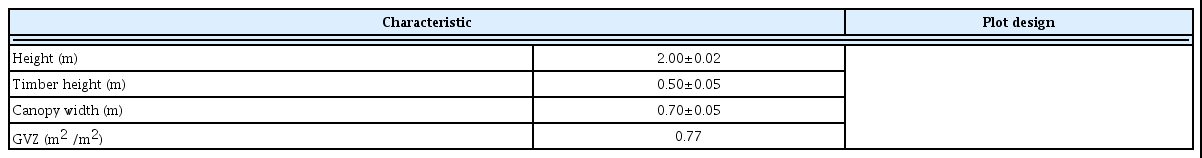
This study was conducted in a laboratory of the Department of Green Technology Convergence on the Global Campus of Konkuk University located in Chungju in North Chungcheong Province, for a month in July in 2015. Earlier studies on negative air ions generated by the photosynthesis of plants and their correlations with meteorological elements were reviewed, and data collected on clear days were extracted―approximately 300 per day, and 4200 in total―and utilized in analysis. To analyze green spaces, the targets of this study, a miniature plot was created to microscopically observe changes in meteorological elements and the amount of negative air ions generated in green spaces in large-scale parks over the course of the day. Zelkova trees were planted intensively on the outskirts of the plot (height: 2.00±0.02 m, timber height: 0.50 ±0.05 m, canopy width: 0.70±0.05 m), and their GVZ (Grüvolumenzahl) was 0.77 m 3 /m 2 (Table 1).
Open space characteristic.
2 Research and analysis methods
Negative air ions were measured using a negative air ion detector (Com-3600pro, Nico, Japan), and the detector was installed at 1.5m above the ground using a tripod to minimize the impact of the electric field on earth during measurement (Jin, 2005). Considering the fact that the highest amount of negative air ions is generated at around 13:00 (Kim et al., 2015), they were measured for 5 hours in real time from 10:31 to 15:31. The amount was measured every 4 seconds―4500 times per day―and the data were automatically recorded in a computer. Mean values were calculated at the interval of one second and 300 data on the amount of negative air ions generated were obtained and utilized to compare with meteorological elements of which values were measured later. The measured data were divided into 5 time periods as follows: 11:00 (10:31~11:30), 12:00 (11:31~12:30), 13:00 (12:31~ 13:30), 14:00 (13:31~14:30), and 15:00 (14:31~15:30). Since the generation of negative air ions is significantly affected by meteorological elements (Lee, 2012; Kim et al., 2012; Shin et al., 2012; Yoon et al., 2012), meteorological elements including temperature, relative humidity, wind speed and light intensity were also measured using an automatic weather station (AWS) at the interval of one minute together with negative air ions, and the measured data were utilized in analysis.
PASW Statistics 18 was used to analyze the measured data, and descriptive statistics were performed to analyze the basic statistics of key items. A repeated measures ANOVA and Duncan’s Multiple Range Test (DUNCAN), as a post-hoc test, were performed to verify changes in the amount of negative air ions generated in green spaces over the course of the day, and changes in the amount caused by meteorological elements. In addition, a correlation analysis was performed to identify the impact of meteorological elements on the generated amount of negative air ions, and a partial correlation analysis was conducted to analyze their impact on the generated amount of negative air ions when the mutual influence between meteorological elements was excluded. Based on the analyzed results, a multiple regression analysis was conducted to suggest a negative ion generation model depending on daily changes in meteorological elements in green spaces.
Ⅲ Results and Discussion
1 Daily average amount of negative air ions
1) Descriptive statistics of key variables
It is known that multiple variables affect the generation of negative air ions, and among them meteorological elements are known to have the most significant impact on the generation of negative air ions. To identify their relations with the generation of negative air ions, including air temperature, relative humidity, wind speed and light intensity, were measured, and the results are as shown in Table 2.

Descriptive statistics of variables (N=4200).
The average air temperature during the period of measurement was 35.4°C, and its standard deviation was 1.12561, which shows no significant difference in the average outdoor temperature in summer in Korea (Yoon, 2004). Its skewness and kurtosis were -0.085 and -1.116 respectively, and each was lower than the absolute value of skewness (3), and kurtosis (10), which met the assumption of normality (Bea, 2012). The average relative humidity during the period was 58%, and its standard deviation was 4.91683, and its skewness and kurtosis were 0.167 and -0.400 respectively, which, like air temperature, also met the assumption of normality. The average wind speed was measured to be 0.15 m/s, indicating that the wind hardly blew during the period. Its standard deviation was 0.15, and its skewness and kurtosis were 1.503 and 1.729 respectively. The average intensity of light was 115.70, and its standard deviation was very high (121.71856). Its skewness and kurtosis were 4.180 and 17.409 respectively, and each was higher than the absolute value of skewness (3), and kurtosis (10). This indicates that the distribution of data was concentrated in the average value, and that the values were not consistent but fluctuating. The results can be attributable to rapid changes in the intensity of light, compared to the values of air temperature and relative humidity, due to changes in cloud cover and the meridian altitude of the sun, and the solar shading caused by planted trees. However, it seems to be possible to assume normality with the distribution of light intensity based on the central limit theorem (CLT) since the number of samples was over 30 (Bea, 2012). The average amount of negative air ions was 941No./cm 3 , and its standard deviation was 92.75965. Its skewness and kurtosis were analyzed to be -1.026 and 3.416 respectively, which met the assumption of normality. The average generated amount was approximately 240No./cm 3 , higher, on average, than the average amount of negative air ions distributed in downtown areas, 500No./cm 3 (Jo, 2010).
The general characteristics of each variable are as follows. The values of meteorological elements except light intensity and the generated amount of negative air ions were lower than the absolute value of skewness and kurtosis (10), which met normality. The value of light intensity was higher than the absolute value of kurtosis (10) and its data were concentrated in certain parts. However, since its normality can be assumed based on the central limit theorem (CLT), it was found that a parametric statistics analysis should be applied.
2) Changes in the amount of negative air ions over time
There are several earlier studies that measured changes in the generated amount of negative air ions depending on land cover types and changes in meteorological elements, but there are relatively few studies that compared and analyzed the amount of negative air ions generated over the course of the day. In a study on the generated amount of negative air ions in different forest climates (Shin et al., 2012), changes in the amount over time were analyzed, but it focused on changes in meteorological elements only. Thus, the study analyzed certain areas only. Some studies measured such data at multiple locations (Kim et al., 2012; Yoon et al., 2012; Kim et al., 2014), but they did not consider changes in the measured values of negative air ions over time, which also makes the reliability of the results limited. In this regard, this study repeatedly measured the amount of negative air ions generated in summer daily, divided the data into several time periods and analyzed them on a hourly basis.
The analysis results show that the amount of negative air ions measured at 13:00 was highest (910No./cm 3 ), followed by those measured at 14:00 (907No./cm 3 ), at 12:00 (884No./cm 3 ), at 15:00 (861No./cm 3 ), and at 11:00 (727No./cm 3 ) (Table 3). The generated amount continued to increase in the morning, but started to decline from 13:00. To statistically verify changes in the amount of negative air ions generated hourly, a repeatedmeasures ANOVA was conducted (Table 4).

Negative air ion by hourly change (N=4200).
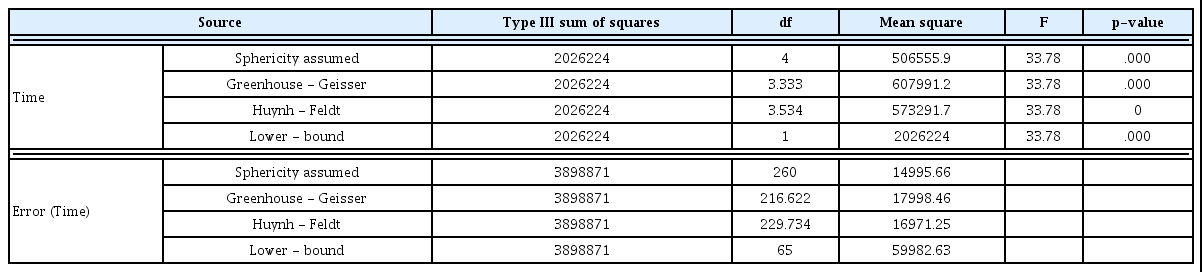
Repeated-measures ANOVA of negative air ion by hourly change (N=4200).
The Mauchly’s W value for the verification of the sphericity condition was 0.634, and the value of approximate chi-square was 28.686. The significance probability was 0.001. Thus, the null hypothesis that “the sphericity of the measured value of negative air ions can be assumed” was rejected, and the alternative hypothesis that “the sphericity of the measured value of negative air ion cannot be assumed” was accepted. Since it is unable to interpret the results of the repeated-measures ANOVA under the assumption of sphericity, Greenhouse- Geisser and Huynh-Feldt corrections were performed. The F-value of the Greenhouse-Geisser correction was 33.780, which was higher than the critical value for the rejection of the null hypothesis, and its significance probability was lower than 0.001. In addition, the F-value of the Huynh-Feldt correction was also 33.780, which was higher than the critical value for the rejection of the null hypothesis, and its significance pro bability was lower than 0.001. Based on these results, the null hypothesis that “there is no difference in the amount of negative air ions generated at different time periods” was rejected, and the alternative hypothesis that “there are differences in the amount of negative air ions generated at different time periods” was accepted.
In turn, Duncan’s Multiple Range Test (DUNCAN), as a post-hoc test, was conducted to correct the probability of Type I error, and differences in the amount of negative air ions generated at different time periods were analyzed statistically (Table 3). The results of the DUNCAN test indicated that the difference between the amounts measured at 13:00 and 14:00 was not statistically significant, but there was a statistically significant difference in the amount measured at 12:00. In addition, the amounts measured at 15:00 and 11:00 also showed statistically significant differences from those measured at other time periods. The results of the DUNCAN test can be summarized as follows: 13:00 = 14:00 >12:00 > 15:00 > 11:00. That is, since the generated amount of negative air ions is highest between 13:00 and 14:00 when the intensity of light and air temperature are highest, it was found to be necessary to consider time periods in measuring the amount of negative air ions in outdoor environments in follow-up studies.
2 Amount of negative air ions depending on changes in meteorological elements
1) Air temperature
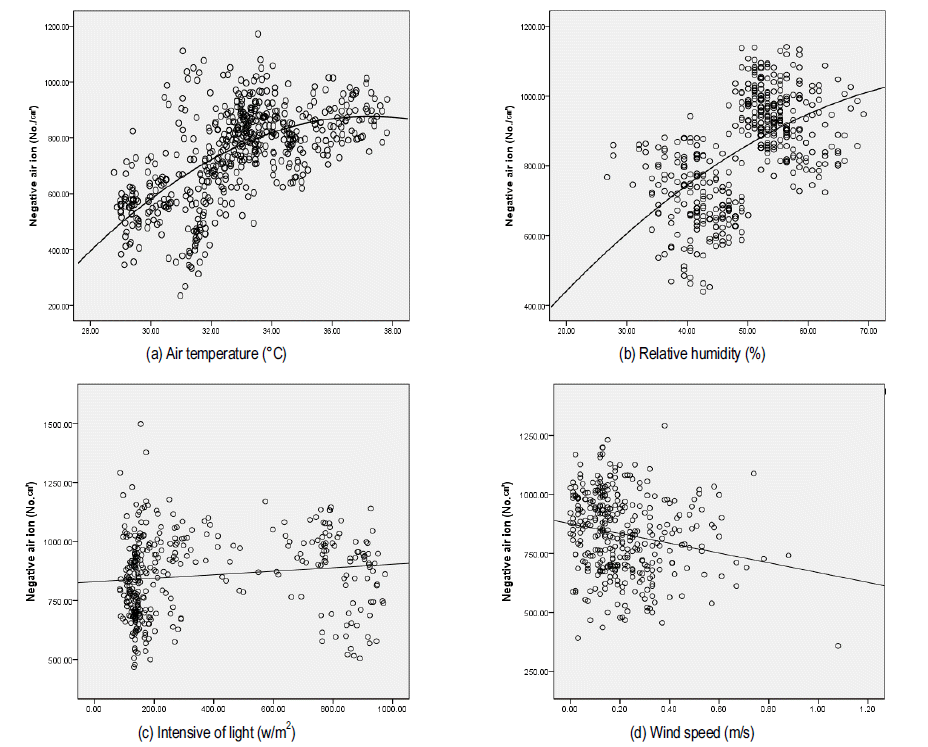
Air temperature and the generated amount of negative air ions were measured during the period of this study and compared. As shown in Fig. 1a, air temperature measured during the period ranged from 28 to 38°C, and the generated amount of negative air ions was between 400 and 1200No./cm 3 . Changes in mean values also indicated that the higher the air temperature, the more negative air ions were generated. This trend was consistent with the findings of earlier studies (Shin et al., 2012) that found that air temperature and the generated amount of negative air ions have a positive correlation, which is attributable to the fact that air temperature is, physically, a property that shows a thermal equilibrium state, and, microscopically, a factor that determines the average energy of the very small internal motion of constituent particles (Shin et al., 2012). In other words, high air temperature increases the activity of various constituent particles contained in the air. Considering the characteristics of the generation mechanism of negative air ions, which requires the electrical decomposition of constituent particles of the air (Rural Development Administration, 2008), the increased activity of constituent particles of the air seems to have a positive impact on the generation of negative air ions. There was a trend that shows the higher the air temperature, the more negative air ions are generated, but it was also found that when air temperature is over 36°C, the increase rate of the generated amount of negative air ions was reduced. This indicates that excessively high temperature acts as a deterrent to the generation of negative air ions.
Negative air ion change by difference by climate.
Various factors play a role in generating negative air ions (Jin, 2005), and, among them, the photosynthesis and transpiration of plants have a big impact on it (Park et al., 1998; Lee, 2004). The results of this study show that when air temperature is over 36°C, the increase rate of the generated amount of negative air ions is significantly reduced, which is attributable to the following mechanism. The higher the temperature, the higher the photosynthesis rate of plants in green spaces. However, at the same time, plants’ breathing volume also increases exponentially, which sharply decreases net photosynthesis. Earlier studies found that tropical plants have the maximum photosynthesis rate at 30~35°C, and that, in the case of Pinus Cembra in Europe, its gross photosynthesis continues to increase until the temperature reaches 30°C. However, its net photosynthesis reaches the maximum at 13°C since its breathing volume starts to increase sharply from 13°C (Lee, 2011). As these cases show, it seems that excessively high temperature decreases the net photosynthesis of plants, and thus drastically reduces the generated amount of negative air ions. It was also reported that transpiration caused by the photosynthesis of plants affects the generation of negative air ions (Park et al., 1998; Lee, 2004), and that when air temperature reaches over 35°C, plants excessively transpire, which increases the water stress and breathing activity of plants. This, in turn, increases CO2 levels within leaves, closes stomata that enables the transpiration of leaves (Lee, 2011), and thus sharply reduces the increase rate of the generated amount of negative air ions. Therefore, it will be necessary to conduct additional studies on this.
2) Relative humidity
The graph of changes in the generated amount of negative air ions depending on relative humidity shows that the amount of negative air ions also increases proportionally to relative humidity. During the period of measurement in this study, relative humidity ranged between 38 and 70%, and the generated amount of negative air ions, between 400 and 1200No./cm 3 . Its graph shows a trend that when relative humidity is over 50%, the generated amount of negative air ions sharply increases.
An earlier study on the generated amount of negative air ions in different forest climates (Shin et al., 2012) reported that the generated amount of negative air ions is inversely proportional to relative humidity, and another study on the generation of negative air ions by biotope types in urban areas (Kim et al., 2012) found that negative air ions are proportional to relative humidity, showing different results from other studies. The results of this study supported those of Kim et al. (2012).
Constituent particles in the air are decomposed due to various factors and release electrons. The released electrons are combined with oxygen or water vapor and they are in the negative state, which generates negative air ions (Jin, 2005). That is, when the concentrations of oxygen and water vapor in the air are high, electrons generated by various reasons are more likely to be combined with oxygen or water molecules, and thus high relative humidity seems to generate more negative air ions. In addition, photosynthesis that affects the generation of negative air ions increases when relative humidity increases within the range between 40 and 90%. It is because low humidity increases the spreading resistance of CO2 in the stomata and the photosynthesis rate reaches the level when the concentration of CO2 is low (Shin et al., 2012). Considering this, the optimal level of humidity seems to be an additional factor that increases photosynthesis and the generation of negative air ions. In this study also, the generated amount of negative air ions sharply increased when relative humidity was over 50%, but there was no significant change until it reached 70%. These results were consistent with those of a study on the generated amount of negative air ions in different climates (Shin et al., 2012).
3) Intensity of light
To measure changes in the generated amount of negative air ions depending on the intensity of light, and to control changes in the intensity of light in different types of outdoor green spaces, this study compared changes in the generated amount of negative air ions depending on the intensity of light at the areas where shades are not created in outdoor green spaces by changing meridian altitudes. The intensity of light measured in this study ranged between 0 and 1000 W/m 2 , and the generated amount of negative air ions between 500 and 1500No./cm 3 . In the graph of the intensity of light, more negative air ions were generated at a lower intensity of light, but there was no significant difference in the mean values of the generated amount of negative air ions due to the gradual slope of the graph.
An earlier study on the factors that affect the generation of negative air ions by plants (Park et al., 1998) measured changes in the amount of negative air ions generated by Populus sieboldii in a simulator room at different intensities of light for 15 weeks, and it was found that more negative air ions were generated at a higher intensity of light. It was attributed to transpiration caused by the photosynthesis of plants at a high intensity of light, and the consequently increased relative humidity. In this study, however, there was no significant difference in the amount at different intensities of light, which is attributable to the fact that plants, although different depending on species of plants, reach a light saturation point where photosynthesis no longer increases after the intensity of light reaches a light compensation point (Lee, 2011). In other words, the reason why there was no significant change in the generated amount of negative air ions after reaching a certain point is that the photosynthesis of a plant reaches its light compensation point, and thus that photosynthesis and transpiration no longer increase significantly. To verify the hypothesis, however, it is necessary to measure and compare additional physiological functions of plants, in particular, the amount of photosynthesis.
4) Wind speed
The generated amount of negative air ions depending on changes in the wind speed was also measured, and the wind speed during the period was mostly lower than 1 m/s. It was found that the higher the wind speed, the less amount of negative air ions were generated.
Since negative air ions are not electrically stable, their lifespan from generation to disappearance is very short (Jin, 2005). Wu et al. (2006) reported that the maximum diffusion length of negative air ions generated by a negative ion generator in an indoor environment was only about 5 m, and this case shows that high wind speed in outdoor environments diffuse and transfer negative ions generated in the air, and that negative ions in an electrically unstable state in the air are combined with various matters and become electrically neutral in the air.
3 Correlation between the generated amount of negative air ions and meteorological elements
A correlation analysis was conducted to identify factors that affect the generation of negative air ions. Correlation analysis is a basic method widely used to analyze the linearity of variables, and with the method relations between variables can be understood most intuitively. In reality, however, it is impossible to completely explain one outcome with one factor like correlation analysis. In addition, it is also difficult to assume that variables between which correlation was verified by correlation analysis are completely independent from each other. Thus, without considering confounding variables, it is meaningless to suggest multiple simple regression equations by simply pairing the generated amount of negative air ions with meteorological elements. In this regard, this study examined whether meteorological elements affect the generation of negative air ions through correlation analysis, analyzed the actual impact of individual meteorological elements by controlling the impact of confounding variables, and conducted a multiple regression analysis to predict the generated amount of negative air ions as precisely as possible.
1) Correlation analysis
Table 5 shows the results of correlation analysis between the generated amount of negative air ions and meteorological elements. The significance probability between negative air ions and air temperature was 0.533 (p<.01), having a medium positive correlation, and that between negative air ions and relative humidity was -0.181 (p<.01), having a low negative correlation. There was no significant correlation between negative air ions and wind speed, but that between negative air ions and light intensity was 0.366 (p<.01), having a medium positive correlation like air temperature. That is, it was found that air temperature, relative humidity, and light intensity have linear relations with negative air ions, which is consistent with the results of earlier studies (Shin et al., 2012; Kim et al., 2014). A close look at the studies, however, reveals different results by researchers. In this study, the generated amount of negative air ions increased at high air temperatures, low relative humidities and high light intensities. Compared with the results of earlier studies, a study on factors that affect the generation of negative air ions in different forest climates (Shin et al., 2012) found that negative air ions have a positive correlation with air temperature, and a negative correlation with relative humidity, which is consistent with the results of this study. On the contrary, other studies on the generated amount of negative air ions by land cover types in urban areas (Kim et al., 2012; Yoon et al., 2012) reported that negative air ions have a negative correlation with air temperature, and a positive correlation with relative humidity. Um and Kim (2010) also reported that negative air ions did not have a positive correlation both with air temperature and relative humidity in their study on the correlation between negative air ions and factors related to forest floors and forests in national forest areas. The results of these studies were inconsistent with those of this study, and they showed different results depending on researchers.

Correlations by climates and negative air ion (N=4200).
The differences between the results of earlier studies and this study can be explained as a combination of two reasons. First, different methods were used such as collecting data at one location repeatedly, and comparing data collected at multiple locations. Second, different characteristics of variables resulted in different results. In terms of the methodologies, Shin et al. (2012) measured peak values consecutively at one location, and in this case, meteorological elements change at the location as the meridian altitude of the sun rises over time. This increases the air temperature of the location, which in turn decreases relative humidity. However, considering that the generation of negative air ions is affected by the ultraviolet radiation of the sun, and the photosynthesis of plants, the higher the amount of solar radiation, the higher the activity of molecules in the air, and also the more photosynthesis and transpiration occurs, which increases the generated amount of negative air ions. For these reasons, the generation of negative air ions seems to have a positive correlation with air temperature and a negative correlation with relative humidity. On the contrary, like earlier studies that collected data at multiple locations (Kim et al., 2012; Yoon et al., 2012; Nam, 2013; Kim et al., 2014), if the duration of measurement can be controlled when measuring data at multiple locations, conditions for the generation of negative air ions can differ even under the same meteorological conditions depending on the characteristics of locations.
This can be supported by a study on the generation of negative air ions in summer depending on the locations of trees (Seo, 2015) similar to the study of Shin et al. (2012) that measured peak values. The study reported that negative air ions have a positive correlation with air temperature, and a negative correlation with relative humidity, which is consistent with the results of this study. In addition, similar to the studies of Kim et al. (2012) and Yoon et al. (2012) that measured data at multiple locations, a study on the distribution of negative air ions in valley areas (Kim et al., 2014) found that negative air ions have a positive correlation with relative humidity. As these studies show, those conducted with similar methodologies showed similar results.
In terms of different characteristics of variables, relative humidity can be recognized simply as a separate factor from air temperature, but, in fact, it is a dependent variable to air temperature since relative humidity is the amount of water vapor present in the air expressed as a percentage of the amount needed for saturation at the same temperature. Here, air temperature affects the generation of negative air ions, and also changes in relative humidity. In addition, relative humidity affects the generation of negative air ions. In other words, air temperature, relative humidity and the generated amount of negative air ions are all overlapping to some extent (Fig. 2). Such characteristics of variables cause collinearity and make it difficult to clearly identify the correlation between negative air ions and meteorological elements. This seems to cause differences between the results of this study, and also between those of earlier studies. Kim et al. (2012) and Yoon et al. (2012) also pointed out the collinearity caused by the correlation between air temperature and relative humidity. The graph of relative humidity and the generated amount of negative air ions measured in this study (Fig. 1b) also shows a proportional relationship between them, but the results of correlation analysis differ from the graph, which raises the strong possibility of the existence of collinearity. Against this backdrop, it was found to be necessary to perform a partial correlation analysis to assess the pure correlation between the two variables by controlling one of several variables and assuming it has the same value.

Correlation and partial correlation of negative air ion and weather factors.
2) Partial correlation analysis
As explained above, both air temperature and relative humidity have a correlation with negative air ions, but since there is also a correlation between air temperature and relative humidity, it was difficult to precisely analyze the actual impact of the two variables on negative air ions.
Partial correlation analysis is to assess the pure correlation between two variables by controlling one of several variables and assuming it has the same value. In this study, a partial correlation analysis was performed to identify the actual impact of air temperature and relative humidity on the generation of negative air ions.
To analyze the impact of air temperature on the generated amount of negative air ions with relative humidity controlled, relative humidity was set as a control variable, and the correlation between air temperature and negative air ions was identified as shown in Table 6. The partial correlation coefficient of air temperature after excluding relative humidity was 0.518 down by approximately 0.015 from the coefficient of air temperature calculated when relative humidity had an impact (0.533), and it is a statistically significant difference having a positive correlation.

Partial correlations of control variables on relative humidity (N=4200).
To analyze the impact of relative humidity on the generated amount of negative air ions with air temperature controlled, air temperature was set as a control variable, and the correlation between relative humidity and negative air ions was identified as shown in Table 7. The partial correlation coefficient of relative humidity after controlling air temperature was 0.108 (p<.01), having a very low positive correlation. Compared to the results of correlation analysis before controlling air temperature, they both had a very low correlation. However, relative humidity and negative air ions showed a negative correlation in correlation analysis, but they showed a positive correlation in partial correlation analysis. This result is consistent with the results of earlier studies that measured data at multiple locations (Kim et al., 2012; Yoon et al., 2012).

Partial correlations of control variables on air temperature (N=4200).
As changes in the analyzed results discussed above show, the correlation coefficient of relative humidity changed significantly when air temperature was controlled, but that of air temperature did not change significantly when relative humidity was controlled. This indicates that air temperature is an independent variable to relative humidity. In other words, relative humidity, as mentioned above, is the amount of water vapor pressure present in the air divided by the amount of saturated water vapor pressure, and this supports the hypothesis that relative humidity is a dependent variable to the current air temperature.
This means that relative humidity is determined by the current temperature of the air, and when air temperature is different, even if relative humidity is the same, the amount of water vapor present in the air is markedly different. For this reason, earlier studies seem to show inconsistent results, and simply by looking at the graph of relative humidity and negative air ions (Fig. 1b), it is possible to find out that an increase in relative humidity resulted in a rise in the generated amount of negative air ions.
Water vapor in the air is in the form of negative ions due to electrically charged electrons (Rural Development Administration, 2008). This means that the large amount of water vapor present in the air increases the possibility that electrons generated by various factors are combined with water molecules, and thus when the relative humidity is high, more negative air ions can be generated. Based on these results, it is found to be necessary to utilize the saturated water vapor pressure of the current air regardless of temperature, that is, absolute humidity, in identifying the correlation between negative air ions generated in outdoor environments and meteorological elements, instead of the saturated water vapor pressure of the air at a certain temperature, that is, relative humidity.
3) Correlation analysis using absolute humidity
Considering the results discussed above collectively, it is difficult to find a clear causal relationship in correlation analysis between negative air ions and meteorological elements by utilizing relative humidity due to collinearity between air temperature and relative humidity. As mentioned above, relative humidity is the amount of water vapor present in the air expressed as a percentage of the amount needed for saturation at the same temperature, and having the same relative humidity does not mean that the amount of water vapor is also the same at different temperatures. Therefore, relative humidity was converted into absolute humidity, the current amount of water vapor present in the air, to utilize in analysis (Table 8).

Correlations by climates with absolute humidity and negative air ion (N=4200).
The correlation coefficient between negative air ions and relative humidity was -0.181, the same as that of the correlation analysis performed above, which was statistically significant. However, there was a significant change in the correlation coefficient between negative air ions and absolute humidity, showing a positive correlation (0.151). Its significance probability was lower than 0.01, which was statistically significant. There was no significant change in the correlation coefficients of wind speed and light intensity with negative air ions from the correlation analysis performed above, which also demonstrates that converting relative humidity into absolute humidity does not have a big impact on other variables.
In summary, converting relative humidity into absolute humidity does not have a big impact on correlations between other variables, but significantly affects the generated amount of negative air ions. It was confirmed that the correlation between air temperature and relative humidity, that is, its collinearity makes it difficult to precisely identify the impact of air temperature and relative humidity on negative air ions. It was found that the correlation between actual relative humidity and negative air ions is positive, and that the higher the amount of water vapor in the air, the more negative air ions are generated. Based on these results, it was found to be necessary to systematically discuss the utilization of absolute humidity, which is the actual pressure of water vapor present in the air, in analyzing the correlation between negative air ions and meteorological elements instead of simply using relative humidity.
4 Negative air ion generation model
Based on the results analyzed above, a multiple regression analysis was performed to establish a negative air ion generation model. The generated amount of negative air ions was set as a dependent variable, and depending on the time of measurement and the results of correlation analysis, air temperature, absolute humidity, light intensity and wind speed were set as independent variables that affect the generation of negative air ions. In this study, a stepwise method, one of the variable selection methods widely used for multiple regression models, was adapted to analyze results (Table 9).

Setting variables.
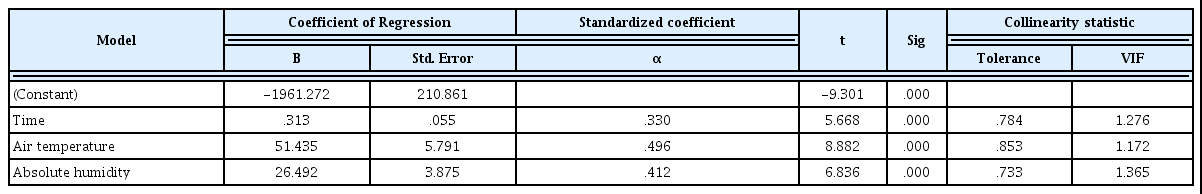
A multiple regression analysis using absolute humidity was performed, and based on the results (Table 10), it was found that light intensity and wind speed were not suitable for a multiple regression model, and thus they were removed. The time of measurement, air temperature and absolute humidity were used as final variables. The coefficient of determination was 0.697, higher than the minimum level for multiple regression analysis (0.300), which can be interpreted that about 70% of the total data can be explained with the model. The result of the Durbin-Watson statistic was 0.279, showing that the individual residuals of variables were independent without auto-correlation. The F-value was 66.873 (p<.001), and thus the regression equation suggested in this study was found to be statistically significant. The results above show that the residuals of independent variables in this multiple regression analysis were independent and that all variables did not converge into zero in tolerance in collinearity statistics. The variance inflation factor (VIF) was lower than 10 with no multicollinearity, indicating that the suggested regression model is reliable. Its explanatory power was approximately 69.7%.
multiple regression analysis.
In detail, the regression coefficient of time was 0.313, meaning that 0.313 negative air ions are generated in one minute. The result was statistically significant. That of air temperature was 51.435, meaning that 51.435 negative air ions are generated when the air temperature increases by one degree. The regression coefficient of absolute humidity was 26.492, meaning that 26.492 negative air ions are generated when the absolute humidity increases by 1%. In terms of simple regression coefficients, that of air temperature was highest (51.435), followed by relative humidity (26.492) and time (0.313), showing big differences. However, when the impact of the variables is compared only with simple regression coefficients, the results cannot be accurate since the units of variables are different, and each variable has different mean values and standard deviations (Be, 2012). Therefore, their different distributions were converted into standardized regression coefficients to compare their mutual influence, and the results were as follows: air temperature (0.496) > relative humidity (0.412) > time (0.303). Compared to their simple regression coefficients, the order was the same, but the gap between air temperature and relative humidity was not as big as those in the simple regression analysis.
In summary, it was found that air temperature has the biggest impact on the generation of negative air ions, followed by relative humidity, and time, and that there was no big difference between the impacts of air temperature and relative humidity on the generation of negative air ions. It is attributable to the different roles of the two variables. High air temperature increases the activity of constituent particles in the air, as well as the photosynthesis and transpiration of plants, while absolute humidity, that is, water vapor, combines electrons split by the increased activity. Based on the analysis results, a regression model was established as follows:
Ⅳ Conclusions
This study aimed to measure and analyze changes in the amount of negative air ions, having a positive impact on human beings, generated in green spaces depending on time periods and meteorological elements, and to review earlier studies on the generation of negative air ions that show different results depending on researchers. The findings of this study are as follows:
First, the generated amount of negative air ions differed depending on time periods, and there were differences in the amount measured during different time periods.
Second, the generated amount of negative air ions have different correlations with meteorological elements, and time periods, air temperature and relative humidity had a positive correlation, and wind speed and light intensity, a negative correlation. These results were partially consistent with the results of earlier studies on the generated amount of negative air ions in outdoor environments, and some were not consistent. The differences are attributable to different locations and characteristics of variables, which was discussed in detail above.
Third, in terms of the characteristics of variables, it was assumed that it would be difficult to precisely analyze the impact of air temperature and relative humidity on the generated amount of negative air ions due to the influence between the two independent variables, that is, collinearity, and in the correlation analysis, it was found that air temperature and relative humidity had a correlation, indicating the existence of collinearity. Thus, a partial correlation analysis was performed to exclude the influence between independent variables, and supported the hypothesis of this study.
Fourth, this collinearity is caused by the characteristics of variables, and attributable to the fact that relative humidity is a dependent variable to air temperature since relative humidity is the amount of water vapor present in the air expressed as a percentage of the amount needed for saturation at the same temperature. It was suggested to utilize absolute humidity in order to exclude this influence in follow-up studies on the generation of negative air ions in outdoor environments.
Fifth, the results of a multiple regression analysis using absolute humidity showed that air temperature has the biggest impact on the generation of negative air ions, followed by absolute humidity and time. Based on the results, a negative air ion generation model was established as follows: y = -1961.272 + 0.313x1 x 51.435x2 x 26.492x3 (y: the generated amount of negative air ions, x1: time, x2: air temperature, x3: absolute humidity).
Based on these results, it was concluded that multiple variables have an impact on the generation of negative air ions, and each has a different level of impact. However, various shapes of green spaces and ratios of green coverage were not considered in this study, and various weather conditions were not also reflected since this study was conducted under the premise that the photosynthesis of plants affects the generation of negative air ions, and thus targeted clear days when photosynthesis occurs sufficiently. In addition, other variables that can actually affect the generation of negative air ions were not considered, and thus it may not be difficult to widely utilize the negative air ion generation model suggested in this study. In this regard, it will be necessary to consider additional variables, different shapes of green spaces, and various weather conditions in order to secure the diversity and objectivity of the results of this study, and thus to generalize the findings of this study.