Estimating Net Primary Productivity under Climate Change by Application of Global Forest Model (G4M)
Article information
Abstract
Net primary productivity (NPP) is considered as an important indicator for forest ecosystem since the role of the forest is highlighted as a key sector for mitigating climate change. The objective of this research is to estimate changes on the net primary productivity of forest in South Korea under the different climate change scenarios. The G4M (Global Forest Model) was used to estimate current NPP and future NPP trends in different climate scenarios. As input data, we used detailed (1 km × 1 km) downscaled monthly precipitation and average temperature from Korea Meteorological Administration (KMA) for four RCP (Representative Concentration Pathway) scenarios (2.6/4.5/6.0/8.5). We used MODerate resolution Imaging Spectroradiometer (MODIS) NPP data for the model validation. Current NPP derived from G4M showed similar patterns with MODIS NPP data. Total NPP of forest increased in most of RCP scenarios except RCP 8.5 scenario because the average temperature increased by 5°C. In addition, the standard deviation of annual precipitation was the highest in RCP8.5 scenario. Precipitation change in wider range could cause water stress on vegetation that affects decrease of forest productivity. We calculated future NPP change in different climate change scenarios to estimate carbon sequestration in forest ecosystem. If there was no biome changes in the future NPP will be decreased up to 90%. On the other hand, if proper biome change will be conducted, future NPP will be increased 50% according to scenarios.
Ⅰ. Introduction
Net Primary Productivity (NPP) is an important indicator for forest ecosystem (Lal, 2005). As the extreme event from climate change could decrease NPP of forest, the role of the forest is emphasized. Especially rapidly urbanizing countries which have high carbon dioxide emission have large interest in calculating future forest NPP under climate change. Discussion for maximizing carbon sequestration in forest sector is happening throughout the global community (Friend, 2010).
Climate change is considered as a major threat that causes adverse impact on human in the near future. Developed countries and developing countries try to solve the confronted issues to the sustainable development. However the agreement among the international communities is still ongoing. There are some countries trying to solve this problem by applying proactive measure. South Korea is one of the countries that want to resolve climate change issue by green growth and national adaptation planning. In Korea Land Use and Land Use Change and Forestry (LULUCF) is the only sector calculating the emission and sequestration of the carbon dioxide. Total carbon sequestration in LULUCF is 50.9 million CO2eq ton in 2012. It consist 8.7% of total emission of the South Korea (Greenhouse gas Inventory and Research center of Korea, 2014).
There are a number of different studies on estimating NPP using various methodologies, such as terrestrial ecosystem modeling, remote sensing, and field surveys (Adams and Lenton, 2004). In previous research, terrestrial ecosystem modeling has been used since it can provide insights on how NPP will be changed by changes in environmental variables (Cramer et al., 1999). If an ecosystem model can provide realistic NPP estimation, it could provide scientific data for the decision making process. Therefore, the objective of this research is estimating net primary productivity under the different climate change scenarios by using the Global Forest Model (G4M) in South Korea.
Ⅱ. Method and materials
1. Study site
South Korea has been selected as the study site (Fig. 1) because 64% of its territory is covered by forest and most of the forest are located in mountainous areas (Korea Forest Service, 2013). Also the Korean government announced 1st comprehensive plan for improvement of carbon sink in 2015. Therefore possibility of the forest as a carbon sink ought to be evaluated under the different climate scenarios.
Study Site.
2. Global Forest Model (G4M)
The G4M is a geographically explicit model to assess land use change decision making (Kindermann et al., 2006). G4M calculates NPP using soil, temperature and precipitation (Kraxner et al., 2014). G4M includes decision making process, economic modules and annual increment calculation. NPP estimation module is used for calculating current and future changes of forest productivity considering changes in temperature and precipitation. This model can estimate NPP diverse forest species and adaptation to a climate signal (Fig. 2).
Flowchart of G4M (Gusti and Kindermann 2011).
3. Materials
G4M requires soil type, water holding capacity, altitude and climate data for calculation of NPP. All data sets were resampled 1 km by 1 km resolution to unify input data set for the modeling. We updated detailed data from Korean government to increase model accuracy. Climate data and Digital Elevation Map (DEM) were used to update altitude, precipitation and temperature. Korea metrological administration provides 1 km by 1 km resolution climate data set with different climate change scenarios in ASCII format. National Geographic Information Service (NGIS) provides 5 m by 5 m resolution altitude data for the South Korea. MODerate resolution Imaging Spectroradiometer (MODIS) NPP data set was retrieved from National Aeronautics and Space Administration (NASA) MODIS website.
4. Analysis framework
In this study, we analyzed current forest NPP and NPP in the future climate condition in to three steps (Fig. 3). First, climate change scenarios are analyzed for estimating how the precipitation and temperature will be changed in the future. A standard deviation and average increment were analyzed to find out the degree of the precipitation and temperature change. Secondly, input data set for the modeling were extracted by using ArcGIS 10.1. To run G4M, two kinds of data set are needed (Table 1). First data set is climate data. A climate data set should contain latitude and longitude of point, monthly temperature and precipitation. Second data set is environmental properties data set. An environmental properties set needs to contain latitude, longitude, soil type, available water content, altitude data for each point. Then G4M calculates Mean Annual Increment (MAI) by using different coefficient. NPP can be calculated with MAI because MAI is considered as one third of NPP (Gusti and Kindermann, 2011; Kindermann et al., 2013).
Flowchart of this study.
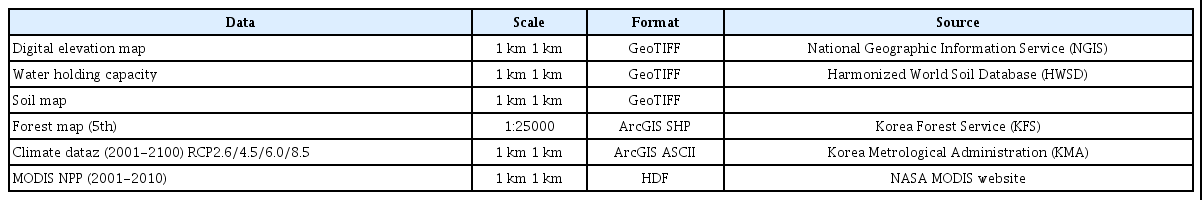
Input data set for G4M.
In this study, MODIS NPP data was used for the comparison of modeling output from 2001 to 2010. After the validation, future NPP was estimated with different RCP scenarios. We hypothesized that first scenario assume that vegetation in Korea is not changing while climate change thought 2100 (BAU case). The other scenario we assumed that the forest biome will be changed to maximize future NPP under different climate conditions (MAX case).
Ⅲ. Results and discussion
1. Climate data pattern analysis
We derived climate data trends by using zonal statistics tool in ArcGIS 10.1. In zonal statistics tool, mean annual temperature and standard deviation of South Korea for each year was calculated (Fig. 4). As a result of analysis, temperature and precipitation pattern showed different trends according to RCP scenarios. In RCP 8.5, average temperature in South Korea increases 4.5°C in 2100 while it increases only less than 1°C in RCP 2.6. According to the IPCC 5th report global mean temperature increases 2.6°C to 4.8°C in 2100 under RCP 8.5 scenario (IPCC, 2014). Standard deviation of annual average temperature was 1.95°C. And standard deviation of annual average temperature showed few differences among the RCPs.
Average temperature (left) and standard deviation (right) changes from 2011 to 2100 according to RCPs (Unit: °C).
An average of annual precipitation in 2100 showed few differences in RCPs except RCP 8.5. Precipitation increases more than 200 mm in RCP8.5 while other scenarios have almost no change in annual precipitation (Fig. 5). Also standard deviation of annual precipitation in RCP8.5 is higher than other RCPs and it showed an increasing trend. Increase of standard deviation indicated that the chance of either flood or draught would increase in 2100 under RCP8.5.
Annual precipitation (left) and standard deviation (right) changes from 2011 to 2100 according to RCPs (Unit: mm).
2. Validation of current net primary productivity with MODIS data
To validate NPP estimation from G4M, MODIS data from 2001 to 2010 was used. Temporal changes in NPP derived from G4M showed similar trends with MODIS. However, average value of NPP in G4M was lower than the result of MODIS NPP (Fig. 6). MODIS NPP trends are generally an overestimated NPP in South Korea because the vegetation information in MODIS data set is not enough to simulate carbon cycles (Shim et al., 2014). Therefore, result from G4M is suitable to estimate future NPP changes. In G4M, every point has information on the different vegetation composition that could describe the impact of vegetation in each cell better than MODIS NPP.
Comparison of average NPP per ha/year comparison between G4M and MODIS (Unit: tC・ha-1 ・year-1 ).
The spatial distribution is similar spatial distribution among the data (Fig. 7). Generally, NPP in south west part of Korea is higher than in north east part. Jeju-island showed higher NPP in all data sets. Jeju-island consist of with different vegetation compared to main land of Korea. In MODIS data set NPP showed higher in east part of Korea while the southern part of Korea showed higher NPP in G4M.
Spatial distribution of NPP from 2001 to 2010 with Z-score (Left: MODIS, Right: G4M).
3. Net primary productivity estimation by G4M
To find out the impact of climate change without proper adaptation, we set two cases. In first case we assume that future vegetation will not be changed (BAU case). The other case is that future vegetation will be changed to maximize NPP (MAX case). Vegetation will be managed to maximize the productivity to meet the mitigation goal in 1st comprehensive plan for improvement of carbon sink in 2015.
3.1. Without biome change
Average NPP per ha in all RCP scenarios was decreased. Average NPP in RCP8.5 decreased 80% while in RCP2.6 decreased 25%. Temperature and precipitation range in 2100 are not suitable with current vegetation. Increase average temperature and standard deviation decreased net primary productivity of vegetation when adaptation is not established (Fig. 8).
Average NPP per ha in BAU case (Unit: tC・ha-1 ・year-1 )
Spatial distribution of NPP has different characteristics on the RCPs. In RCP8.5 scenario most of Korean forests are considered as unsuitable areas for the wood production. Higher altitude areas are located in mountainous area. Mountainous areas have lower temperature compared to other parts of Korea. That minimize the impact of temperature increase in 2100 (Fig. 9).
Average NPP from 2091 to 2100 in BAU case (Unit: tC・ha-1 ・year-1 ) (Top left: RCP 2.6, Top right: RCP 4.5; Bottom left: RCP 6.0, Bottom right: RCP 8.5).
3.2. With vegetaion change
Average NPP per ha in all RCP scenario was increased except RCP8.5 because average temperature increase in 2100. In RCP8.5 the NPP decreases significant amount after 2070 even in the case of considering vegetation change to maximize NPP of forest ecosystem (Fig. 10).
Average NPP per ha in MAX case (Unit: tC・ha-1 ・year-1 ).
Spatial distribution of NPP in MAX case indicates higher NPP value than BAU cases. Especially with proper adaptation of forest the NPP increases in southern parts of Korea. However, even with adaptation NPP decreases in some lower altitude areas. Higher mountainous areas become suitable areas to produce wood biomass in the future (Fig. 11).
Average NPP from 2091 to 2100 in MAX case (Unit: tC・ha-1 ・year-1 ) (top left: RCP 2.6, top right: RCP 4.5; bottom left: RCP 6.0, bottom right: RCP 8.5).
4. Biome changes in different RCPs
The most of forests in Korea consisted with temperate forests in 2010s. Subtropical forest and tropical forest increase in 2090s as temperature and precipitation increase. Especially under RCP8.5 scenario 70% of forest changed into subtropical or tropical forest to maximize productivity of forest ecosystem (Fig. 12).
Species changes between from 2010s to 2090s (Unit: %).
We calculated the possibilities of species changes from 2010 to 2100. Frequent changes on forest biome happened in south coast and lower altitude at all scenarios. The possibility of species change increases as the average temperature increases from RCP2.6, RCP4.5 and RCP6.0. Frequent changes of forest biome is not realistic in real forest ecosystem. Therefore, the areas that experiencing frequent changes in biome are vulnerable to climate change (Fig. 13).
The possibilities of species change from 2011 to 2090s (top left: RCP 2.6, top right: RCP 4.5 bottom left: RCP 6.0, bottom right: RCP 8.5).
Ⅳ. Conclusion
Climate change in South Korea analyzed to show significant trend. Average temperature increases by the end of 2100 and average precipitation showed increasing trend in 2100. In RCP8.5 temperature increases about 5°C and precipitation increases 200 mm. Moreover, there were clear trends on the temperature and precipitation in the other RCPs. NPP derived from G4M showed similar trend with MODS NPP. Temperature and precipitation changes will cause significant changes in ecosystem productivity including forest ecosystem where considered as carbon sink to mitigate climate change. We found that productivity of forest in South Korea decreased in the case without proper management under climate change. In the RCP 8.5 scenario, even if we try to apply adaptation measure to reduce adverse impact of climate change, there will be reduction of NPP according to our result.
Considering productivity changes in forest, national goal for carbon stock improvement should be reconsidered. According to 1st comprehensive plan for improvement carbon sink, 10,000,000CO2eq ton will be absorbed by the forest ecosystem (Korea Forest Service, 2012). However, this assumption has not included the future climate change and species change. Therefore, there should be precise estimation considering adaptation policy on forestry sector (etc. introduction of proper species, conservation plan for the productive forest in the future and other policy related options), species change under the future climate signals and policy, and management options. Especially, forest biome will be changed because of the climate change. Thus the considerations on the biome change should be included for the policy applications. As a result of this study, vulnerable area and degree of risk was derived. Those areas should be managed for increment carbon sequestarion of forest ecosystem.