A Study on Carbon Sequestration Index as a Tool to Determine the Potential of Greenbelt
Article information

Abstract
Background and objective
Carbon is crucial in the biological world, especially in plants. It helps grow plants and stores the absorbed carbon in terms of biomass. In the biogeochemical cycle, carbon gets neutralized in the environment. The increase in population is responsible for the amplified concertation of greenhouse gas (GHG) into the atmosphere, which leads to maximized CO2 concentration, and consequences global temperatures. Trees play a critical role in the sequestration of carbon from the atmosphere. The objective of the present study is to evaluate the potential of carbon sequestration in urban roadside tree species using the Carbon Sequestration Index as a tool (CSI).
Methods
Biophysical estimations such as diameter at breast height (DBH), height, and above and below-ground biomass were measured to assess the carbon sequestration potential of a tree.
Results
Results revealed that the potential species present in large numbers are Pongamia pinnata, Azadirachta indica, and Spathodea campanulata. Based on Carbon Sequestration Index results, it is found that Pongamia pinnata and Azadirachta indica act as keystone species in this area and are better than others in removing GHG emissions. The study has also considered the requirement of a total number of trees to neutralize the whole GHG emission of the study area.
Conclusion
The total GHG emission of our study area is 39599 kg/yr, where 1041 trees are present inside the boundary, and the entire carbon sequestration is 475921.5 kg/yr. Only 86 trees are sufficient to offset the total GHG emission from this area, whereas 955 trees are surplus for this place.
Introduction
Carbon is a vital component of life found in all living beings. They are usually available in organic matter in soil and plants in the form of biomass. Carbon also exists in various compositions and arrangements (Potadar Vishnu and Satish, 2016). A rapid increase in the urban population has led to increased infrastructure investments. On the other hand, it is responsible for diameter emissions at breast height and environmental effects (Ottelin et al., 2019). The disturbances in the global carbon cycle have increased carbon dioxide concentrations and global temperature. The primary reasons are deforestation and intense anthropogenic activities, which impact natural and afforested trees (Waring et al., 2020). Prior contamination of CO2 in the atmosphere occurs through fossil fuel emissions, organic and plant decomposition, specific chemical reactions, and solid waste. Its elimination occurs through a significant biological cycle known as carbon sequestration (USEPA, 2022). Carbon sequestration is a phenomenon of removing carbon in the form of CO2 by a natural or mechanical process. Trees, carbonate minerals, oceans, and geologic formations act as carbon sinks that help moderate the effects of GHG in the environment. It is also essential to set up parks, forests, community gardens, private yards, etc., which intensify the transparency of our environment (Lahde and Di Marino, 2019; Gómez-Baggethun and Barton, 2013; Tzoulas et al., 2007).
Carbon is captured by trees and is used in photosynthesis, and excess carbon is stored as plant biomass (Nowak, D.J. and D.E. Crane. 2002). Generally, tree leaves trap CO2 through the stomatal pore in turgid conditions. When photosynthesis occurs, which includes converting CO2 and water to complex organic molecules like glucose and releasing oxygen as a subsidiary product (Johnson, 2016), the existing forests consist of old-growth. They can restore −2 GtC (Gigatons of carbon) yearly and play a vital role in terrestrial carbon sink (Pugh et al., 2019). Compared with cities and rural places, the city has a lower potential for absorbing and sequestrating carbon (Velasco et al., 2016; Nowak et al., 2013). When trees are present in an urban area, they would help improve air quality, soil fertility, groundwater recharge, curb the urban heat island effect, and reduce soil erosion and noise. The process of respiration also helps in the sequestration and storage of carbon from the atmosphere (Keeley et al., 2013; Nowak, D.J. and D.E. Crane, 2002). Adopting green infrastructure is popularized in protecting ecosystem services and biodiversity. It is considered one of the nature-based solutions in different national and international policies (Pauleit et al., 2017). A proper equilibrium between the emission and absorption of CO2 in the atmosphere is defined as carbon neutrality. This target is slightly lesser than the goal of zero carbon emission but has an equal weightage for measurement on a global scale (Chen, 2021). The growing demand for zero-emission strategies boosted large-scale plantation efforts to counteract carbon emissions (Waring et al., 2020). Carbon neutrality gained popularity in 2014 when it helped people become carbon-free through the plantation (Rollo et al., 2020).
GHG is typical for its heat-trapping nature in the atmosphere. Out of total GHG emissions, the industrial sector contributes 23%, and agricultural field and commercial activities contribute 10% and 13% of emissions, respectively. At the same time, the conveyance sector is responsible for 29% of GHG emissions and claims the 1st rank, followed by the electrical industry, 25% of all emissions (USEPA, 2019). The assessment of carbon sequestration helps mitigate climate change by maintaining GHG emissions below the carbon budget level and preserving the ecosystem services (Ottelin et al., 2019; Tzoulas et al., 2007; Gómez-Baggethun and Barton, 2013). The present study is aimed to determine the potential of individual species in minimizing GHG emissions emitted from vehicular traffic using the CSI as a tool.
Research Methods
Study area
The chosen study area for the present work is GITAM (Deemed to be University) campus, Rushikonda, Visakhapatnam. It has spread over 100 acres, located at coordinates 17.7816° N, 83.3775°E. This area is chosen because it is an institution with controlled vehicular activity. The campus is rich with diversified tree species. Data related to vehicular movement is used to calculate GHG emissions. Measuring DBH, height, and above and below-ground biomass (AGB and BGB) is considered to estimate carbon absorption capacity by the tree species. The location of the study is represented in Fig. 1. The tree species growing on either side of roads in the study area were considered. The total number of trees is 1041 and belongs to 21 species used to calculate the Carbon Sequestration Index.
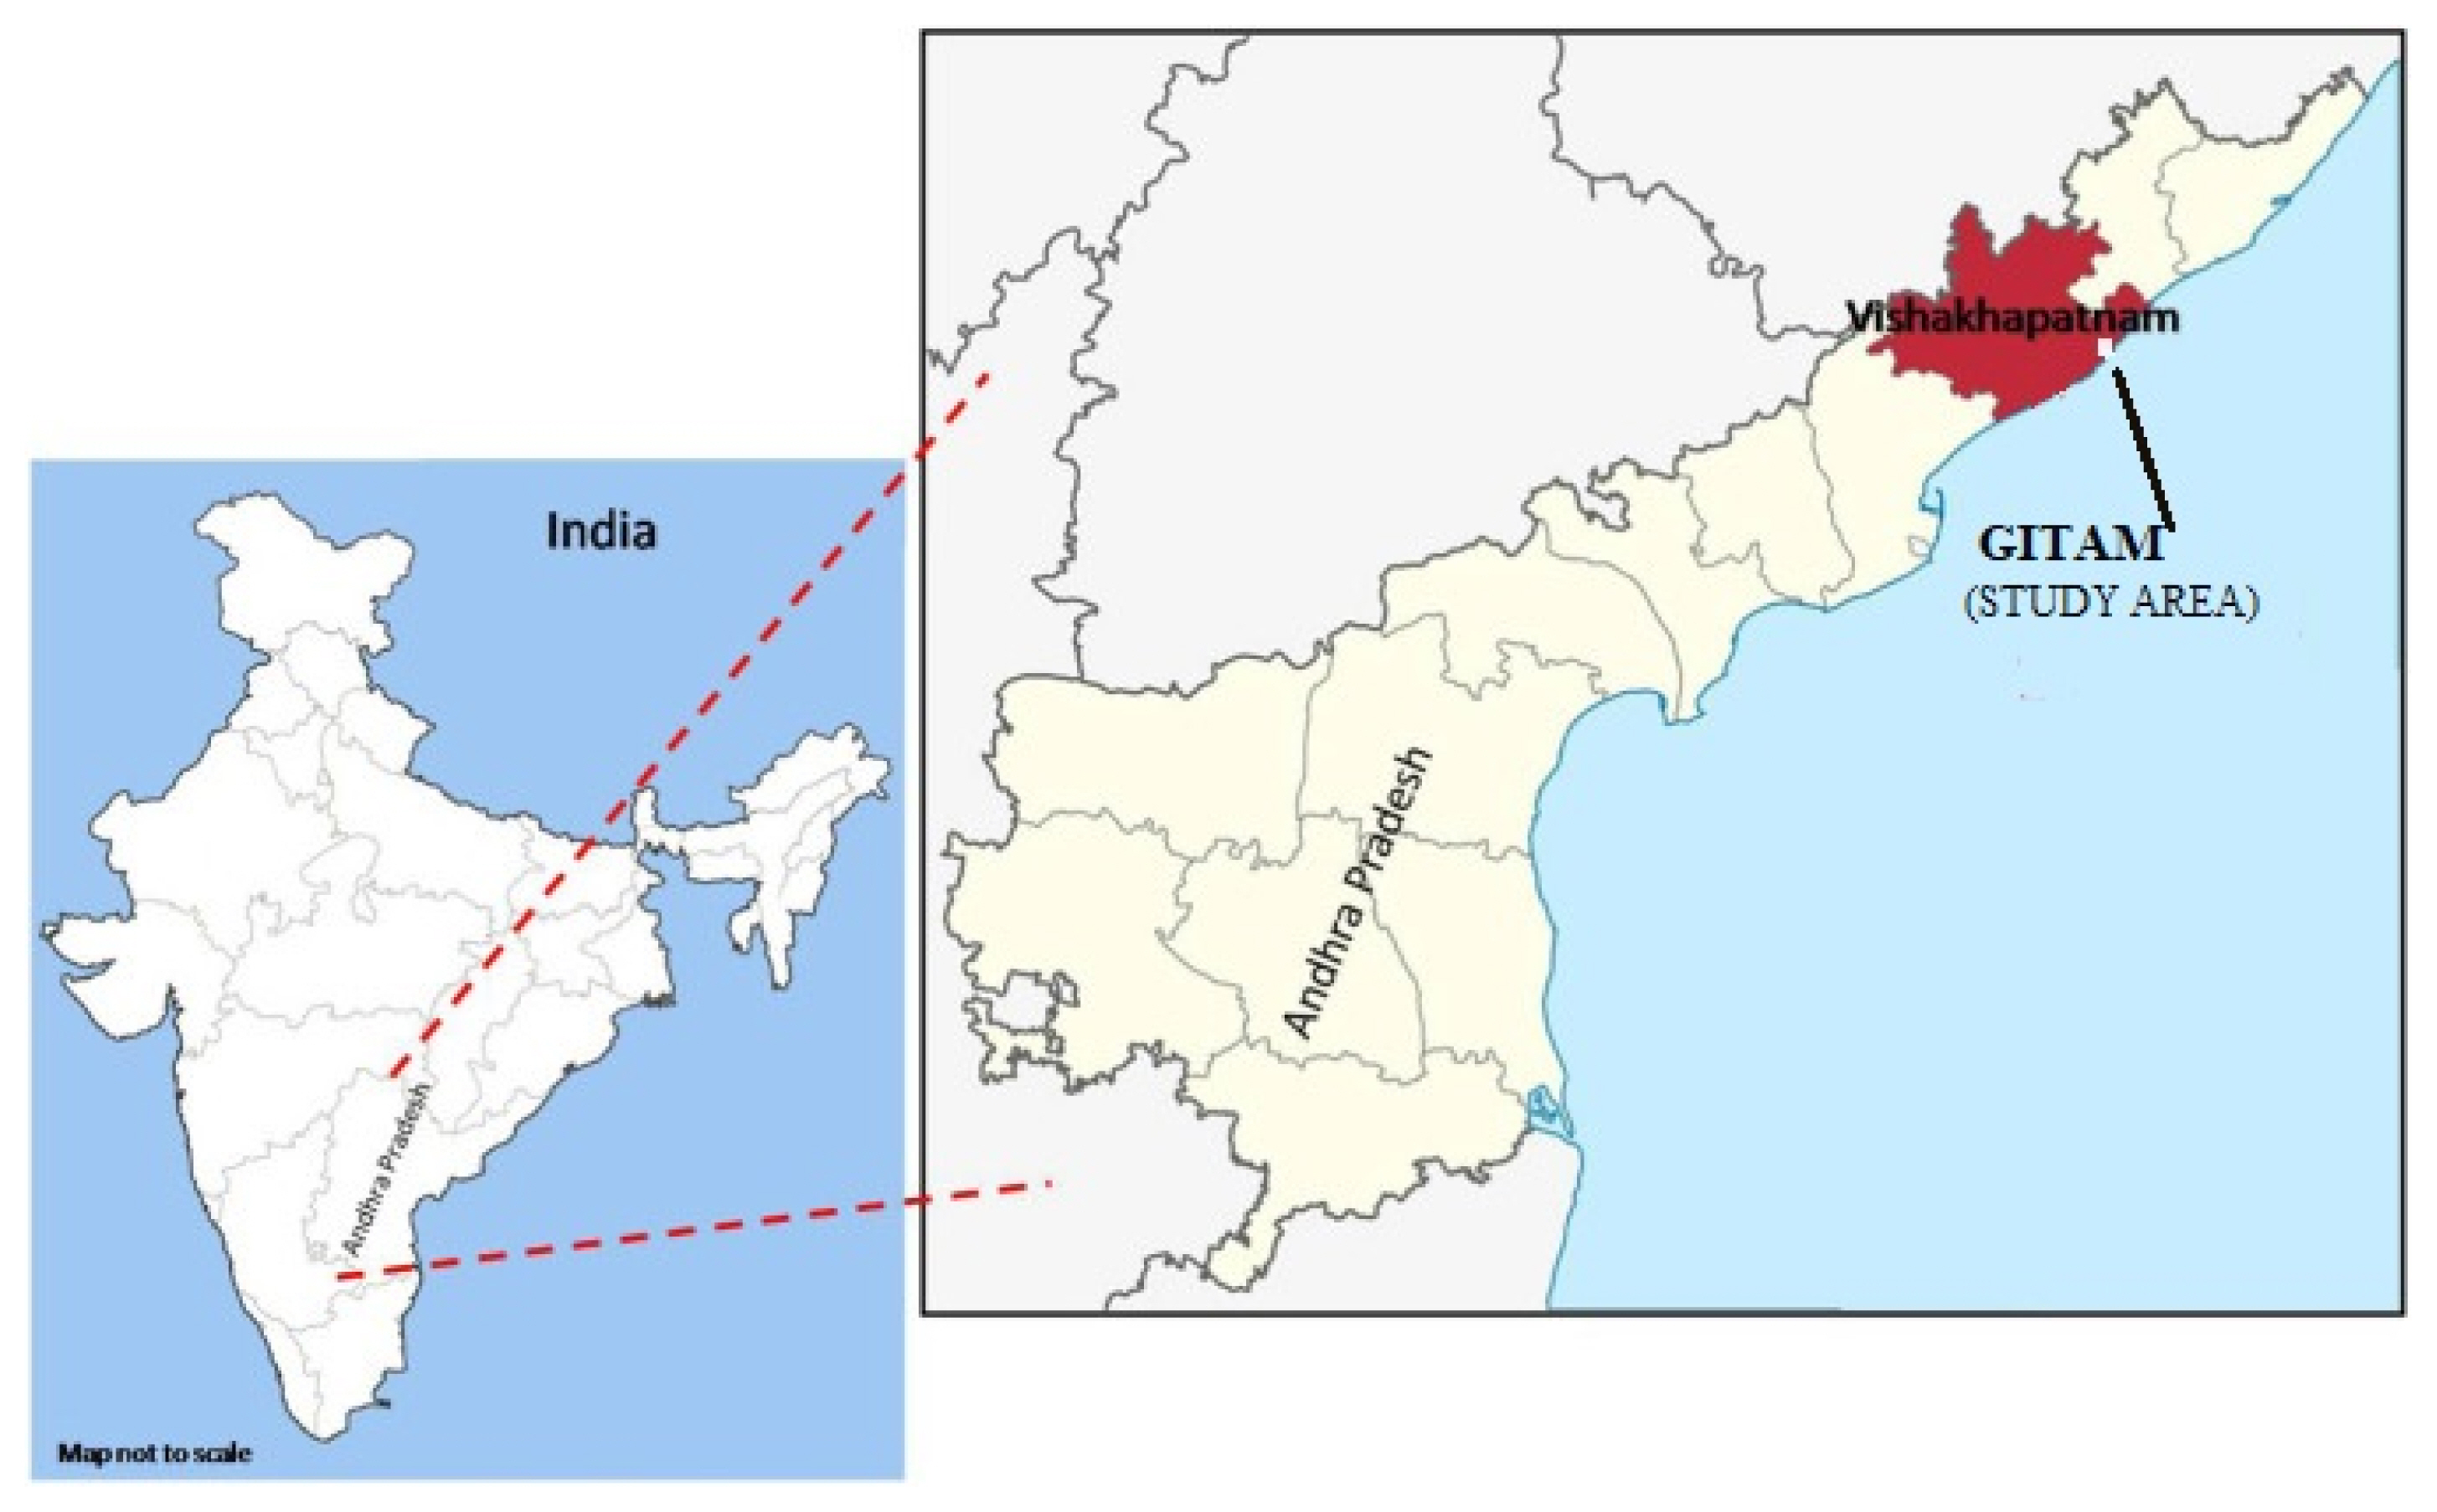
Representation of study area.
Study approach
The process of this work is based on inventory studies on Carbon neutrality grounded on a tree survey and total GHG emissions in vehicular traffic, and the schematic diagram (Fig. 2) is given below:
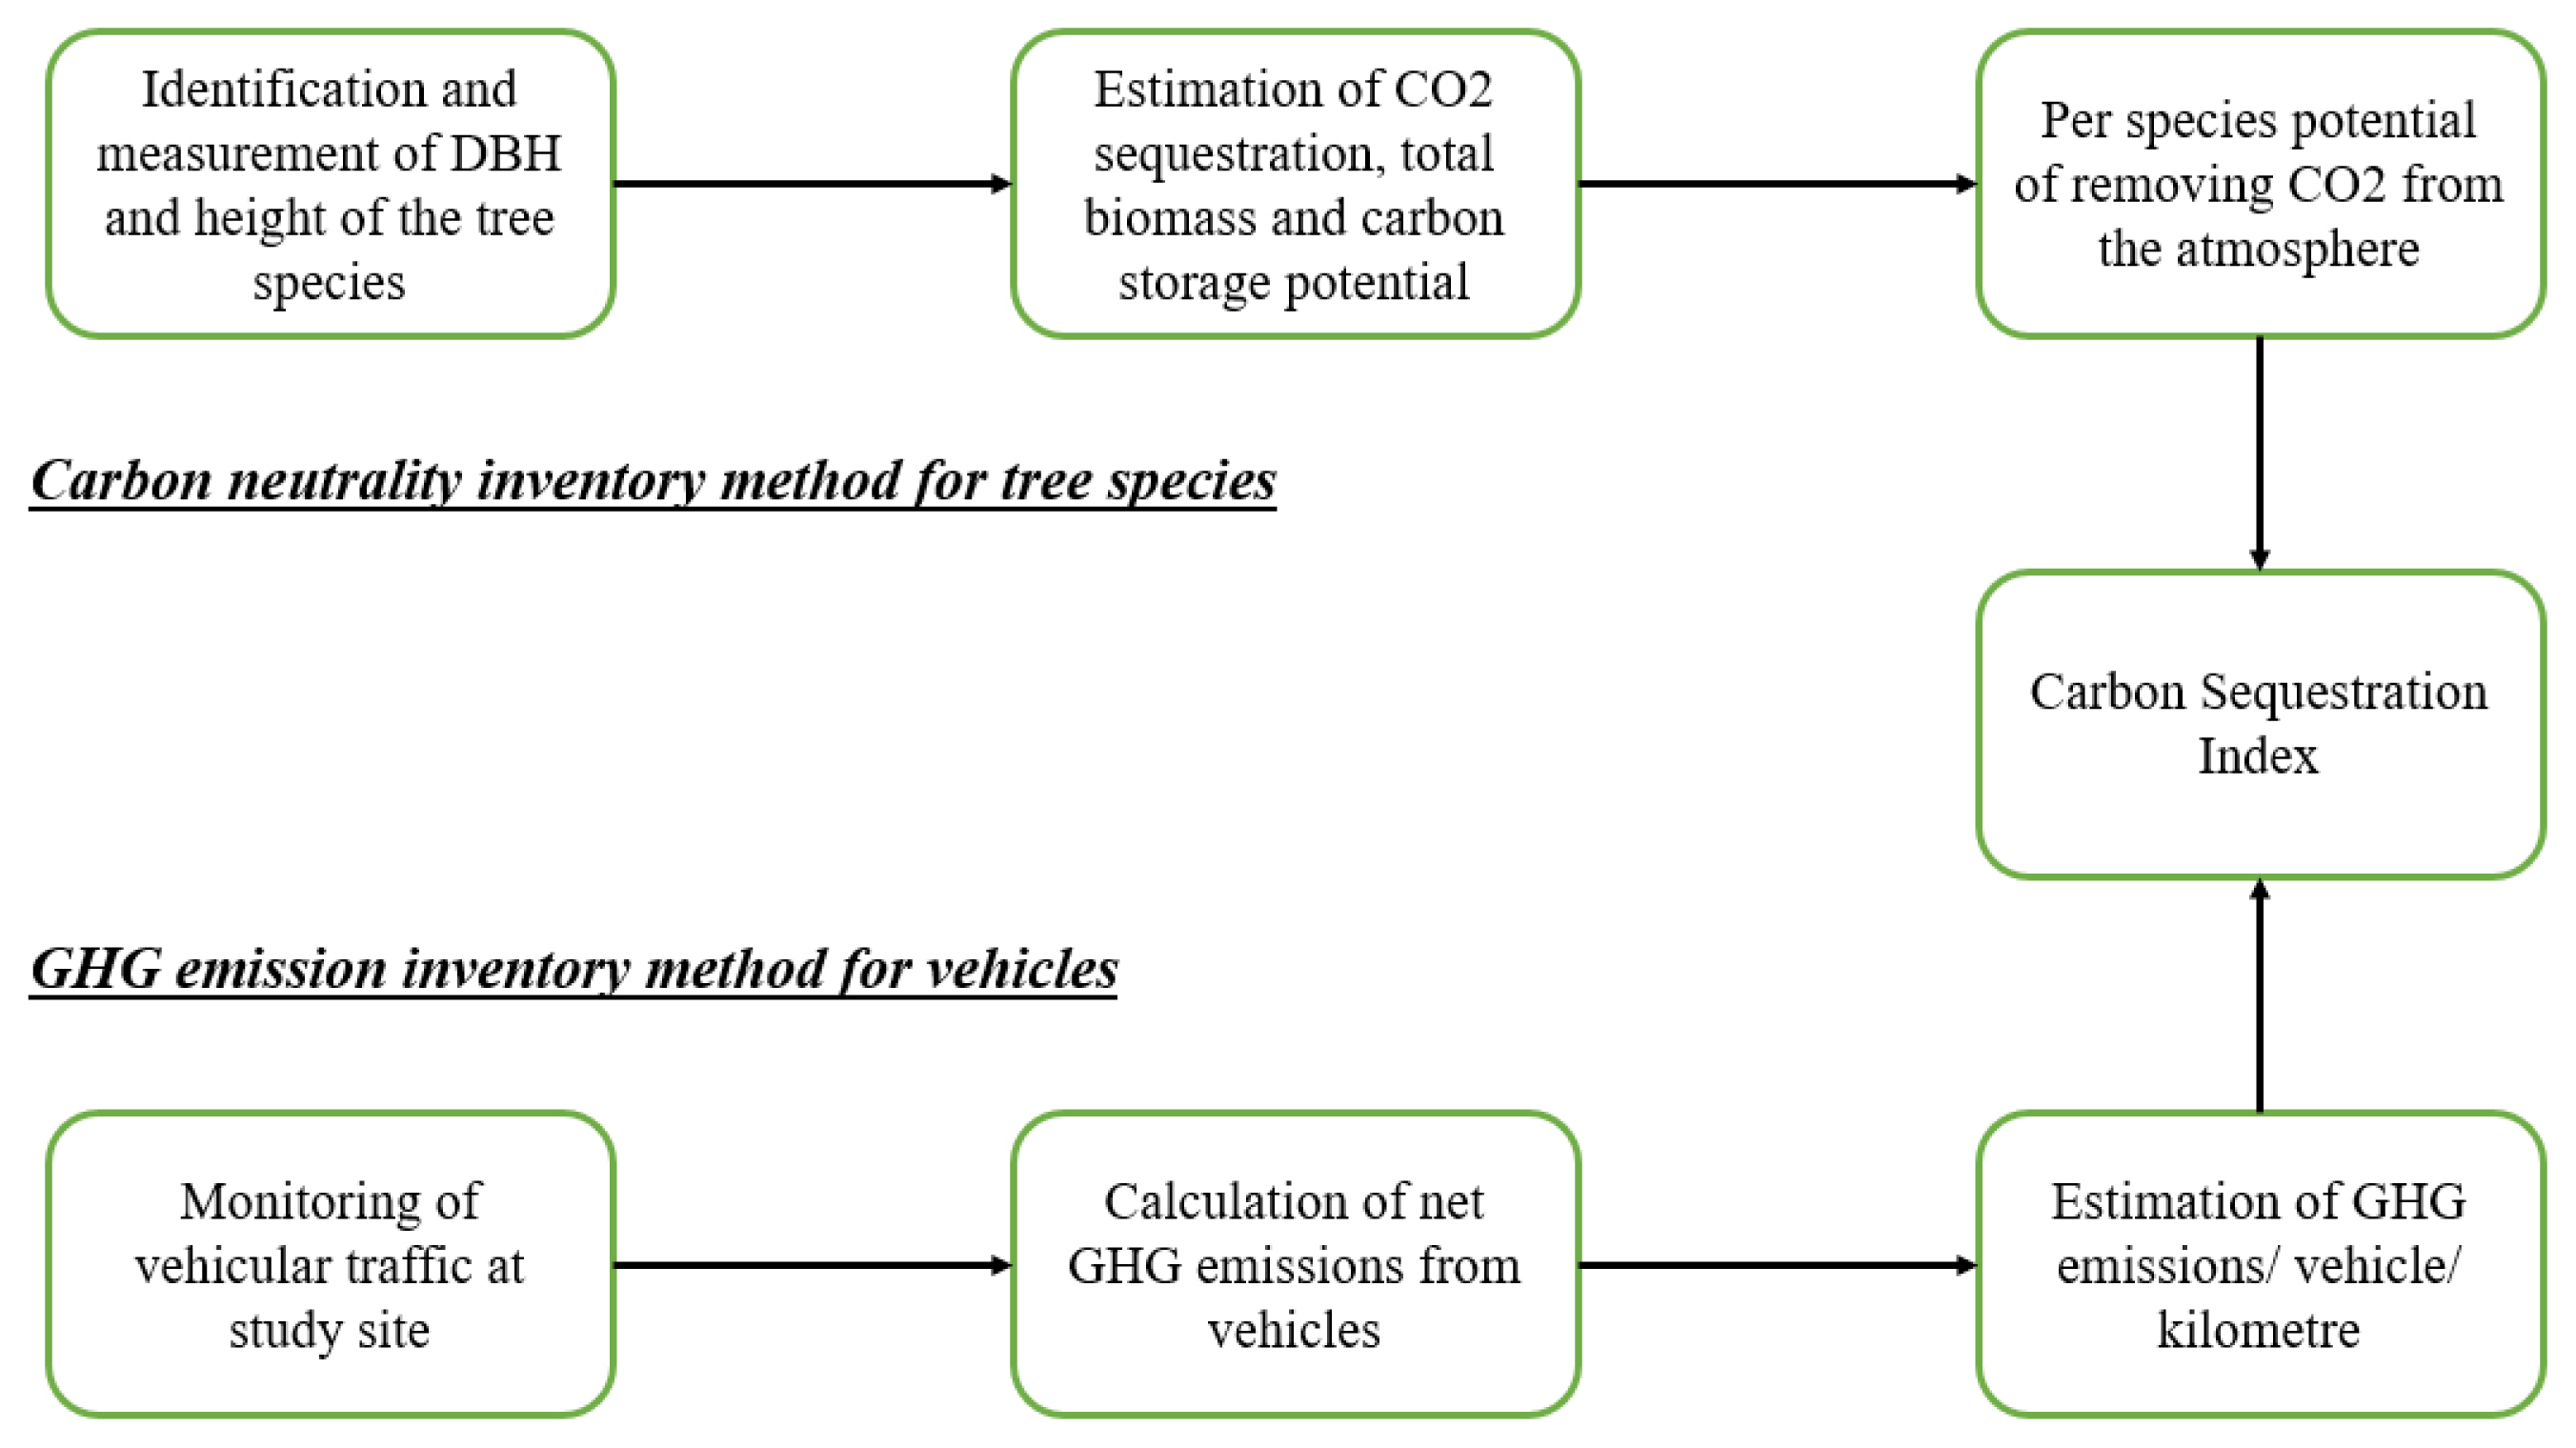
Schematic representation of CSI calculation.
Estimation of GHG emission from vehicle
Arriving and departing vehicles of two-wheeler, three-wheeler, and four-wheelers (LMV and HMV) were counted in both East and West gates for a month with the help of security staff to determine the total GHG emissions. The CO2 emissions were estimated depending on the carbon content of fuels consumed, vehicles, and fuel type. In the present study, the equivalencies we have used to calculate net GHG emissions are called CO2 Equivalents (CO2E). Analysis has been accomplished using Global Warming Potential (GWP) reported from the Intergovernmental Panel on Climate Change’s Fourth Assessment Report. The equivalent weights are 8,887 grams CO2/gallon for gasoline and 10,180 grams CO2/gallon for diesel (Register, 2010).
Estimation of Carbon Sequestration of Trees
The total number of trees and their physical characteristics have been considered to evaluate the carbon sequestration of a tree. The non-destructive biophysical method uses predictor variables such as height and tree diameter to assess a tree’s biomass without destroying it. Studies have been carried out to create an equation by depending on its dry biomass, which is derived from biophysical variables (Ketterings et al., 2001; Brown, 1997).
Two main biophysical characteristics, such as height and diameter at the breast height, are measured for each tree. The Theodolite instrument measures the height of trees, and for DBH, a measuring tap has been used (Chavan and Rasal, 2010; Chavan and Rasal, 2012).
Estimation of above-ground and below-ground biomass
AGB can be defined as the accumulation of all living biomass present overhead the soil. AGB can be evaluated by multiplying the wood density and volume of biomass (Brown, 1997; Ravindranath and Ostwld, 2007). The mass of the tree is calculated by using the diameter and height of the tree. A standard equation is proposed to estimate a tree’s carbon biomass by considering the biomass volume and wood density (0.61).
Where,
V = volume of the cylindrical outline tree in m3
H = tree height in meters
R = tree’s radius in meters
The tree radius is determined from the DBH of the tree, and the value of wood density has been taken from the Global density database, which is 0.61 gm/cm (Saral et al., 2017). BGB involves all biomass of living roots apart from roots having < 2 mm width (Chavan and Rasal, 2011). BGB is evaluated by multiplying AGB by taking 0.26 as the root-to-shoot ratio (Ravindranath and Ostwld, 2007).
The formula for total biomass (TB) is the summation of AGB and BGB above
Estimation of Carbon and carbon dioxide sequestered per tree
Estimation of total biomass provides the general statistics of approximate carbon sequestration done by a tree, and the carbon of any plant is considered 50% of its total biomass (50% × total biomass). Biomass is a critical and foremost approach in carbon sequestration calculation, among other methods that estimate carbon dioxide sequestered per tree per annum (Richter et al., 1995). We have considered the estimation of carbon counting developed by (County, 2012). The dry weight equation is directly proportional to the physical relation between wood density and volume (Xu and Mitchell, 2011). Diversity of tree density can be noticed within a species, so using various formulas for each tree is not promising for much accuracy. The following steps are crucial to determining the sum of CO2 sequestration per annum.
The tree’s weight should get determined by using the height and diameter of the trunk.
An average of 72.5 % of the total weight should get converted into dry weight in the form of organic matter.
50% of dry weight is taken into consideration during the carbon estimation.
The total amount of carbon will transfer to the net amount of CO2 sequestrated by multiplying 3.6663 since two extra oxygen molecules add to each carbon molecule.
To get the annual amount of sequestration, we need to divide the total carbon sequestration by the tree’s age (County, 2012).
Equations for estimating CO2 sequestration per tree per annum are given below,
where:
H = height of a tree in feet (De Villiers et al., 2014)
W = weight of CO2 sequestered in the tree per year in pounds
D = diameter of a tree in inches
Carbon sequestration index calculation (kg)
The total carbon sequestration of terrestrial vegetation and total GHG emission have been done using the above equations and primary data from Environmental Protection Agency, USA, respectively (USEPA, 2019). The following formula calculates the Carbon sequestration index (CSI).
Where,
CSI= carbon sequestration index
Tseq = sequestration of carbon by terrestrial vegetation
Aems = total GHG emission of an area (A’an et al., 2018).
Regression analysis
Regression analysis is a statical technique usually done between the observed or dependent variable and predictor or independent variables. It proves the strength of association between two variables exhibiting upcoming coordination among them through R-squared with a confidence level (< .01 level). Linear Regression analyses were performed to estimate the relationship between the carbon sequestration potential of individual trees and CSI of measured Vs. Predicted.
Results and Discussion
Urban green spaces, particularly roadside trees, have the potential to sequester CO2 emitted from vehicular traffic due to their prevalence in the ambient zone. In addition, they also help in the reduction of GHG emissions. Based on vehicle count, per day GHG emission in kg/km/year is calculated for different vehicles and is incorporated in Table 1. The results show that 39,599.54 kg/km/year of GHG emissions were recorded from the study area. A recent study suggested that 900 million additional planting of trees can absorb one-third of global anthropogenic emissions (Bastin et al., 2019).
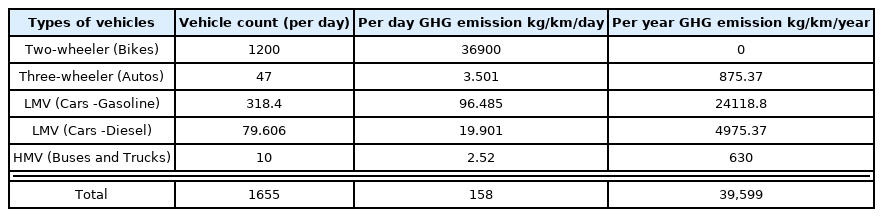
GHG Emissions in kg/km/year by different types of vehicles
Carbon sequestration by tree species
A total of 1041 trees belonging to 21 diverse species were computed, which are present on the roadside of the campus. Trees of Pongamia pinnata, Azadirachta indica, Conocarpus lancifolius, and Spathodea campanulata were found to be the highest number, with 120, 166, 155, and 109 trees, respectively (Table 2). Among these species, Conocarpus lancifolius can absorb heavy metals through its shoots, roots, and leaves (Rasheed et al., 2020). Another prominent species in large numbers is Peltophorum dasyrrhachis, with 92 trees. It is tall, drought-resistant, and produces shelter for other pioneer plants to grow (Van Sam et al., 2004). A parallel study was carried out at Niamey city, Niger, West Africa, where they urged Azadirachta indica can possess an extensive amount of carbon in it, depending upon the geographical and climatic structure of an area (Moussa et al., 2018). However, the physical parameter of trees like growth and carbon storage depends on various factors, including soil structure, temperature, water, nutrient availability, species selection, and other economic and logistic challenges (Waring et al., 2020).

Carbon sequestration potential of various tree species in the study area
A significant variation can be noticed between large and small trees regarding carbon potential. Trees with more than 150 cm diameter demand more atmospheric carbon than trees with a minor diameter (12.5 cm). The saving capacity of carbon in large trees is nearly 1000 times more than that of smaller trees ( Mildrexler et al., 2020) Hence, tree growth represents the total biomass, accelerating the carbon sequestration potential of an induvial (Dwivedi and Alavalapati, 2009). The photosynthetic efficiency, CO2 uptake, and net primary production depend on the tree’s AGB and BGB. It is a natural air purifier that constantly removes pollutants and improves air quality (Nowak, D.J. and D.E. Crane. 2002). Factors prohibiting a tree’s biomass include water availability, temperature, nutrients, and concentration of atmospheric gases (Gower and Ahl, 2006). In the study, the highest biomass both above and below-ground is recorded with Pongamia pinnata (10195 kg/tree for AGB and 1529 kg/tree for BGB) followed by Eucalyptus globulus (8033 kg/tree for AGB and 1204 kg/tree for BGB) and Azadirachta indica (1996 kg/tree for AGB and 299 kg/tree for BGB). The AGB of other species was recorded between 138 to 1945 kg/tree. BGB of different species ranged from 16.23 kg to 291 kg/tree. The total biomass of all species was found between 159 kg/tree and 11724 kg/tree. The lowest biomass was found in Roystonea regia, and the highest biomass was found in Pongamia pinnata. Pongamia pinnata is in trend for production of a good amount of biomass between 2–18years after plantation because it develops horizontally and vertically during the primary growth. Earlier researchers also noticed a similar trend (Buvaneswaran et al., 2006; Bohre al., 2014). AGB and BGB are the accumulation of carbon stock of a plant which denotes act as a key factor to observe the overall carbon stock of an ecosystem (Dayathilake et al., 2020). DBH plays a significant role in assessing carbon sequestration (Tshering, 2019). In terms of the highest DBH, Pongamia pinnata is an efficient species with a DBH of 175 m. The second highest has been recorded in Eucalyptus globulus with 9.849 m. It has multiple ecological benefits for urban culture like soil conservation, degraded land restoration, and rejuvenation of native woody species (Bayle, 2019). Peltophorum dasyrrhachis, Bambusoideae, and Ficus benjamina have recorded DBH as 15.2 m, 0.74 m, and 15.222 m, respectively. Maximum carbon sequestrated per year in the campus has been observed in Pongamia pinnata with 257746 kg/year, followed by Azadirachta indica with 70557 kg/year, Bambusoidea with 7777 kg/year. The lowest carbon sequestration has been recorded in Sideroxylon foetidissimum with 54.05 kg/tree. The highest carbon sequestrated per tree is 25774 kg recorded in Pongamia pinnata, followed by Eucalyptus globulus with 9575 kg. Sequestration potential by Ficus benjamina and Azadirachta indica were 3262 and 5100 kgs, respectively. The biophysical features which enhance CO2 absorption by the trees rest on the number of the orientation of stomata on the leaf surface, tree foliage, phyllotaxy, stomatal apparatus, and availability of CO2 around stomata, etc. (Sciencing, 2018) At North Maharashtra University Campus, Azadirachta indica showed the best sequestration potential with 686454.5 lbs of CO2. Some other similar species like Peltaforum pterocarpum (9.576 tons), Delonix regia (12.247 tons), Tectona grandis (1.915 tons), and Eucalyptus citriodora (1.814 tons) were shown good sequestration potential on campus (Suryawanshi et al., 2014).
In this study, we have documented different rates of sequestration potential from 21 diverse species. Some of the tree species found in the study area have unique importance in carbon sequestration. Pongamia pinnata is well known for its drought resistance and can easily sustain in all soil types. It is highly recommended for afforestation due to less water requirement and having a sizeable canopy providing shade for other organisms to grow (Badole and Bodhankar, 2012). Similarly, Azadirachta indica is a species in which biomass accumulation of carbon is high. These species act as a carbon sink (Moussa et al., 2018). Eucalyptus globulus is also one of the important tree species that convert atmospheric CO2 into biomass and can sequester carbon at a higher rate than other species (Behera et al., 2015). In addition, Bambusoideae, even when present in smaller tufts, have faster growth and have higher carbon stock potential (Yiping et al., 2010), and Aquilaria malaccensis plays a vital role in maintaining ecosystem stability by all mechanisms of carbon and biogeochemical cycles (Utomo et al., 2021). An ecosystem with various no. of tree species can grow faster than the monoculture system and improve its carbon stock (Liu et al., 2018; Grossman et al., 2018; Wu et al., 2016; Paquette and Messier, 2011).
Carbon Sequestration index
In compression to the other sector’s emissions, dairy farms produced the highest emissions/ha (8.4–10.5 t CO2 eqv/ha), followed by beef (3.9–5.1 t CO2 eqv/ha), sheep (2.8–4.3 t CO2 eqv/ha) and grains (0.1–0.2 t CO2 eqv/ha) (Browne et al., 2011) where ours is reasonably high due to traffic movement is frequent. The total number of trees required to mitigate overall GHG emission is lesser than the trees already present in the system, which indicates the efficiency of carbon sequestration to change the micro-climate and its potential to reduce GHG emission. Plantation not only meets GHG emissions but also reduces soil erosion, enhances the richness of biodiversity, prevents water loss, etc. (Laclau et al., 2013). CSI value is 0.58, said to the global carbon project. This value indicates that the capacity to sequester carbon is lower than the actual anthropogenic carbon emission (Le et al., 2015). In this present study, Pongamia pinnata and Azadirachta indica are shown to have the highest CSI, with 6.51 and 1.78, respectively. According to the current study data, trees play a more crucial role in the carbon sequestration than other methods. Based on CSI, the results suggest that tree species have a high potential for dropping the effect of GHG emissions (A’an et al., 2018). To manifest this, regression analysis was applied between the net carbon sequestration of individual species with the CSI and observed a significant (< .01 level) relation of GHG emissions with tree species (Fig. 3). The measured and predicted CSI analysis also confirms the considerable relation (< .01 level) between carbon sequestration by trees and reducing GHG emissions (Fig. 4). Among CSI values, Pongamia pinnata and Azadirachta indica act as keystone species in this area because these plants have efficient potential to absorb carbon and are better than others in counterbalancing GHG emissions. The total GHG emission of our study area is 39,599 kg/yr, where 1041 trees are present inside the boundary, and the entire carbon sequestration is 475921.5 kg/yr. Only 86 trees are sufficient to offset the total GHG emission coming out from this area, whereas 955 trees are adequate for this place; in consequence, it contributes to fixing the micro-climatic issue in a big way. The result reveals that this study area has a positive carbon balance by contributing more oxygen to the atmosphere and decarbonizing it. One comparable study was conducted in south-eastern Brazil’s agroforestry system, where overall GHG emissions were 7.98, 4.25, 4.04, and 2.80 t CO2 ha-1, on systems 1, 2, 3, and 4, respectively, and the sum of trees was 2110. Surplus no. of trees was 1975, and 135 no. of trees were required to fix the GHG emission of that particular area (Torres et al., 2017). Another study had led on Bintan Island, where total GHG emission was 0,262 Tg (Tetragram) C yr-1 for marine and terrestrial vegetation. The CSI value was 0.98, more than the global CSI value. This study showed that green foliage was present more than the requirement to neutralize the GHG emission (A’an et al., 2018). CSI is properly explaining the relationship between plants and GHG emissions. For this reason, this method has been applied to assess the potential of trees in an institutional area. The plantation is one among the various techniques used for the decarbonization process and plays a fundamental role in providing multiple ecosystem services and paring with immediate reduction of fossil fuel (Anderson et al., 2019; Allen et al., 2018).
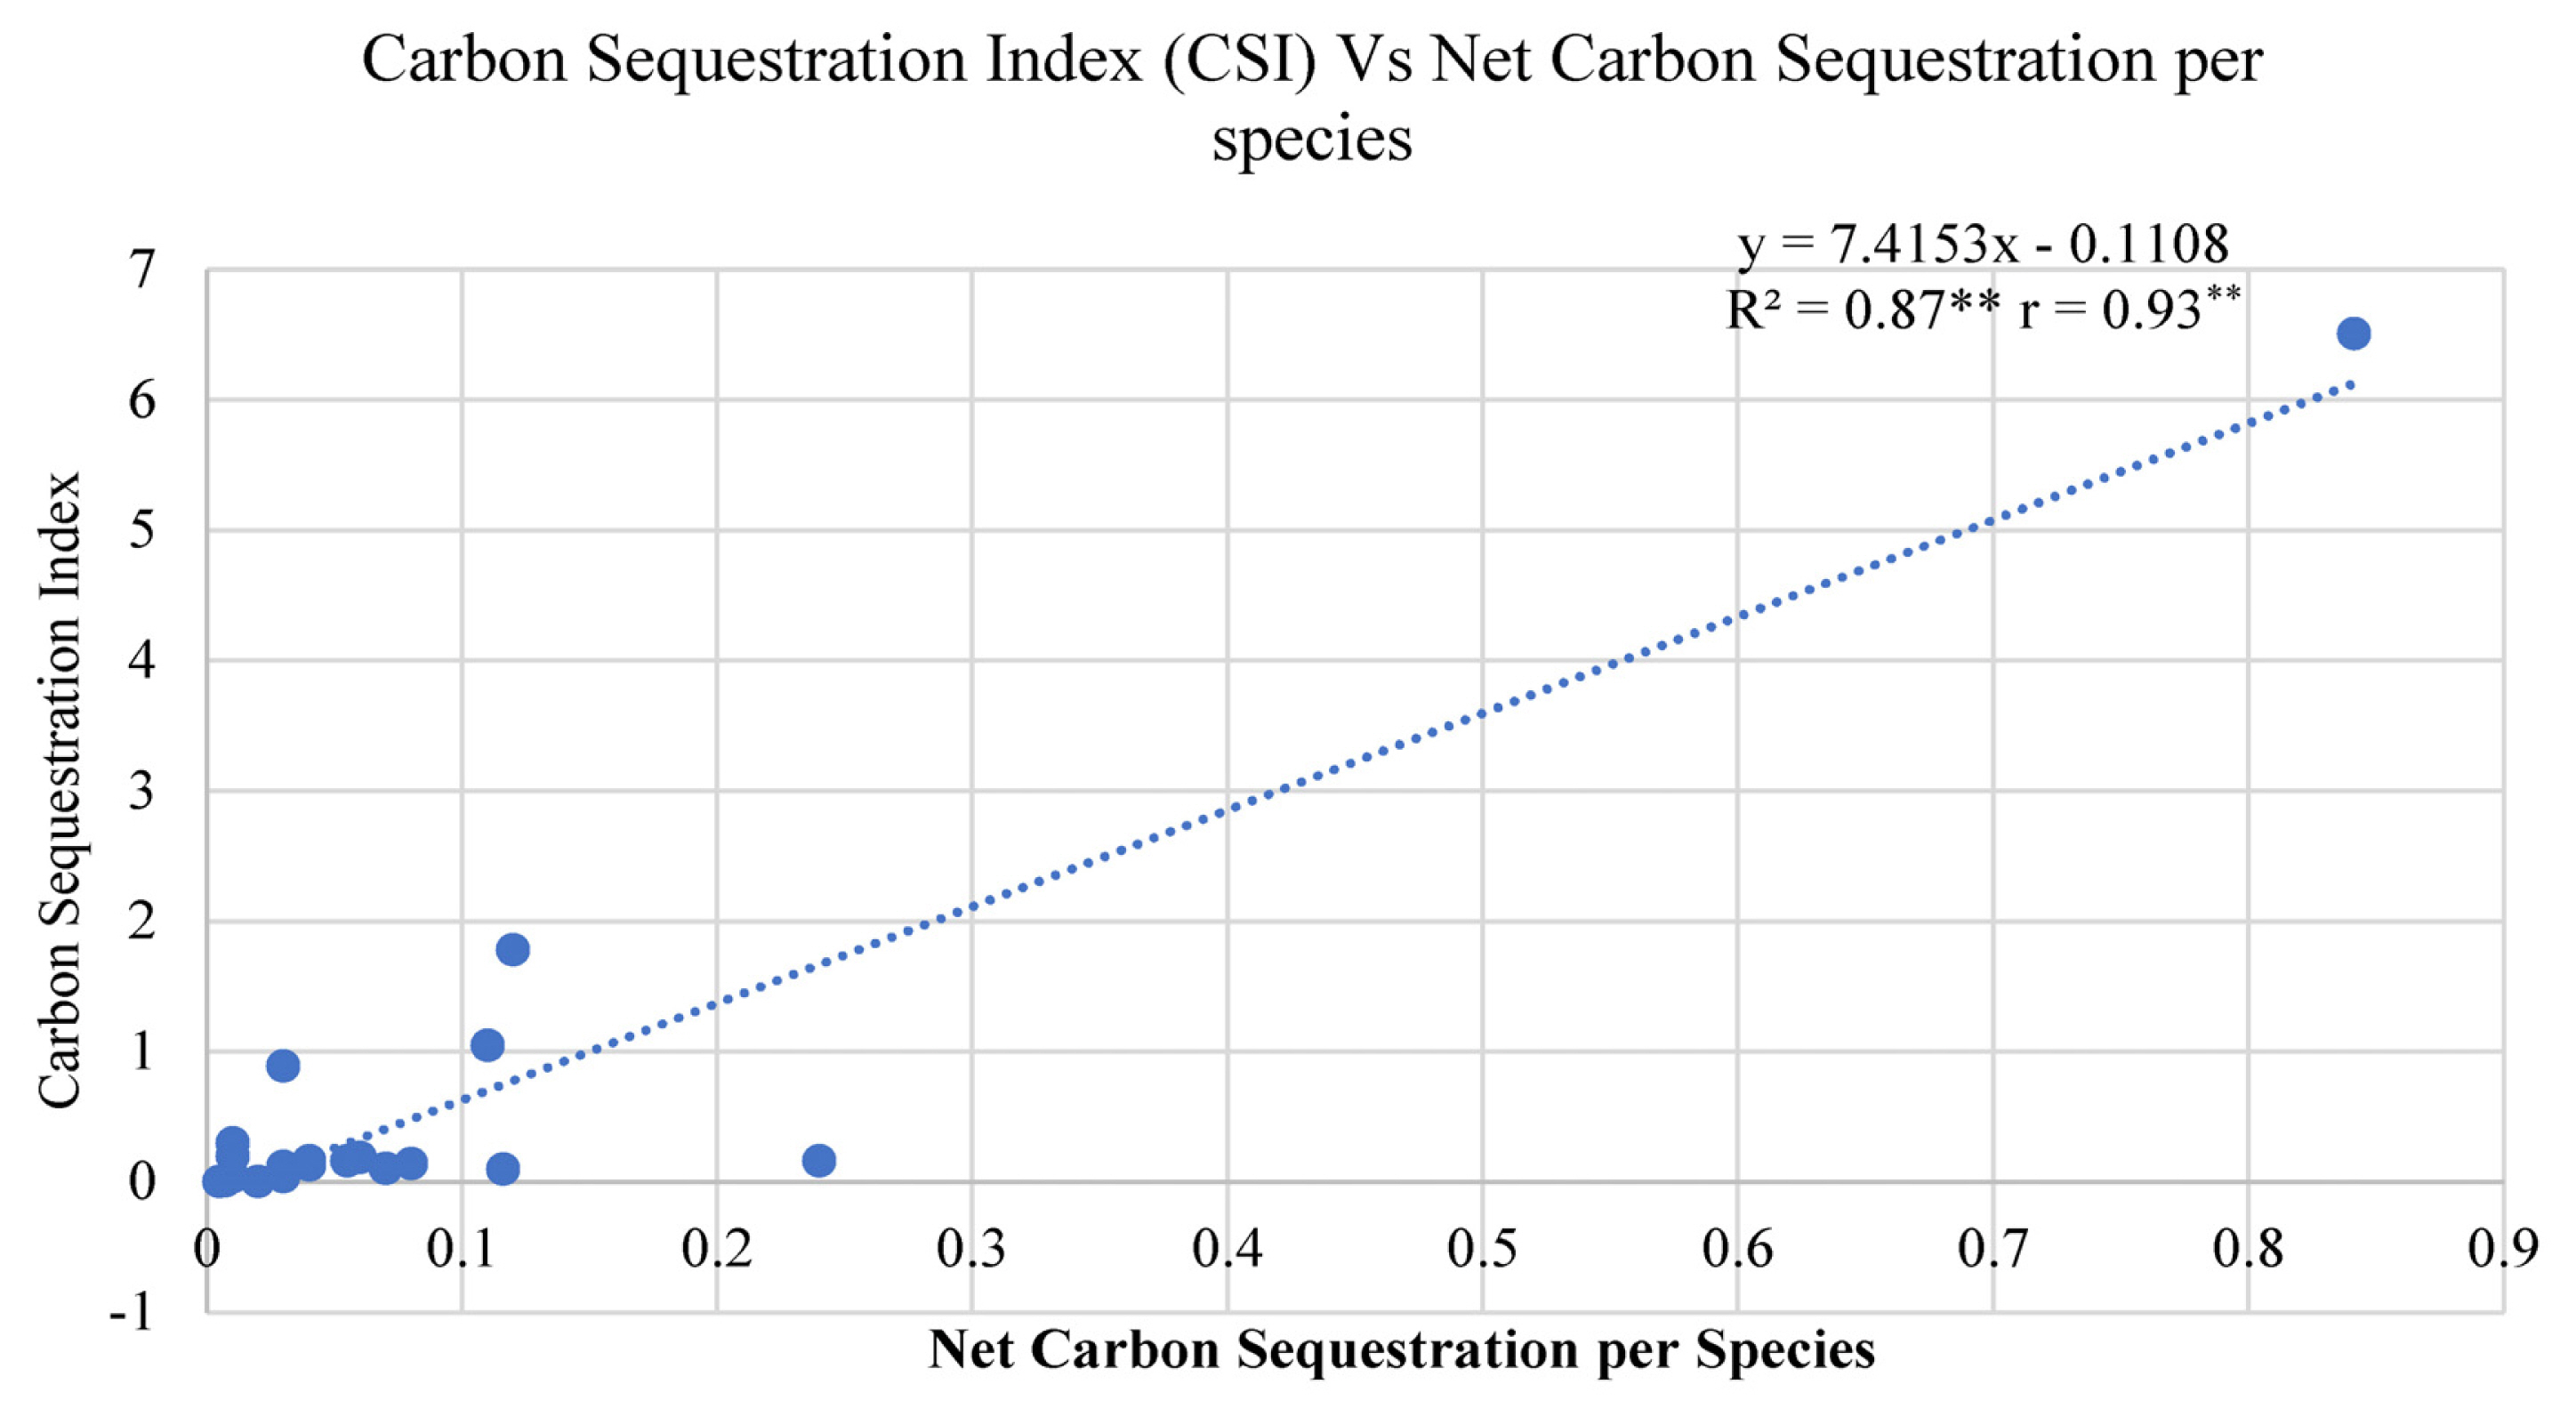
Regression analysis between CSI and net carbon sequestration.
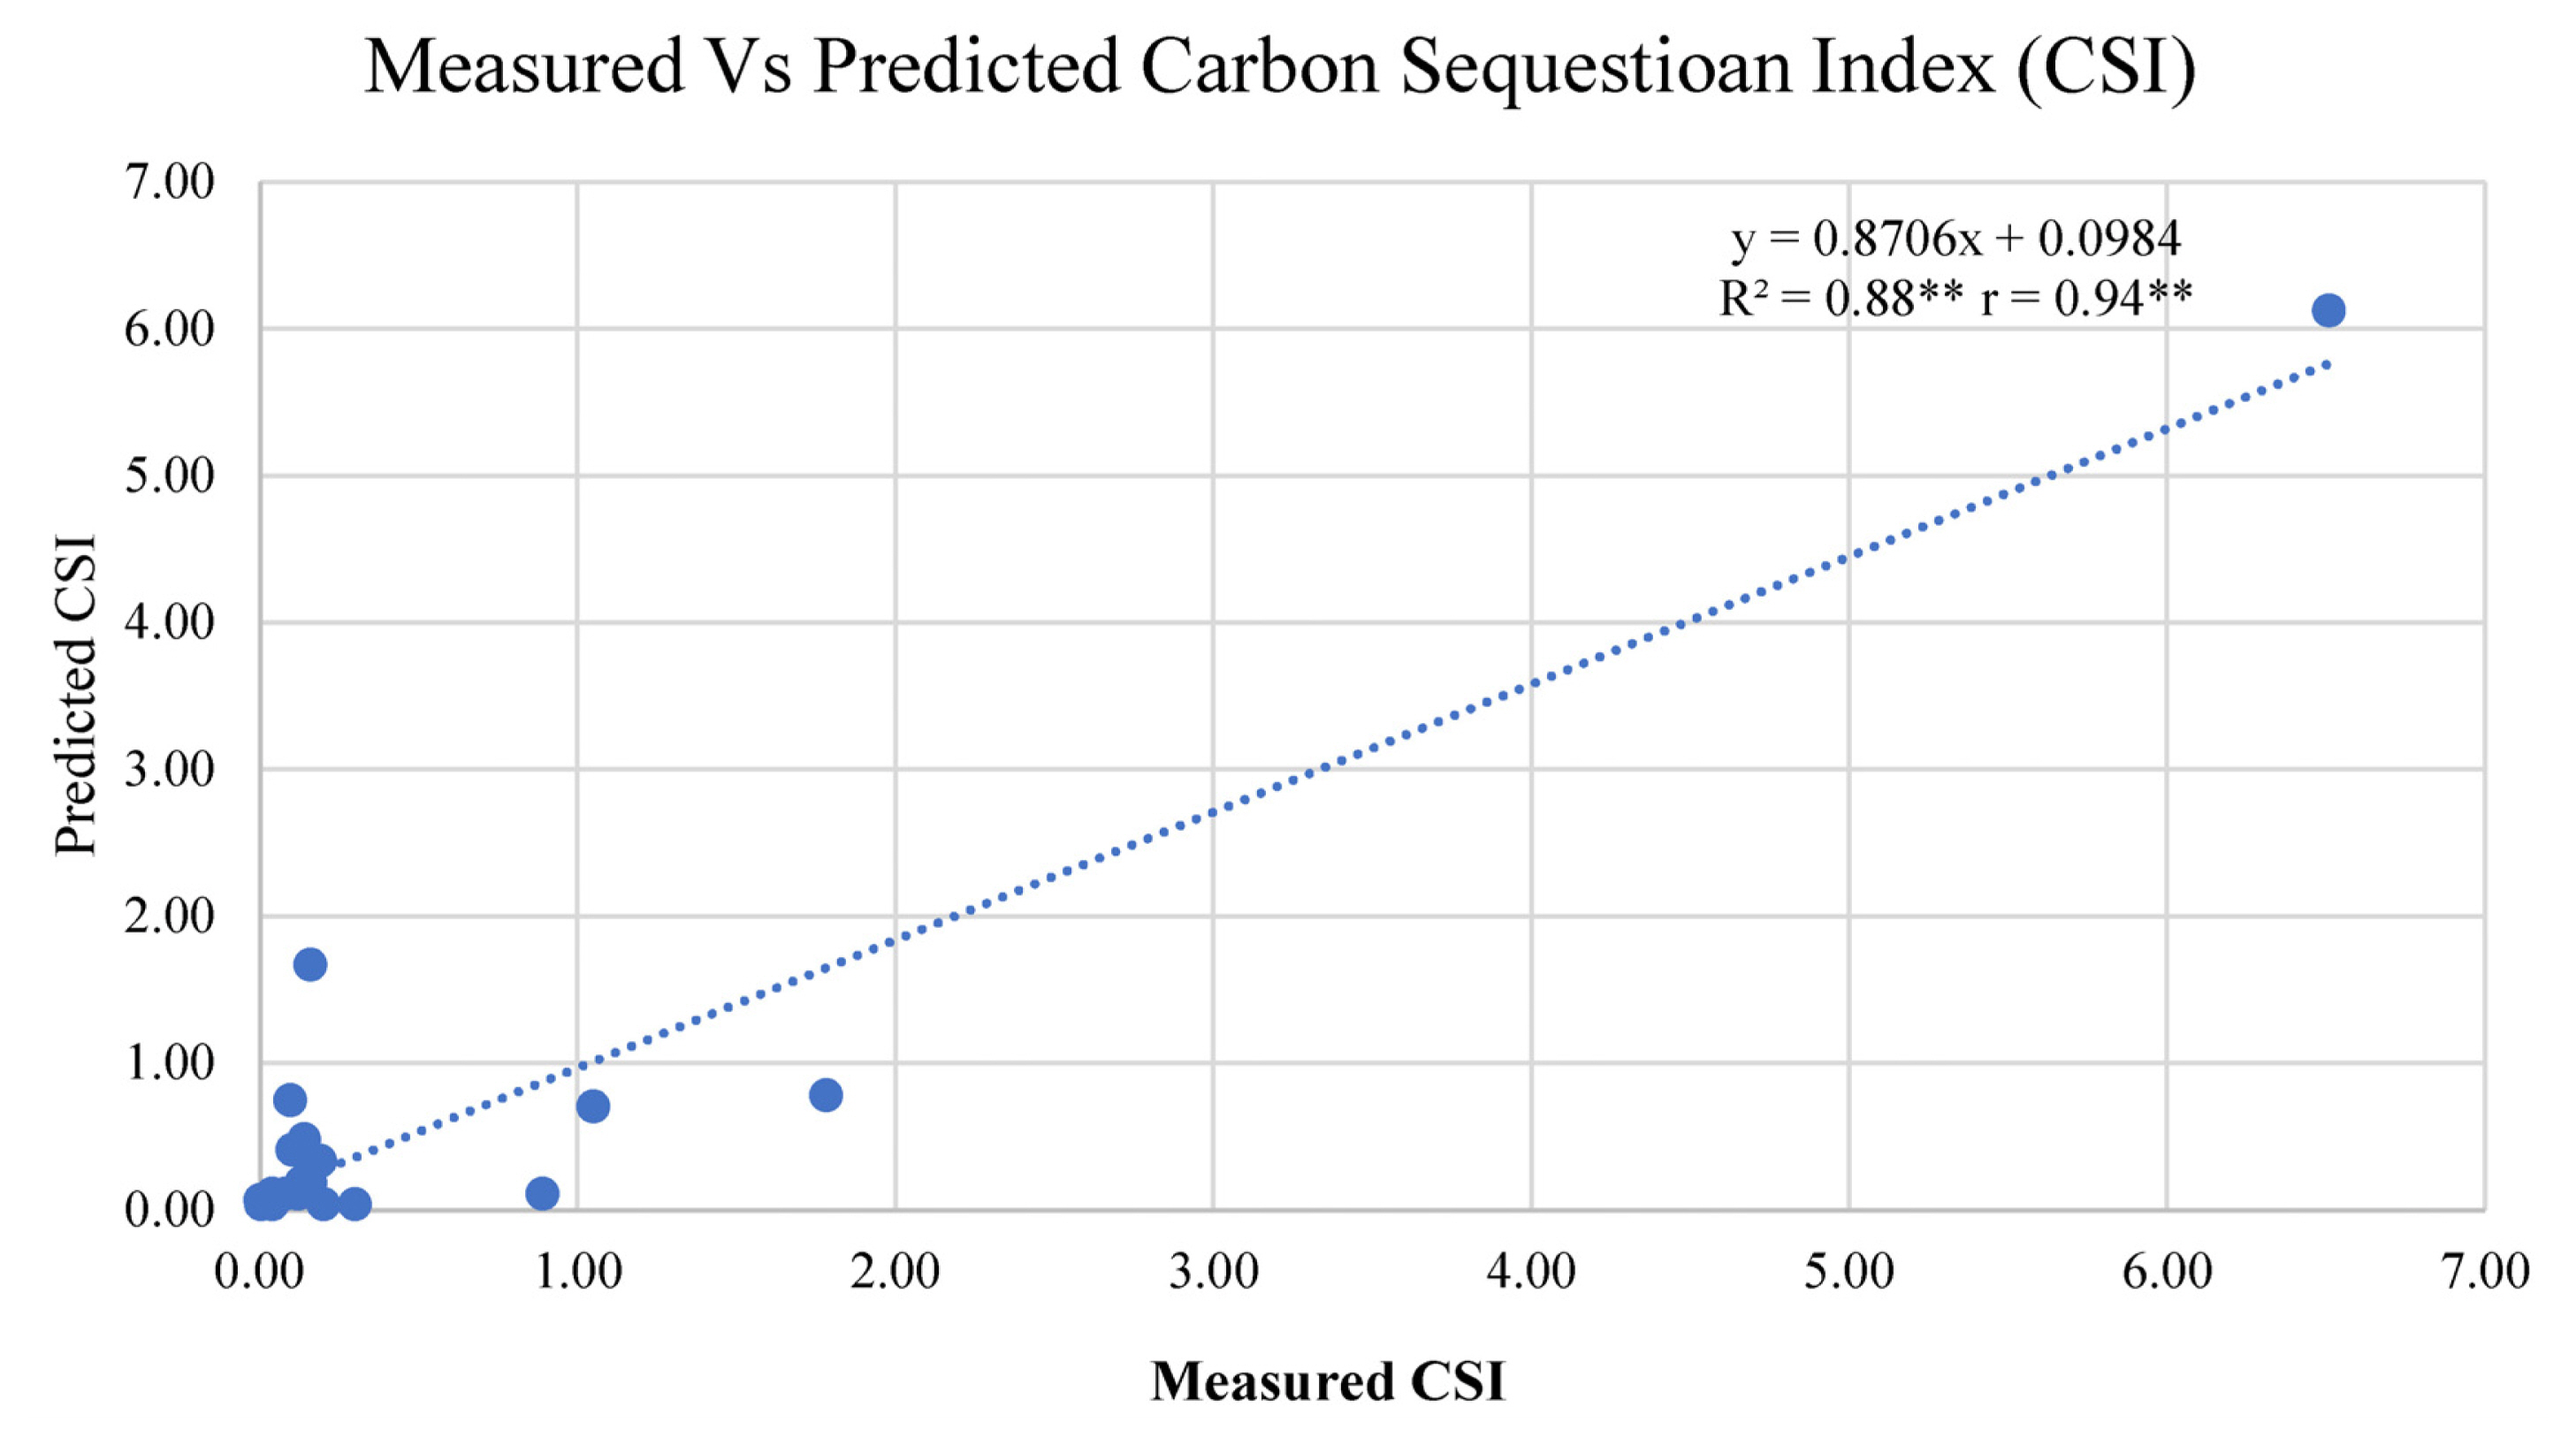
Validation of measured and predicted CSI.
Conclusion
From this study, we can determine that the plantation of different species in a confined area will reduce GHG emissions and be responsible for advancing the sustainable ecosystem. Combining other species lessens the disaster effect of nature and makes the surroundings stable. Among 21 diverse species, Pongamia pinnata has shown the highest biomass, followed by Eucalyptus globulus, and Azadirachta indica. One drawback with Eucalyptus globulus is that they absorb groundwater in high quantity for its overall growth. It is advisable not to grow in an arid or semi-arid area. An average of 86 trees is enough to meet 39,599 kg/yr GHG emissions of the study area, and 955 trees are adequate for this place. This revealed the potential of plants and how CSI is cooperative to show the direct relation between trees and GHG emissions of an area. CSI results also confirmed that Pongamia pinnata and Azadirachta indica act as keystone species in this area because some plants have efficient potential to absorb carbon and are better than others in removing GHG emissions. Realizing the most significant possible benefits of plantation to ecological and sociological contexts, every institute or organization should develop good greenery around it to give their hand in transforming our crappy environment.
Notes
The authors are thankful to the GITAM, Deemed to be University, Visakhapatnam, for providing necessary facilities during the work period.