An Analysis of Permanantly Shaded Areas and the Defect Rate of Landscape Trees in Apartment Complexes Using Daylight Simulations
Article information

Abstract
Background and objective
The purpose of this study was to provide basic data on trees that can be used for planting design and construction for permanently shaded areas by grasping the growth status of trees according to the daylight conditions of the outdoor spaces of apartment complexes.
Methods
On the recently completed apartment complexes, daylight conditions were analyzed by using daylight simulations utilizing Solar Access Analysis of Ecotect Analysis. With a criteria for assessment of tree condition, the defect rate of trees planted in permanently shaded areas and green spaces with good daylight conditions was analyzed to suggest trees applicable to permanently shaded areas. The first tree survey was conducted from November 18, 2019 to February 15, 2020, focusing on trees planted in permanently shaded areas, and the second tree survey of all the trees planted on the study sites including permanently shaded areas was conducted from March 16 to March 30, 2020.
Results
Evergreen trees which are classified as shade intolerant trees including Pinus densiflora, Thuja occidentalis, and Abies holophylla showed a higher defect rate of trees among the trees planted in permanently shaded areas. Taxus cuspidata, Zelkova serrata, Cornus kousa, Chionanthus retusus and Acer palmatum which are classified as shade tolerant trees and shade moderate tolerance trees seemed to be able to be used in the plant design of permanently shaded areas in apartment complexes because the trees showed good growth and a low tree defect rate. In addition, although it was excluded from the analysis due to a small number of samples, Sorbus commixta and Prunus cerasifera var. atropurpurea also can be used for planting in permanently shaded areas.
Conclusion
The daylight simulation technique used to analyze permanent shaded areas in this study can be used as an analysis tool considering the daylight environment at the stages of design and construction, and additional research will be required to analyze tree growth according to daylight conditions through data accumulation and monitoring by managing records throughout the entire life cycle of trees in the process of planting and maintenance.
Introduction
Landscape green spaces in apartment complexes are mostly determined based on the shape and layout of buildings. As buildings have risen high, the distance ratio between buildings has decreased, but the distance between buildings has increased to protect residents’ right to light, which has led to wider green spaces between buildings. In terms of the shape of buildings, flat-type structures are used more for the straight layout of buildings and tower-type structures are used to save spaces and flexibly lay out buildings, which affects the flow of human traffic in apartment complexes and the direction of buildings. Changes in the shape of apartment buildings and underground parking lots have led to the expansion of landscape spaces in apartment complexes (Shin, 2010). People’s interest in the duration of daylight and the growth of trees in apartment complexes increases, but only few studies have been conducted to identify the correlation between the environment of daylight - the most fundamental and important factor for the growth of trees - and the growth of trees or essential daylight conditions for the growth of trees (Jung et al., 2015). Outdoor landscape spaces in apartment complexes are designed after planning the block layout and the flow of emergency vehicles. In this process, microclimate that is created under fixed conditions such as the duration of daylight and insolation and other various factors such as the growth conditions of trees need to be analyzed and reflected in planting design, but they have not been done so in reality. If planting is designed and performed without analyzing the growth conditions of trees, trees will grow poorly and the defect rate of trees will also increase over time, resulting in the continuous repair of defects and an increasing burden on constructors and residents. Therefore, the environment of daylight (duration of daylight, insolation, etc.) that directly affects the growth of trees and permanently shaded areas must be considered before selecting trees suitable for the environment in order to lower the defect rate of trees and continuously maintain a good landscape of trees in the stage of completion.
The recent layout of apartment complexes has mainly adopted the method of laying out L-shaped buildings (flat + tower) repeatedly in order to efficiently utilize spaces considering economic feasibility. Compared to the early flat-type layout, the shape and layout of buildings have become complex, and thus has created many permanently shaded areas that can hinder the growth of trees in outdoor spaces. Recent trends in studies on defects in trees in apartment complexes were examined. Yoon and Ahn (1996) surveyed the current size and planted location of four landscape trees within apartment complexes and analyzed the time of shadows of each building to identify the relationship between the time of shading and the growth of trees. Han et al. (2015) calculated the range of illumination intensity in spaces for planting for biodiversity in landscape spaces in apartment complexes and provided basic data for planting shrubs and flowering plants according to it. Park (2019) simulated daylight in study sites, checked whether the conditions of daylight that were measured at each point on site coincided with the simulated conditions of daylight, and utilized the results in selecting locations for trees considering the amount of solar radiation according to solar altitude. Park, Jeong, et al. (2015) utilized Ecotect Analysis to simulate daylight conditions according to the layout shape of apartment complexes and selected flowering plants that are applicable to each illumination intensity in each area (shady, sunny, complex areas) categorized by analyzing the conditions of daylight. Han et al. (2016), Lee et al. (2017) and Park, Han, et al. (2015) surveyed the light distribution in the lower part of trees based on the results of analysis of light requirements for ground-cover plants for multi-layer planting in order to utilize the results as basic data for planting shrubs and flowering plants. Han and Lee (2018) examined the effects of shadows created by buildings on the roadsides - physical elements in urban spaces - and the appropriateness of planting roadside trees. Kim et al. (2014) analyzed the duration of daylight in spaces for planting by the type of apartment complexes to provide data for gardeners in apartment complexes to select plants suitable for the location of planting. Moon (2014) analyzed the growth conditions of trees and ground-cover flowering plants according to the amount of daylight in the lower parts of overpasses. The amount of daylight was analyzed using Google Sketchup program and the amount of chlorophyll content and soil moisture were analyzed to examine the growth status in the study. It was found that the growth of plants was affected not only by the amount of daylight, soil moisture and the height of overpasses, but also by other environmental factors. Most of earlier studies simulated daylight to suggest flowering plants applicable to each light condition or to increase the production of plants and many studies have been conducted on ground-cover plants planted in permanently shaded areas. However, databases for each species of plants applicable to permanently shaded areas have not been established through basic research on trees.
This study aimed to survey the growth status of trees in the outdoor spaces of apartment complexes according to the conditions of daylight in order to analyze the defect rate of trees and to provide basic data on trees for utilizing in planting design and execution. To do so, daylight simulations were conducted on recently constructed apartment complexes to analyze the conditions of daylight and the defect rate of trees planted in permanently shaded areas and those planted in green spaces of which daylight conditions were good were compared through time series analysis. Specific species of trees that are applicable to permanently shaded areas were suggested in this study, which is differentiated from earlier studies.
Research Methods
Selection of study sites
To examine the survival status of trees planted in permanently shaded areas, study sites were selected among the apartment complexes that were built between 2016 and 2019 and met the following conditions: apartment complexes that were built on a flatland to easily identify permanently shaded areas through daylight simulations and that laid out L-shaped buildings (flat + tower) that are widely adopted today for the efficient utilization of spaces and good daylight conditions. In particular, to increase accuracy, this study selected the sites of which detailed data including as-built drawing, shop drawing and yearly defect inspection report were available, and of which trees started to be planted in March - the most suitable time for planting - and completed planting in summer considering the close relationship between the time of planting and defects in trees (Table 1).

Target area details
In the case of Study Sites 1–3 in Table 1, their planting design drawing was prepared based on the results of analysis of shadows by hour utilizing Google Sketchup Program in the stage of working design, but in the process of planting the species and size of trees were changed and thus various species of trees were planted in permanently shaded areas. Study Site 4 conducted daylight and thermal analysis utilizing Ecotect Analysis and Envi-met Program in the stage of planting (Park, 2019), and planted trees considering permanently shaded areas.
Daylight simulations in study sites
To examine the ratio of shadows by hour and the environment of daylight according to the location of the sun from sunrise to sunset in study sites, simulations were conducted utilizing Solar Access Analysis of Ecotect Analysis (version 2011 for Windows; Autodesk, San Rafael, California). The latitude and longitude of study sites were identified using Google Earth Program, and their weather data were obtained from the weather data collected by the Korean Solar Energy Society that have been accumulated for years and thus are reliable for research.
The duration of daylight by study site was analyzed as of the summer solstice (June 21) from 7 a.m. to 7 p.m. when the angle of daylight is maximized. The size of cells for analysis was set as 2 m × 2 m equally in study sites. The square-shaped cell for Ecotec Analysis can be set using the Surface Subdivision method in the Modify menu or using the Analysis Grid method in the Control tool. When targeting a large-sized area like the outdoor spaces of apartment complexes, it is recommended to use the Analysis Grid method that takes relatively less time to analyze and thus the Analysis Grid method was used in this study. Mensuration was performed utilizing AutoCAD to calculate permanently shaded areas based on the analyzed results. The analyzed images and the planting drawings were overlapped to utilize them as basic data for surveying trees planted on permanently shaded areas (Fig. 1).
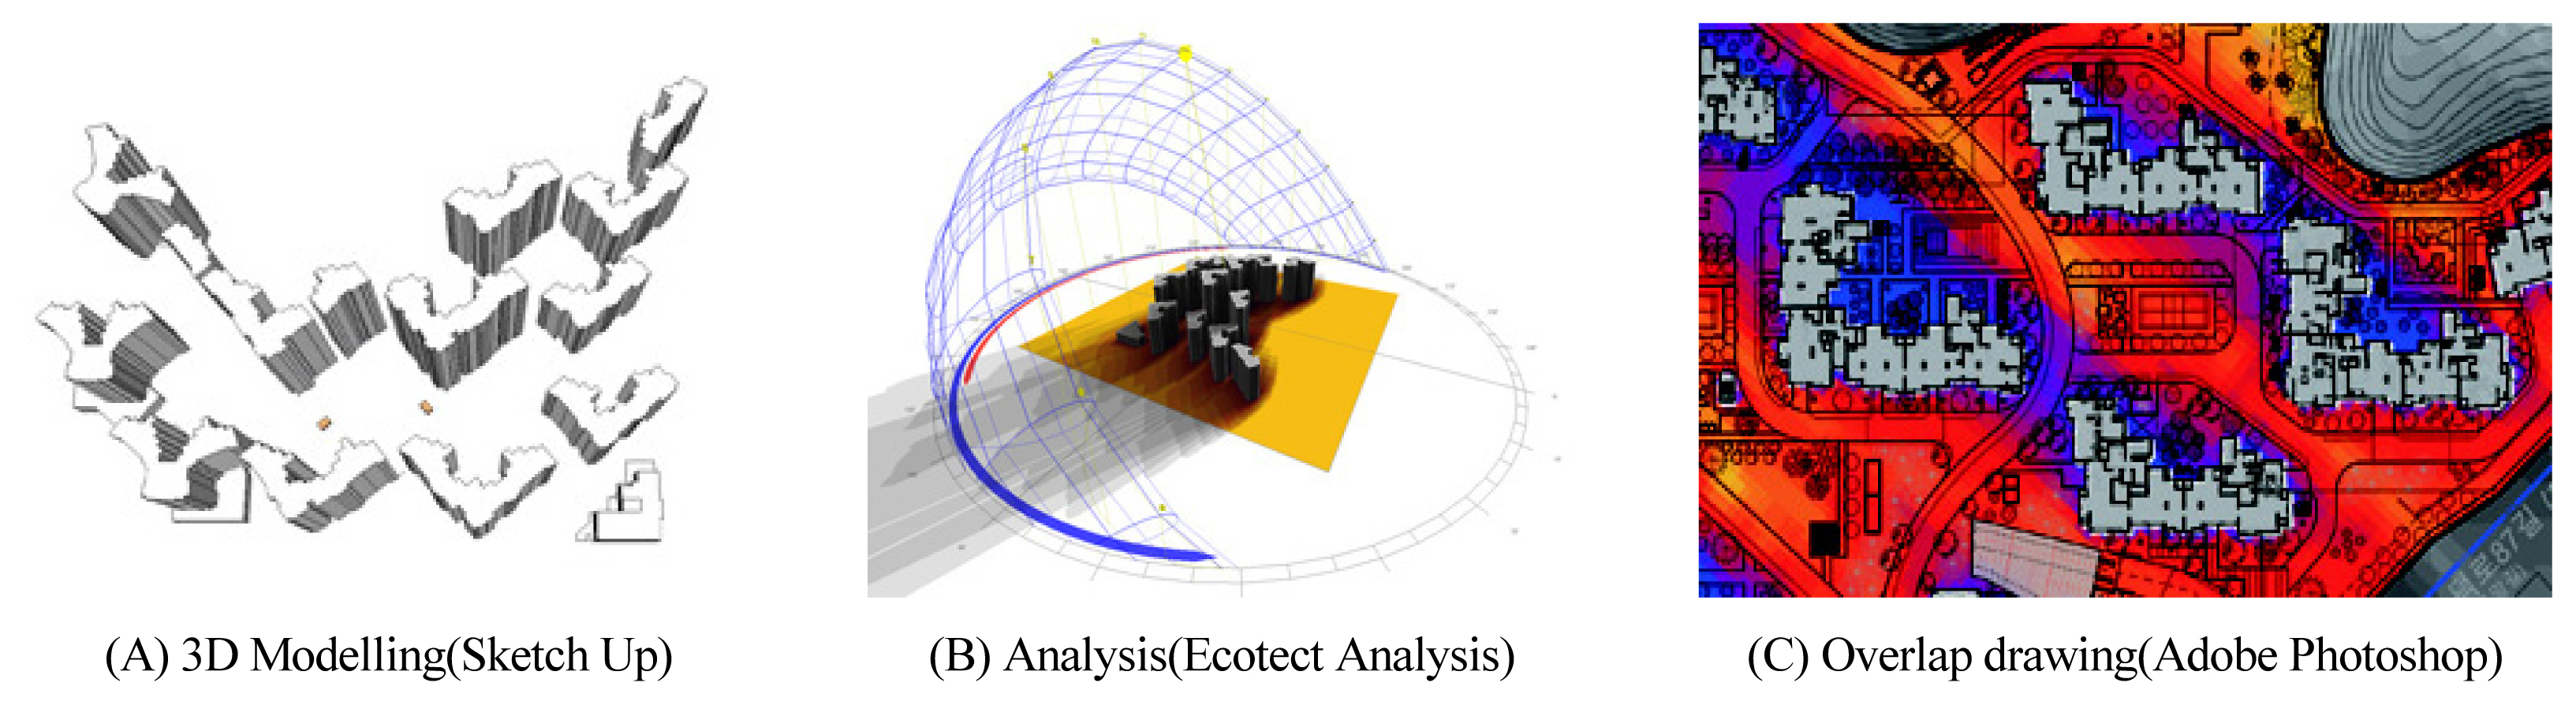
Methods of daylight simulation.
Tree survey
The data analyzed through daylight simulations were overlapped with the planting as-built drawings and the growth conditions of trees planted in permanently shaded areas were surveyed with persons in charge of planting. The first tree survey was conducted between November 18, 2019 and February 15, 2020 focusing on trees planted in permanently shaded areas and the growth and withering status of trees that could be identified with the naked eye were surveyed. The second tree survey was conducted between March 16, 2020 and March 30, 2020, and the conditions of all the trees planted in study sites including those planted in permanently shaded areas were surveyed. Those of which conditions could not be identified with the naked eye in study sites including permanently shaded areas were examined with JUNSMETER to check their tree vigor conditions. JUNSMETER is a stethoscope for trees used to diagnose the health of trees and the tree vigor conditions are measured in a non-destructive way by attaching two electrodes vertically to the bark of trees. To examine the survival status of trees according to the conditions of daylight, the conditions of trees were classified as good, bad or dead. According to the criteria for determining defects in landscape trees in apartment complexes (Ministry of Land, Infrastructure and Transport, 2016), trees of which less than 2/3 of the crown was withered were classified as bad, and trees of which 2/3 or more of the crown was withered were classified as dead. The tree vigor threshold of JUNSMETER was applied (Table 2, Fig. 2).

Criteria for assessment of tree condition
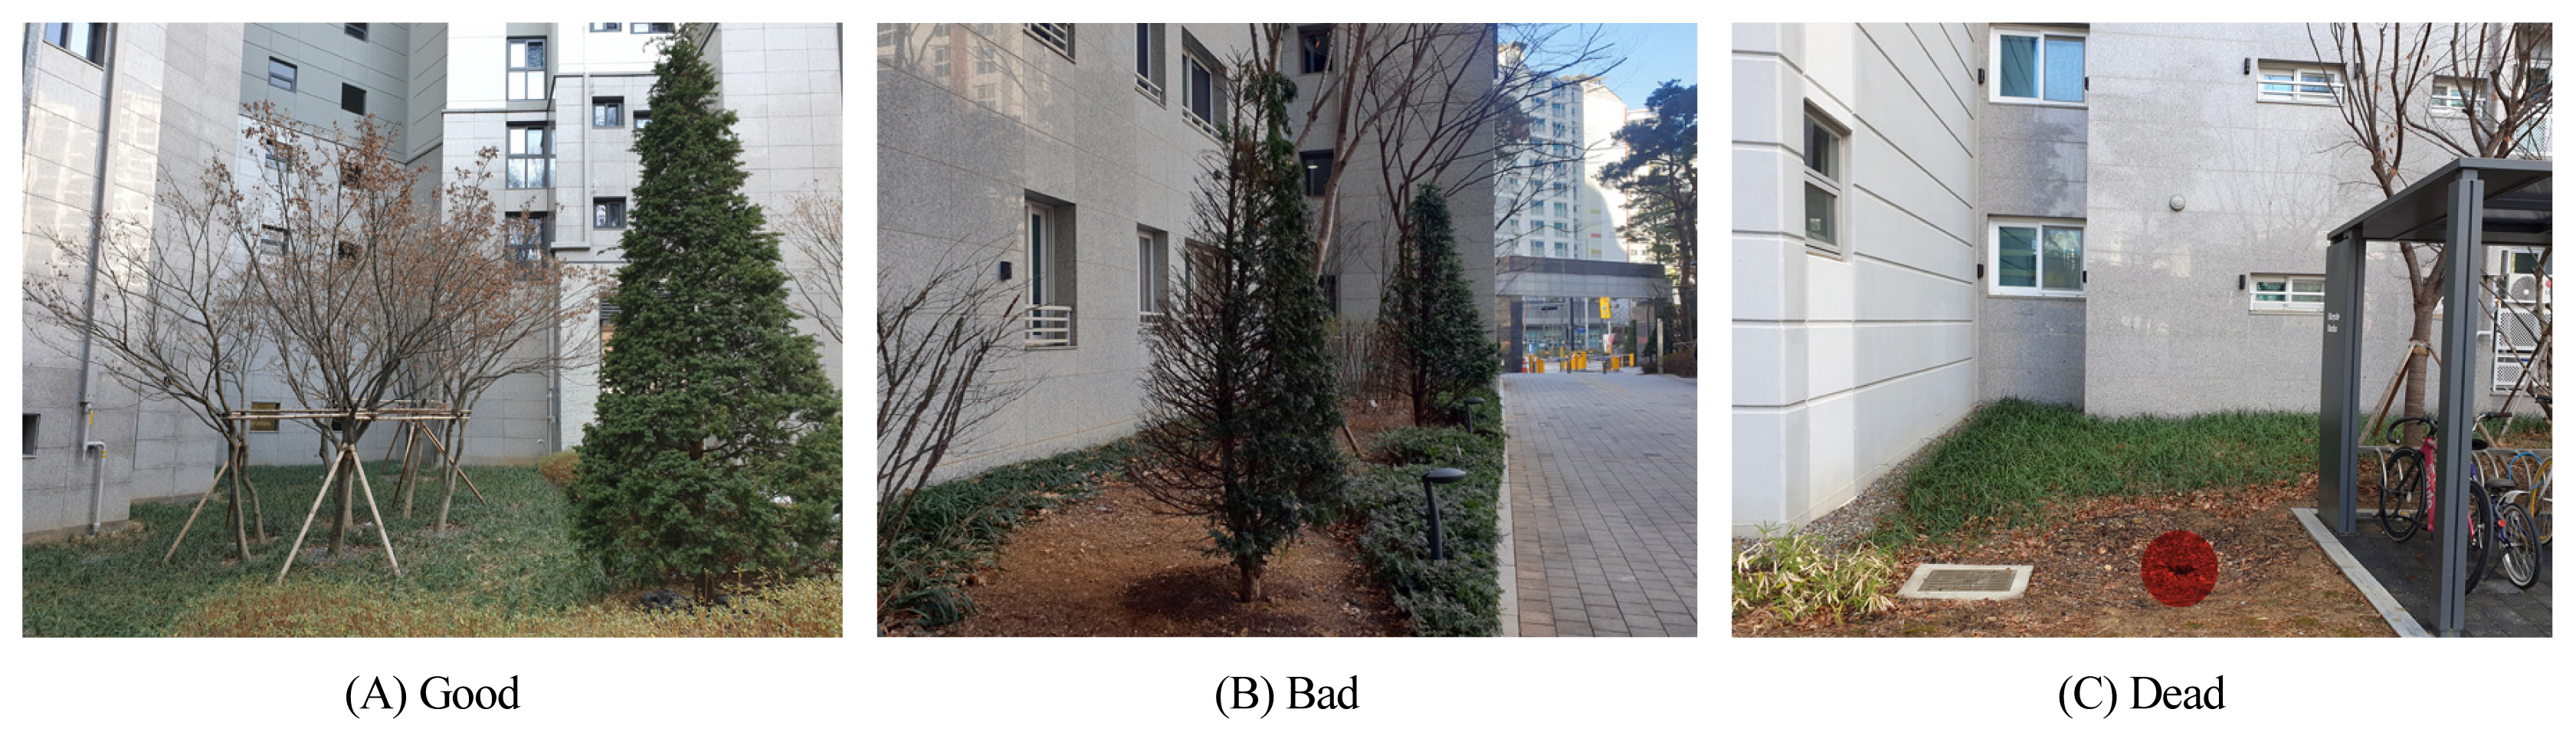
Reference images for assessment of tree condition.
Results and Discussion
Daylight simulations by study site
In this study, study sites were selected among apartment complexes where L-shaped buildings (flat + tower) that have been widely adopted recently were laid out repeatedly, and thus permanently shaded areas identified through simulations were also similar. As the shape of buildings was tilted at an angle of 45 degrees in a direction from the south to the southeast, each building does not affect the shadows of surrounding buildings in the morning when the sun rises in the east. As the sun crosses the meridian at noon, the altitude is high and thus the length of shadows is short. In the afternoon, shadows are created in the direction of the east and shadows are created in the outdoor spaces of each building (Kim and Kim, 2013).
The results of analysis showed that permanently shaded areas were mostly formed in the rear part of buildings that faced north. Permanently shaded areas were also found to be affected not by the height of buildings, but by the length of buildings. When the length of buildings increases due to a higher number of houses on the same floor and the length of the long side was similar to the length of the short side from the corner at the center of buildings, the area of permanently shaded areas was relatively wider. When the shape of buildings was identical, permanently shaded areas near those located within apartment complexes were wider than those located along the border of apartment complexes. As the front part of buildings faced southeast or southwest, at least 5 hours of daylight were secured a day, which was analyzed to be good for the growth of trees. However, the spaces are not suitable for planting trees due to the designated spaces for inflatable air cushions in emergency and restrictions on planting trees for the lighting of low-rise residents. The smaller the distance between buildings and the longer the length of buildings, the wider the area of permanently shaded areas. The percentage of permanently shaded areas in study sites was found to be 15.5%, 9.4%, 5.2% and 14.8% respectively (Fig. 3).

Study sites daylight simulation and overlap drawing.
Growth status of trees in permanently shaded areas in study sites
The image of study sites analyzed through daylight simulations was overlapped with their as-built drawing, and permanently shaded areas and green spaces of which daylight conditions were good were distinguished to survey and analyze the growth status of trees. Apart from daylight conditions, there are also other factors that affect the growth of trees such as climate change, the quality of trees, the time of planting, execution, planting foundation, management and process (Yoon et al., 2017). However, considering that the selected study sites were built by the same constructor, the conditions of planting and maintenance in each study site were assumed to be equal and under the assumption the growth status of trees planted in permanently shaded areas and green spaces of which daylight conditions were good were compared and analyzed. Kim (2018) surveyed the defect rate of landscape trees in parks and green spaces but targeted only the species of which 20 trees or more were planted in each site and of which defect rate was 5% or higher. In this study, however, considering that green spaces in apartment complexes were targeted, the defect rate of the species of which five trees or more were planted in each study site and of which defect rate was 5% or higher was compared and analyzed.
In Study Site-1, 646 trees of seven evergreen tall-tree species and 628 trees of 17 deciduous tall-tree species were planted, and 75 trees of four evergreen tall-tree species and 45 trees of 10 deciduous tall-tree species were planted in permanently shaded areas (Table 3). The defect rate of trees in the entire area of the study site was 14.7%, and the defect rate of evergreen tall-tree species and deciduous tall-tree species was 18.4% and 10.8% respectively, indicating that the defect rate of evergreen tall-tree species was higher than that of deciduous tall-tree species. When the study site was divided into permanently shaded areas and green spaces of which daylight conditions were good, American arborvitae and Thuja occidentalis showed a high defect rate in both areas, and in the case of Thuja occidentalis the growth status of the entire trees planted in the study site was found to be bad or dead. Taxus cuspidata, Zelkova serrata, Pseudocydonia sinensis, Cornus kousa, Chionanthus retusus and Chionanthus retusus showed a lower defect rate in permanently shaded areas than the green spaces of which daylight conditions were good.

Status of tree growth at Study Site-1
In Study Site-2, 2,072 trees of six evergreen tall-tree species and 2,605 trees of 20 deciduous tall-tree species were planted, and 24 trees of three evergreen tall-tree species and 217 trees of 12 deciduous tall-tree species were planted in permanently shaded areas (Table 4). The defect rate of trees in the entire area of the study site was 9.1%, and the defect rate of evergreen tall-tree species and deciduous tall-tree species was 9.8% and 8.6% respectively, indicating that the defect rate of evergreen tall-tree species was higher. When the study site was divided into permanently shaded areas and green spaces of which daylight conditions were good, Pinus densiflora showed a high defect rate in both areas. Taxus cuspidata, Zelkova serrata, Cornus kousa, Chionanthus retusus and Chionanthus retusus showed a lower defect rate in permanently shaded areas than the green spaces of which daylight conditions were good.

Status of tree growth at Study Site-2
In Study Site-3, 2,455 trees of five evergreen tall-tree species and 6,347 trees of 44 deciduous tall-tree species were planted, and 17 trees of four evergreen tall-tree species and 177 trees of 11 deciduous tall-tree species were planted in permanently shaded areas (Table 5). The defect rate of trees in the entire area of the study site was 6.2%, and the defect rate of evergreen tall-tree species and deciduous tall-tree species was 9.8% and 4.8% respectively, indicating that the defect rate of evergreen tall-tree species was higher. Taxus cuspidata, Cercidiphyllum japonicum, Zelkova serrata, Styrax japonicus, Liriodendron tulipifera, Cornus kousa, Cornus officinalis, Prunus armeniaca, Chionanthus retusus, Prunus cerasifera var. atropurpurea and Chionanthus retusus showed a lower defect rate in permanently shaded areas than the green spaces of which daylight conditions were good.

Status of tree growth at Study Site-3
In Study Site-4, 395 trees of four evergreen tall-tree species and 869 trees of 20 deciduous tall-tree species were planted, and 32 trees of two evergreen tall-tree species and 141 trees of nine deciduous tall-tree species were planted in permanently shaded areas (Table 6). The defect rate of trees in the entire area of the study site was 0.6%, and the defect rate of evergreen tall-tree species and deciduous tall-tree species was 1.3% and 0.3% respectively, indicating that the defect rate of evergreen tall-tree species was higher. Taxus cuspidata showed a lower defect rate in permanently shaded areas than the green spaces of which daylight conditions were good. Since the construction of this study site was completed 6 months ago, it will be necessary to additionally survey and analyze the status 1 year and 2 years after the completion.

Status of tree growth at Study Site-4
The defect rate of Study Site-1 was highest, followed by Study Site-2, Study Site-3 and Study Site-4, and the order of the defect rate of trees in permanently shaded areas was the same. The overall defect rate of study sites tended to increase over time after completion and the defect rate of trees in permanently shaded areas also increased. The recently released tree damage rate in apartment complexes in the central part of Korea where the study sites were located was 8.4% in the case of evergreen tall-tree species and 13.5% in the case of deciduous tall-tree species (Yoon et al., 2017). The defect rate of trees planted in permanently shaded areas in Study Sites 1–3 was higher than the recently released tree damage rate, and the defect rate of trees planted in green spaces of which daylight conditions were good was lower than that in every study site, except evergreen tall-tree species in Study Site-1 (Table 7). The defect rate of evergreen tall-tree species in each study site was analyzed to be higher than that of deciduous tall-tree species. By tree species, American arborvitae and Thuja occidentalis among evergreen tall-tree species showed a high defect rate both in permanently shaded areas and green spaces of which daylight conditions were good, and Taxus cuspidata showed a lower defect rate in permanently shaded areas than green spaces of which daylight conditions were good. Among deciduous tall-tree species, Cornus kousa, Zelkova serrata, Chionanthus retusus and Chionanthus retusus showed a lower defect rate in permanently shaded areas, and Cercidiphyllum japonicum, Sorbus commixta, Liriodendron tulipifera, Cornus officinalis and Cornus officinalis also showed a lower defect rate in some sites (Table 8).

The status of tree defects by site

The status of tree defects by tree
Conclusion
This study aimed to compare and analyze the growth status of trees in outdoor spaces of apartment complexes according to the conditions of daylight, and to identify species that can be utilized in planting design and execution in permanently shaded areas. To do so, daylight simulations were performed on recently constructed apartment complexes to analyze the conditions of daylight, and the defect rate of trees planted in permanently shaded areas and those planted in green spaces of which daylight conditions were good were compared through time series analysis.
To examine the ratio of shadows by hour and the environment of daylight according to the location of the sun from sunrise to sunset in study sites, simulations were conducted utilizing Solar Access Analysis of Ecotect Analysis. The results of analysis showed that permanently shaded areas were formed in the rear part of buildings that faced north. Permanently shaded areas were also found to be affected not by the height of buildings, but by the length of buildings. When the length of buildings increases due to a higher number of houses on the same floor and the length of the long side was similar to the length of the short side from the corner at the center of buildings, the area of permanently shaded areas was relatively wider. When the shape of buildings was identical, permanently shaded areas near those located within apartment complexes were wider than those located along the border of apartment complexes.
The image of study sites analyzed through daylight simulations was overlapped with their as-built drawing, and permanently shaded areas and green spaces of which daylight conditions were good were distinguished to survey the growth status of trees. The first tree survey was conducted between November 18, 2019 and February 15, 2020 focusing on trees planted in permanently shaded areas and the growth and withering status of trees that could be identified with the naked eye were surveyed. The second tree survey was conducted between March 16, 2020 and March 30, 2020, and the conditions of all the trees planted in study sites including those planted in permanently shaded areas were surveyed. Considering that the selected study sites were built by the same constructor, their physical conditions and management such as standards of landscape soil and drainage facilities were equal, and thus the growth conditions of trees planted within study sites were also assumed to be equal. Under the assumption, the growth status of trees planted in permanently shaded areas and green spaces of which daylight conditions were good was compared and analyzed. The defect rate of Study Site-1 was highest, followed by Study Site-2, Study Site-3 and Study Site-4, and the order of the defect rate of trees in permanently shaded areas was the same. The overall defect rate in study sites tended to gradually increase over time after completion and the defect rate in permanently shaded areas also increased. Among the trees planted in permanently shaded areas, evergreen tall-tree species that are categorized as shade intolerant trees including Pinus densiflora, American arborvitae and Thuja occidentalis showed a higher defect rate over time, and species that are categorized as shade tolerant trees and shade moderate trees including Taxus cuspidata, Zelkova serrata, Cornus kousa, Chionanthus retusus and Chionanthus retusus showed the good growth status and a low defect rate, which indicates that they can be utilized in designing planting for permanently shaded areas in apartment complexes. Sorbus commixta and Cornus officinalis can be also utilized although they were excluded from analysis due to their small number of samples. The daylight simulation technique utilized in this study to analyze permanently shaded areas can be used as an analysis tool at the stages of design and execution considering the environment of daylight.
This study distinguished green spaces in the outdoor spaces of apartment complexes based on daylight conditions, analyzed the defect rate of trees planted in permanently shaded areas and thus suggested specific species of trees that are applicable to permanently shaded areas, which differentiates this study from earlier studies, but there are still some limitations. First, as this study utilized the data of one constructor for collecting accurate as-built drawings and quantity data, the number of samples was small. Second, this study focused on tall trees planted in permanently shaded areas, and thus it will be necessary to conduct follow-up studies on shrubs and ground-cover flowering plants. Defects in trees are affected by daylight conditions but they are also caused by the combination of multiple factors that give stress to trees such as climate change, the selection of unsuitable trees, poor planting foundation, poor construction management, and poor maintenance. Therefore, it will be necessary to conduct additional studies on the growth of trees according to the conditions of daylight through data accumulation and monitoring by managing the records of trees that can occur in the process of planting and maintaining trees across the entire life cycle of trees.