


Introduction
We live in a unique era of global climate change, and global warming is one of our key challenges (Nordhaus, 2013). Many countries worldwide have made long-term and systematic efforts to respond to climate change, including initiatives to reduce emissions from deforestation and forest degradation (REDD+). REDD+ is a cost-effective mechanism that enables developing countries to reduce their annual carbon emissions by around 30% and supports the development of local communities by preventing forest conversion and degradation (Stern, 2007). Furthermore, through forest conservation, REDD+ enables sustainable forest management and the enhancement of forest carbon stocks (UNFCCC, 2010). Despite the efforts of multinational organizations and nations to implement and expand REDD+ projects, global forest areas are still shrinking (from 31.62% in 1990 to 30.71% in 2016) (Word Bank, 2020). To that end, researchers have explored the factors that influence the effectiveness of REDD+ projects. Recent suggestions include developing an inclusive approach that considers social elements, such as local development and poverty alleviation, to better achieve REDD+ goals (Angelsen, 2009).
A broad range of research has generalized the correlation between social elements and forest changes. For example, the environmental Kuznets curve (EKC) is an inverted U-shaped curve that is used to represent a hypothesized relationship between environmental changes and economic variables such as income (Dasgupta, 2002; Grossman and Krueger, 1995; Stern and Common, 2001). The EKC suggests that economic development initially leads to environmental deterioration; however, after achieving a certain level of economic growth, societies begin to improve their relationship with the environment, reducing emissions and thus environmental degradation. This implies that the effectiveness of forest conservation and restoration may vary depending on the extent to which REDD+ projects contribute to reducing poverty among local residents who are highly dependent on forests.
Various criteria and factors have been considered when explaining the effectiveness of REDD+ projects. The key criteria can be summarized as “3E+”: climate effectiveness, cost efficiency, and social equity, plus social-environmental benefit sharing (Angelsen, 2009). REDD+ experts stress that the equitable sharing of social benefits (e.g., job opportunities, ensuring better livelihoods, and establishing land tenures) can enhance forest governance and cooperation among residents (Visseren-Hamakers et al., 2012). Local communities are instrumental in implementing forest activities, including planning and decision making (Ojha et al., 2009), as they represent effective stakeholders in sustainable forest management and conservation.
Accurately measuring the effect of social factors (e.g., community engagement, social norms, and resident collaboration) on REDD+ projects is a difficult task, as social factors are broad concepts and there are little quantified data on cultures in societies. However, we can explain the effects of social factors on community development through the concept of social capital. Although its definition varies among scholars, social capital is generally known as an intangible capital. It has the characteristics of public goods formed by relationships (networks), such as trust and cooperation, which promote cooperation among economic actors and reduce transaction costs to facilitate economic activities, while creating positive externality within a community (Jeong and Kim, 2019). Zak and Knack (2001) have reported that rich social capital not only reduces social costs but also improves economic indicators, including gross domestic product (GDP). Social capital has attracted attention as an important factor in achieving national competitiveness, social stability, and personal well-being.
Various studies have provided evidence of the effects of social capital. Efforts have been made to determine the importance of social capital in regional development by measuring it in developing countries such as Uganda, Indonesia, Bolivia, and Pakistan (Ahmad and Sadaqat, 2016; Grootaert and van Bastelaer, 2002; Lee et al., 2017; Narayan and Pritchett, 2000). Despite the growing awareness on the subject, few studies in the field of forest cooperation, including REDD+ programs, have systematically measured social capital.
To achieve effective REDD+ goals, we must not only support traditional forestry activities, but should also consider social factors that are essential to community development, such as economic growth, fairness, contribution to social stability, and distribution of benefits. Past REDD+ programs considered social factors as secondary (USAID, 2010). Furthermore, there has been virtually no research on REDD+ programs to quantify the social capital of Myanmar, although the region has a high rate of forest conversion and degradation, as well as great potential to reduce carbon emissions.
The objective of this study is to develop a model that measures social capital while considering the mechanism of forest conservation activities in Myanmar’s community, and to analyze the effects of social capital on REDD+ programs. Specifically, it examines social capital’s influence on poverty among residents and measures social capital to clarify its importance. This study demonstrates the need to consider social capital while establishing strategies and plans for REDD+ programs, and presents methods to estimate the effect of social capital on poverty.
Research Methods
Research area and data collection
Myanmar has a land area of 676,577 square kilometers—three times that of the Korean Peninsula. Forest areas account for 45% (30.4 million ha) of the land area (MacDicken, 2015). Myanmar has abundant natural resources; it holds approximately 80% of the world’s teak reserves (NIFOS, 2015). However, forest areas in Myanmar are in rapid decline. Between 2010 and 2015, Myanmar lost 2.7 million ha of its forest areas, representing the third highest pace of annual net forest area reduction worldwide (MacDicken, 2015). In addition, the forest cover rate of Myanmar decreased from about 60% in 1990 to 45% in 2015. As a result of such changes in land use and its forestry sectors, Myanmar has become the world’s fourth largest greenhouse gas emitter, following Indonesia, Brazil, and Malaysia (NIFOS, 2015). Deforestation in Myanmar is progressing rapidly. Therefore, the country can greatly benefit from the implementation of REDD+ programs to reduce greenhouse gas emissions. Having recognized Myanmar’s REDD+ potential since 2014, the Korea Forest Service (KFS) is currently conducting a pilot project.
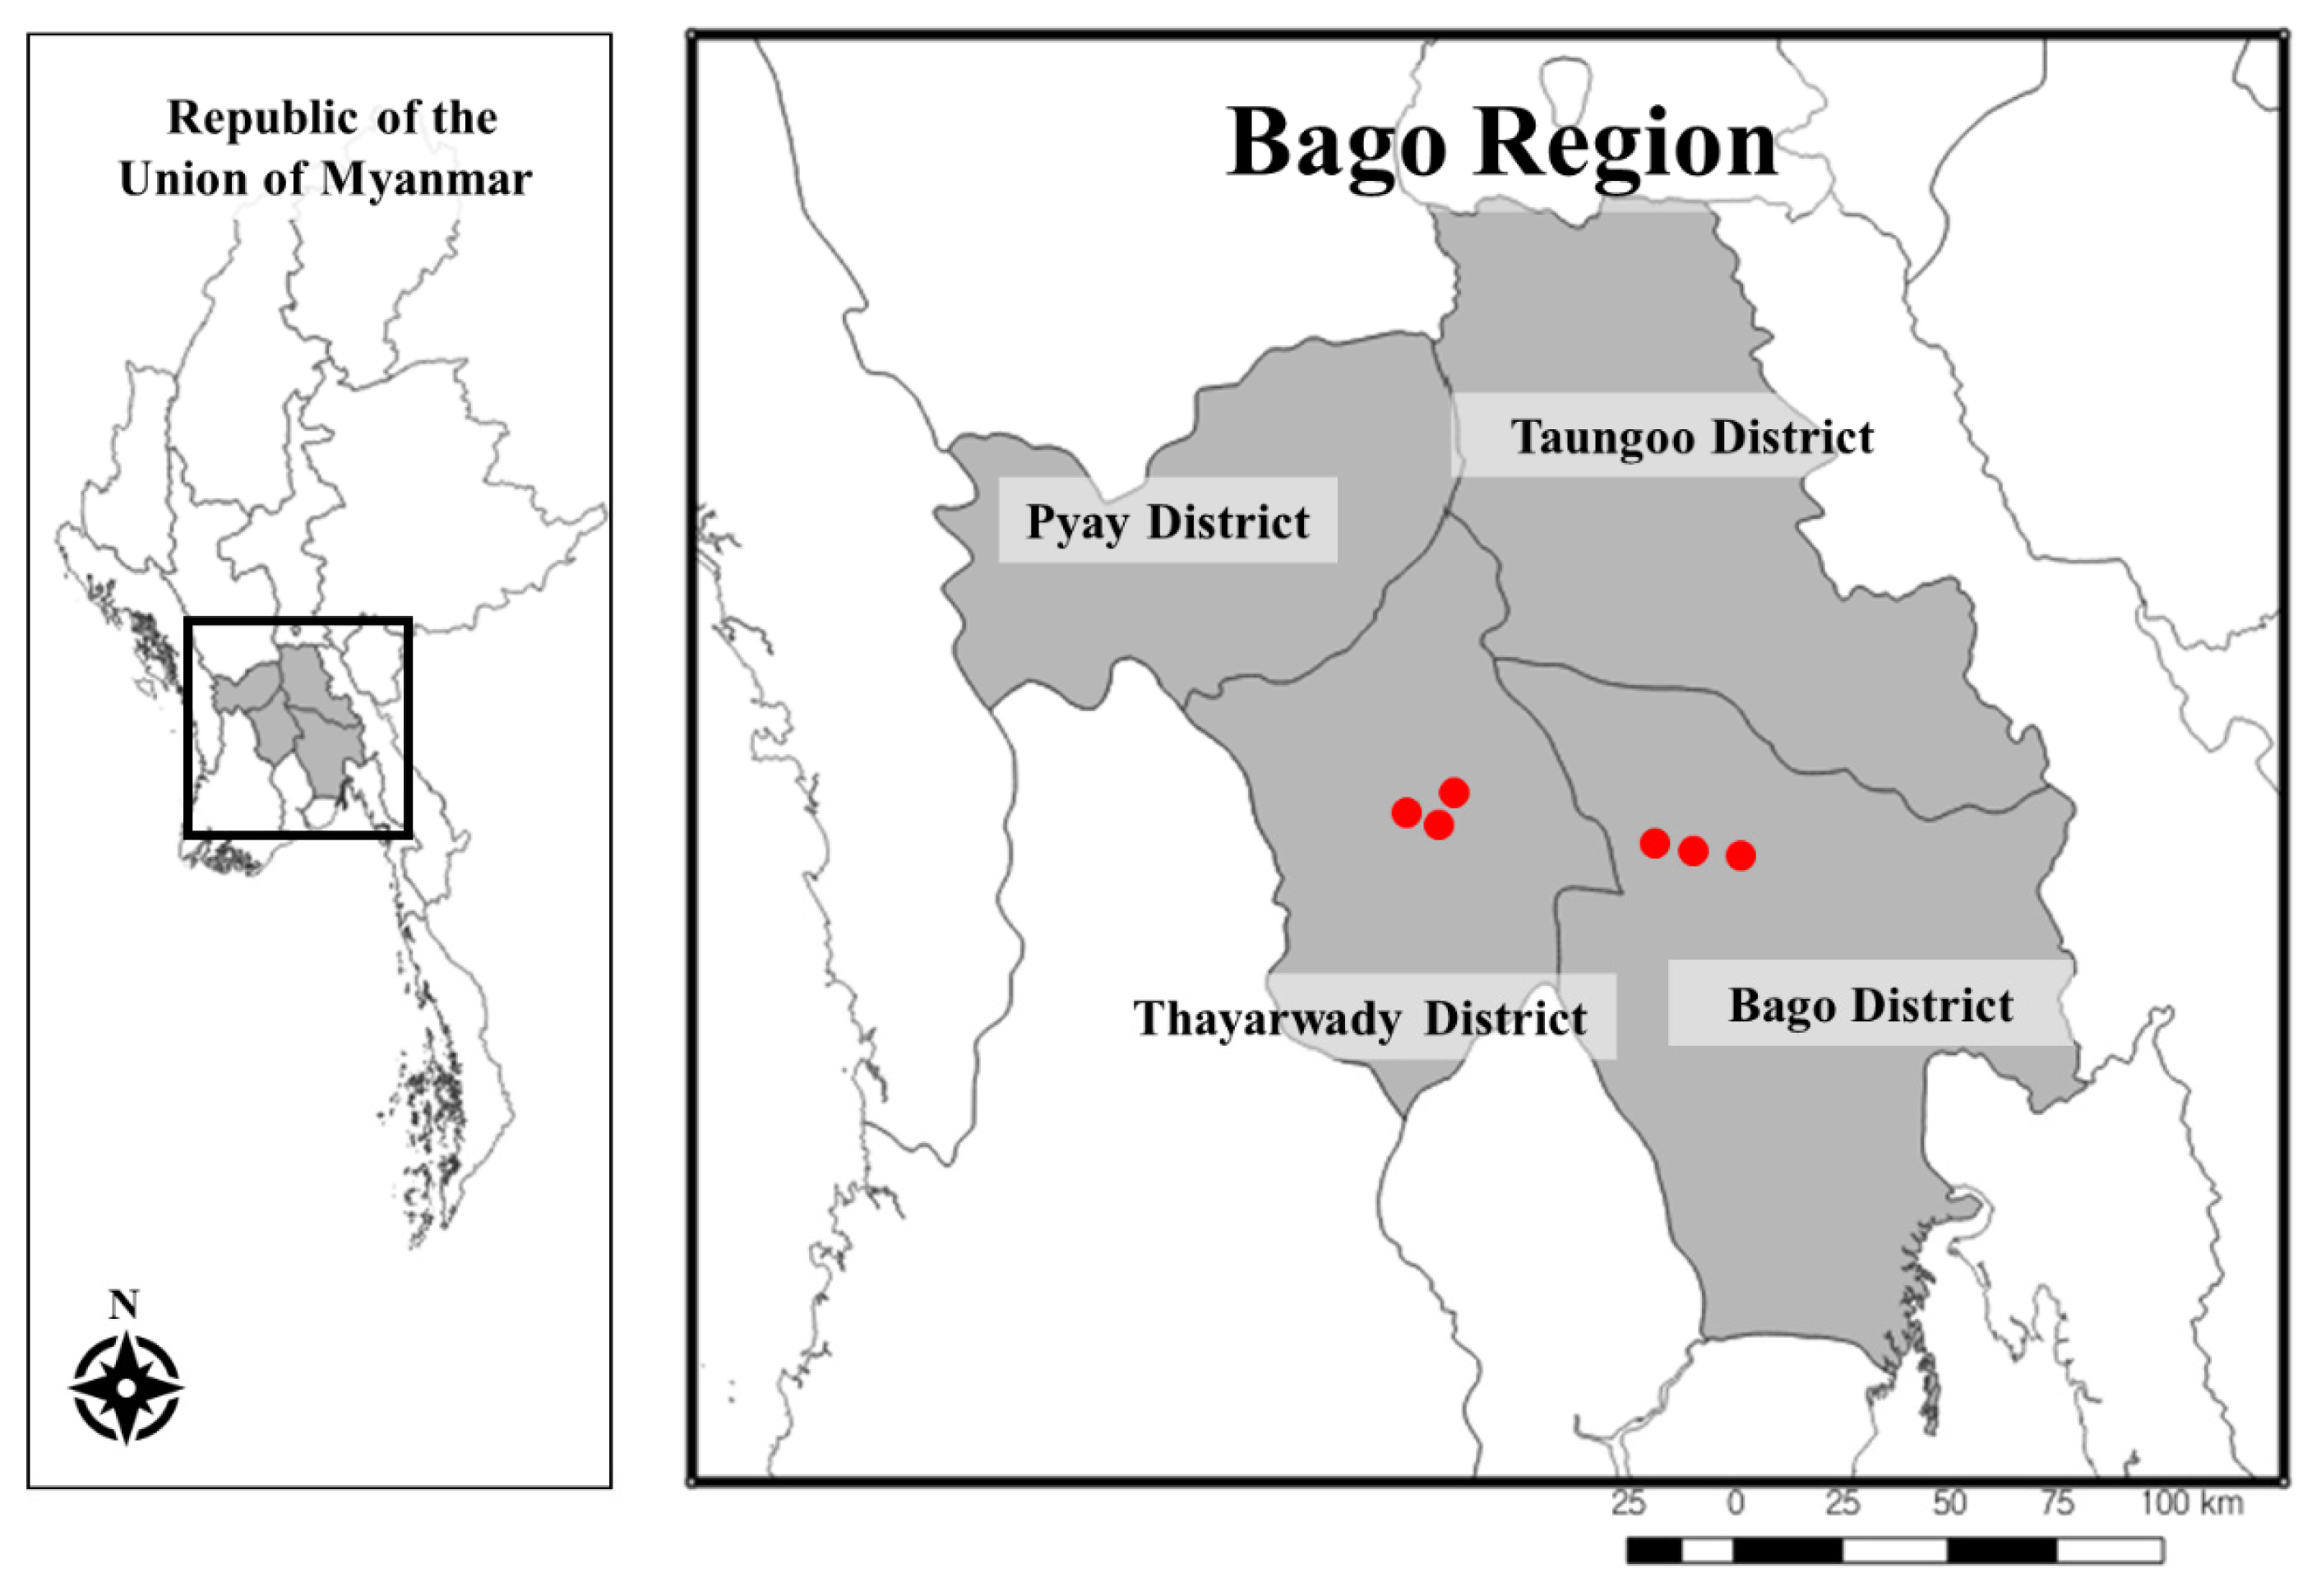
The research area of this study comprises the six villages (8-mile, 12-mile, 19-mile, Ban bwey gon, Hiyu, Aung san myein; Fig. 1) in which the KFS REDD+ programs have been running with community forestry. Community forestry carries out local, resident-led forest activities, including afforestation and forest restoration, small-scale timber harvesting, compost production, forestry processing, and job creation through forestry in the Bago region, Myanmar. For this study, trained social investigators collected data through an interview-based survey conducted on randomly selected household members aged 19 years and older. The survey period covered 10 days, from July 24 to August 2, 2020. The total number of final respondents was 335, once missing data and outliers were excluded.
General characteristics of the respondents
A total of 335 households (HH) participated in the study, comprising 159 HH (47%) that were under the poverty line and 176 HH (52%) that were above the poverty line. They resided in 8-mile (20, 6%), 12-mile (36, 10%), 19-mile (20, 6%), Ban bwey gon (121, 36%), Hiyu (91, 27%), and Aung san myein (47, 14%). The majority were from Burma (288, 85%), and Buddhism was the most prominent religion (294, 87.8%). Regarding the level of education, 36 respondents were illiterate (36, 10%).
The majority of HH visited the forest to collect firewood (262, 78%), 208 HH (62%) had experienced REDD+ training, 193 HH (57%) benefited from REDD+ cookstove incentives, and a few participants had joined the community forestry (21 HH, 6%), while 314 HH (93%) had not joined (Table 1).
Composition of variables
The explanatory variables used in this study consisted of social capital socioeconomic characteristics and forest conservation activities. Social capital is a multidimensional and pluralistic, complex entity (So, 2004), and is difficult to measure. The World Bank has developed the Integrated Questionnaire for the Measurement of Social Capital (SC-IQ) to measure the multilateral aspects of social capital (Grootaert and Narayan, 2004; Grootaert and van Bastelaer, 2002). The SC-IQ model is a useful survey tool for the microscopic analysis of social capital, targeting individuals or households in the community; furthermore, it is theoretically robust, and has been implemented in several cases across various countries (Ahmad and Sadaqat, 2016; Diawara et al., 2013; Grootaert, 1999; Narayan-Parker and Pritchett, 1997).
In this study, the four social capital variables comprised network, trust, cooperation, and social inclusion, based on the SC-IQ model (Grootaert and Narayan, 2004). Network was measured by the number of organizations the respondents belonged to, and the frequency with which they participated in activities across these organizations. Trust was measured as the levels of trust in other people and among neighbors. Cooperation was measured by experiences in collective activities and the cooperative attitude of neighbors. Social inclusion was measured by perceptions of feeling safe from crime in villages and perceived feeling of happiness in general. These four social capital indicators were synthesized to measure the total level of social capital. Socioeconomic characteristics were measured by the duration of residence in the village, the number of members in a given HH, and the education background of the HH leader. Forest activities were measured by membership in community forestry, the frequency with which they visited forests, and REDD+ training experiences. A REDD+ incentive dummy variable was set based on participant experiences (Table 2).
The dependent variable was set by the household’s level of poverty, as represented by household consumption levels, especially considering the challenge of accurately measuring income levels by household (Ahmad and Sadaqat, 2016; Grootaert, 1999). The average GDP per capita in Myanmar was 1,571 USD in 2019. In this study, households with a daily income below 1.08 USD (1,590 kyat) were categorized as “poor” (Word Bank, 2019).
Data analysis and measurement
When measuring a composite index, the variables comprising the index, which are measured in different units, need to be normalized (Jeong and Kim, 2019). Prior to measurement, we normalized the variables to resolve inconsistencies in the units of measurement and set values between 0 and 1.
An exploratory factor analysis was conducted to verify our model. We used principal component analysis to extract constituent factors, and Varimax to simplify factor loading. The eigenvalue was over 1.0, and the factor loading was over 0.60 (Babbie, 2015). Some measured variables were eliminated through the scale purification process. Table 3 shows the results of the social capital factor analysis. The total variance explained was 71.14%, and social capital was extracted from four factors: network, trust, cooperation, and social inclusion. We conducted a reliability analysis through sub-factors to examine the precision of the measurement tool, and Cronbach’s alpha (α) to measure reliability. In general, a Cronbach’s alpha score of 0.4–0.6 is fair, 0.6–0.75 is acceptable, and 0.75–1.00 is excellent (Rosner, 2015).
Correlation and regression analyses utilized the logit model to verify the correlation between poverty and the explanatory variables. Using the binary logit model, we developed an equation (Equation 1) where the dependent variable, poverty, was determined based on whether the household was poor or not (an indicator of consumption level) (Ahmad and Sadaqat, 2016; Grootaert, 1999).
Where:
Results and Discussion
Social capital based on general social characteristics
This section presents the results of the social capital analysis, as based on socioeconomic characteristics such as area of residence, educational background, forest activities, and poverty status (Table 3). Educational background did not have a significant effect on the difference in social capital; social capital was fairly distributed relative to level of education, a result consistent with previous studies (Grootaert, 1999). Poor households (.640) were found to have lower social capital than non-poor households (.681). This result is in line with the existing theory that the higher the social capital level, the higher the living standard and overall social stability, confirming a significantly positive relationship between social capital and household income levels (Zak and Knack, 2001).
REDD+ training had a significant effect on the difference in social capital, and respondents who had experienced REDD+ training (.693) were more likely to have higher social capital than non-experienced respondents (.608). However, the REDD+ incentive experience (cookstove) did not have a significant effect on the difference in social capital. Community forestry members (.787) were found to have higher levels of social capital than non-community forestry members (.651). This means that social ties or norms formed by organizational activities in the region led to the establishment of networks and trust within the group and enhanced social capital levels (Lee et al., 2017; Pretty, 2003).
The results show that one’s socioeconomic background, such as education level or period of residence, had limited effects on the variance in social capital. However, forest activities showed a potential for accumulating social capital through REDD+ training and community forestry activities. This result implies that there is greater potential for effective forest cooperation activities, which may lead to higher social capital. The empirical results confirm the existing theory that regions with community forestry organizations are more likely to achieve REDD+ objectives than REDD+ areas without community forestry organizations (USAID, 2010).
Social capital and poverty
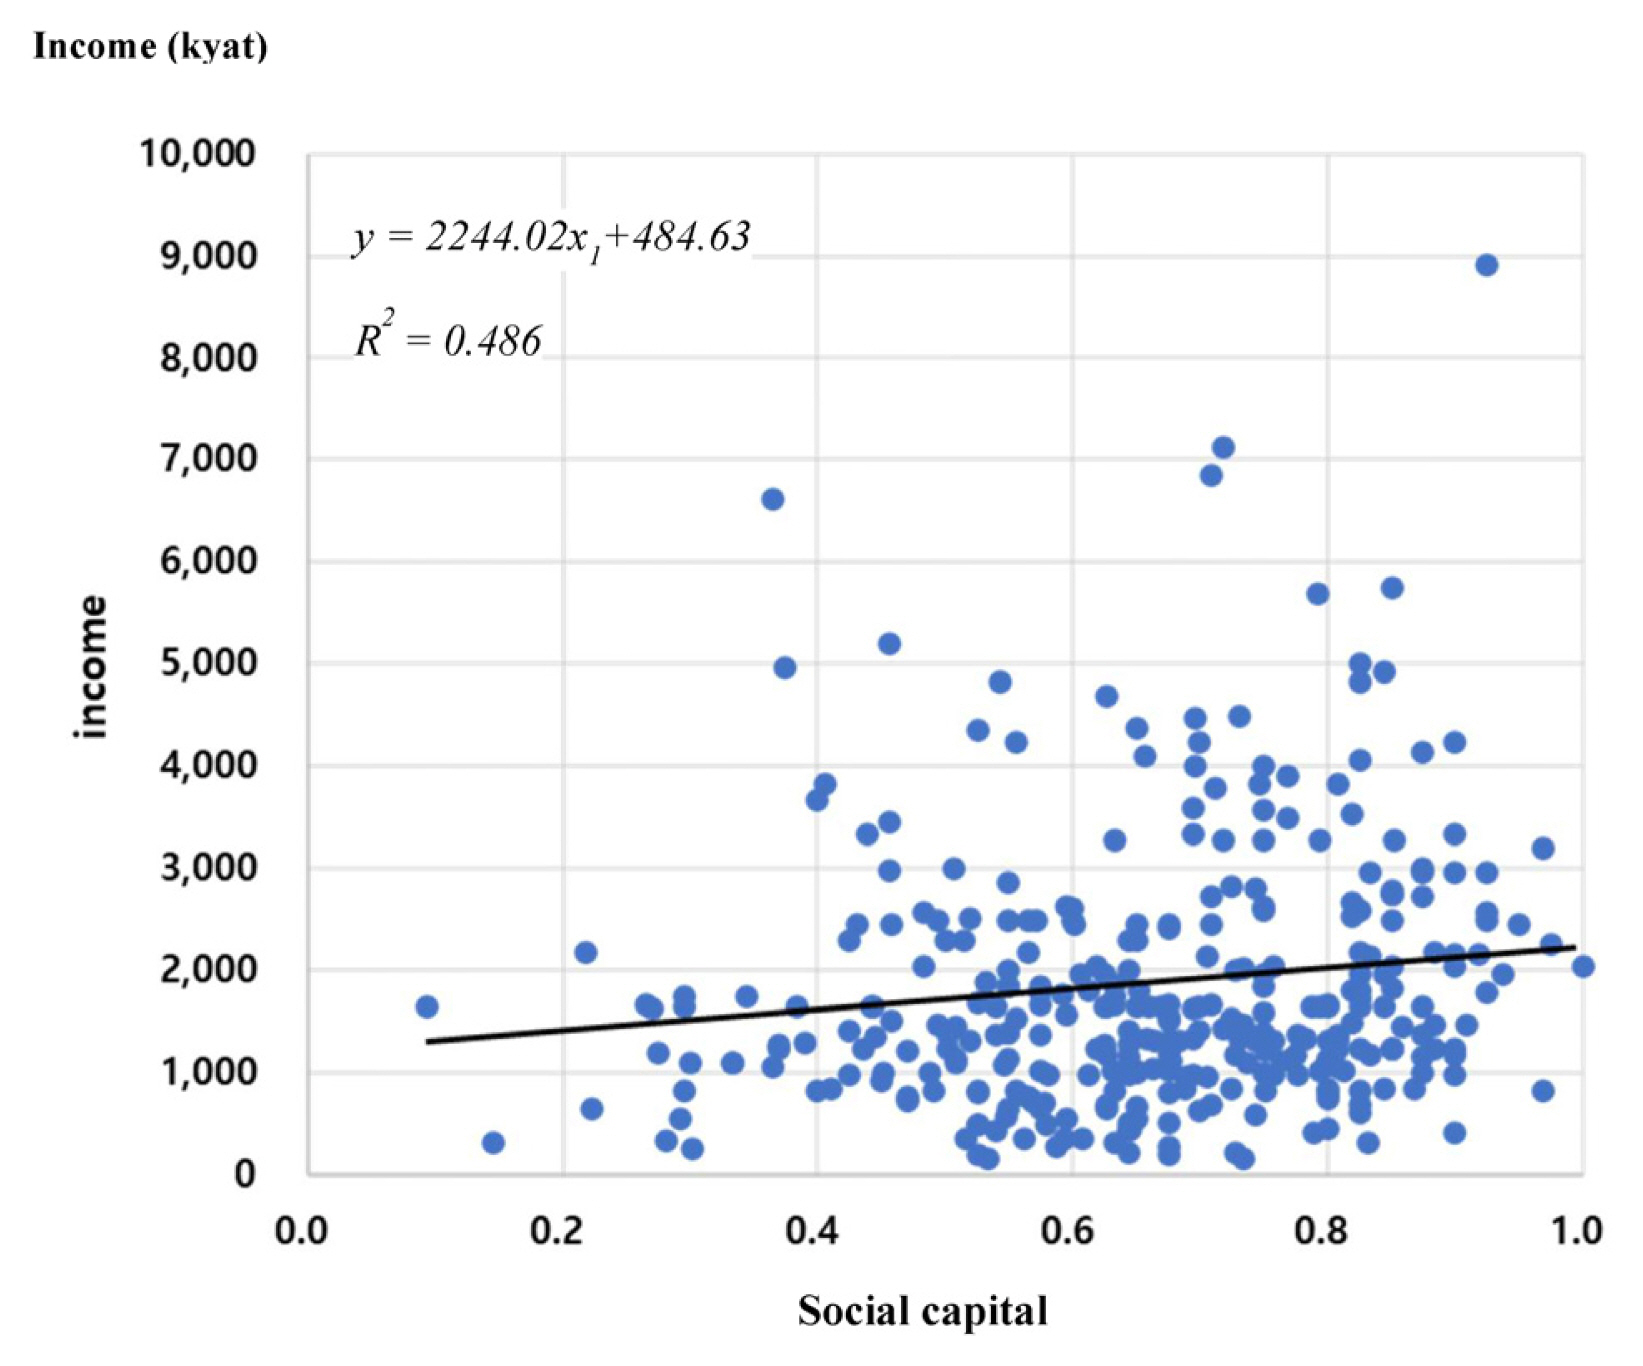
Social capital contributes to the overall productivity of the economy by reducing transaction costs (Jeong and Kim, 2019; Knack and Keefer, 1997; Putnam, 2000; Zak and Knack, 2001). Higher levels of social capital lead to lower transaction costs and result in a more competitive nation. Furthermore, with greater social capital, countries can achieve higher standards of living and social stability. Based on these hypotheses, we examined the relationships between social capital, household characteristics, forest activities, and income per capita to identify the influence of social capital on economic activities.
Fig. 2 shows scatterplots of the correlation between social capital and income (Pearson’s coefficient: 0.221). The correlation analysis results confirmed that social capital has a significant relationship with economic activities within a 1% significance level. We expected a bidirectional correlation between the variables; due to its inherent nature, the estimated correlation would be strictly limited to the magnitude of the correlation between the dependent and explanatory variables. Nevertheless, this result shows the positive correlation between social capital and per capital income.
We conducted a regression analysis using the logit model to derive social capital’s influence on poverty. The results show that social capital affects poverty reduction, as demonstrated in previous studies (Ahmad and Sadaqat, 2016) (Table 4). Social capital exhibited a statistically significant negative relationship with poverty; the analysis on the marginal effects of social capital revealed that an increase in social capital affects poverty reduction. This indicates that those who participate in community activities and have more neighbors that they can rely on are less likely to be poor.
The results show that education level and duration of residence affected reductions in poverty, as demonstrated in previous studies (Lee et al., 2017). The number of house-hold members was significantly and positively associated with poverty. A positive relationship between the number of household members and poverty is common in developing countries, as noted in previous studies (Grootaert, 1999).
Forest dependency and poverty showed a statistically significant positive relationship and the marginal effects analysis revealed that an increase in the number of visits to the forest is associated with poverty. These results indicate that socially marginalized poor people, with no means of income (such as from agriculture), or without any agricultural land in Myanmar, are more likely to visit forests to collect firewood and non-timber forest products. Collecting forest products has limited effects on generating income and contributes to maintaining people’s livelihood just above subsistence levels.
In contrast with the results of the correlation analysis, the effect of REDD+ training, REDD+ incentives, and community forestry membership on poverty did not yield a statistically significant relationship (Table 5). This implies that REDD+ activities and community forestry activities have an impact on income generation; however, these effects are limited, and are not enough to result in poverty reduction. REDD+ training should pay greater attention to improving the value of local forest products and to providing income-generating opportunities given the poverty level of those dependent on forest. Furthermore, community forestry policies could be expanded to include poverty alleviation policies, beyond its community-driven forest management function in Myanmar.
Conclusion
This study quantitatively estimated the impact of social capital on poverty levels of local residents. In particular, it clarified the importance of social capital in achieving REDD+ objectives, presented a method for estimating the effects of social capital on poverty, and demonstrated the need to consider social capital when establishing strategies and plans for REDD+ programs. To this end, the study developed a tool to measure social capital, considering forest conservation activities, based on the World Bank’s SC-IQ model. It also quantitatively analyzed the impact of social capital on poverty levels in 6 villages running REDD+ programs in Myanmar.
The study revealed that social capital has a significant effect on poverty reduction. As such, investment in social capital can help to alleviate poverty. REDD+ trained participants and community forestry members showed a relatively higher level of social capital than those who did not participate. Furthermore, we found a positive correlation between income level and social capital. The logistic regression analysis revealed that increasing social capital has a significant influence on poverty reduction. In particular, those dependent on forests were statistically significantly more likely to live in poverty. This implies that socially marginalized residents rely more on forests and on collecting forest products, which has limited effects on overcoming poverty. REDD+ training should pay greater attention to increasing the value of local forest products and to providing income-generating opportunities. The community forestry in Myanmar has potential to operate as a safeguard in REDD+, ensuring the tenure of forest regions and embracing marginalized groups.
This study is the first to quantify social capital in Myanmar. Most previous studies have emphasized the importance of considering social capital in establishing effective REDD+ strategies through qualitative analysis. However, few have discussed translating these strategies into actions. Studies that estimate social capital in association with REDD+ projects are rare. Furthermore, no research has been conducted on REDD+ programs to quantify the relationship between social capital and poverty in Myanmar. Based on our findings, accumulating social capital is crucial, and forest-related organizations in the community must be revitalized and considered when selecting REDD+ areas. Furthermore, guidelines for monitoring social capital and developing social capital indices must be urgently developed in order to utilize the full potential of social capital.
This study identified the relationship between social capital, socioeconomic characteristics, economic levels, and poverty. However, it is difficult to evaluate the causal relationship between variables, and the possibility of reverse causality cannot be ruled out. Furthermore, this study does not include some sociocultural and environmental factors associated with REDD+ programs. Future studies must supplement the factors or variables that were not considered or measured in this study due to data limitations. In addition, in this study, the variable of social capital consists of four detailed components, including networks, trust, cooperation, and social inclusion, each of which is expected to hold different levels of importance. These levels of importance remain unexplored, and should be investigated in future studies. As these four factors have been integrated into one variable, weighting factors could be considered as one option when developing a regression model of social capital.