


Introduction
Recent markets have entered into an unpredictable competition due to rapidly changing environments and new trends. The emergence of smart devices with unprecedented mobility and performance like smartphones started to create new lifestyles, and to rapidly change social environments and cultures. The number of users of social networking services (SNSs) has continued to increase, and one of the most unique characteristics of SNSs is that people open and share their personal information online and establish networks with others through SNSs. As more reliable information is believed to spread around the globe through social networks rapidly and easily, SNSs started to be spotlighted as a marketing tool recently (Cho, 2017).
In addition, people also no longer trust the information unilaterally provided by businesses unconditionally, as people can get more information through new networks based on social media. Consumers who no longer trust businesses share the information they collected from personal relations through networks, and start to build new trust relations. Consumers who want more credibility in business start to find it through other consumers who they have a relation with. Some find the newly-established trust relation in social media as one solution (Cho, 2017).
In particular, social media from the perspective of companies create synergic effects as they are combined with a new trend, called “experience.” The concept of experience starts to be considered as an important aspect for business as more smart devices have been developed recently. Many businesses set providing the best experience for the users with their products or services as a business goal. Those that had a competitive advantage in technology in the existing environment of competition are now chased by businesses that have a new competitive advantage based on customer experience. The previous leaders try to brace themselves with new competitive elements again and to counterattack others in this rapidly-changing and complex market. More accurate information and one-step-ahead strategic judgements are needed to actively respond to the changing market conditions with increasing uncertainty (Bae et al., 2012).
In particular, attempts to create more involved customer experience through a precise analysis of SNSs can be an important guide for businesses to set a strategic direction wisely in this rapidly changing modern society. In the end, these attempts will result in differences in flower shops’ market adaptability which is directly related to their survival, and serve as an important foundation for defining a business model that creates unprecedented values.
As such, flower shops need to find an answer to the question - “what do consumers really want?” Credibility cannot be built through one-way communication, and consumers have objections to it, and have doubts about its credibility. New changes have already been observed in social media that have various characteristics and through smart devices that have penetrated different classes. Consumers have been creating and activating new types of commercial activities which have spread based on trust that was built between people like “social commerce” and “social funding.” Based on these changes, “strategies for social experience” need to be established along the two big axes-social and experience (Bae et al., 2012). Social experience starts to be emerged not only as a business strategy, but also as a direction that flower shops need to consider the most in order to survive beyond simple trends.
In reality, various marketing activities have already been performed using SNSs (Ahn and Kim, 2012), and have been actively researched, but more meaningful content can be created by analyzing SNSs using “big data” as they have more samples than the studies that are currently conducted. As a huge amount of data on floricultural products and services are pouring out everyday, it is very important to identify the current demand for floricultural products and trends in services using a technique called big data analysis for carrying out efficient marketing activities, developing consumer-oriented products and services, and promoting the use of floricultural products.
In terms of floricultural marketing, Heo et al. (2002) surveyed 10 offline flower shops and three online flower shopping malls on the status of sales by item, and Lim et al. (2014) conducted an online questionnaire survey on 300 consumer panels across the country through a research institute in order to predict the market of cut flowers. Another study suggested the relations between the various changing characteristics of consumers and floricultural design products based on the shopping behaviors of online consumers (Lim et al., 2012). However, there has been no study that analyzed trends in floricultural products and services through an analysis of big data of SNSs. Against this backdrop, this study aimed to identify consumers’ various needs for floricultural products and trends in services by analyzing big data of SNSs that many people use using a number of objective indicators, and thus to suggest effective SNS marketing strategies that can be used by flower shops in reality.
Research Methods
Target SNSs and analysis techniques
This study was conducted in June, 2019, and since those in their 20s and 30s were analyzed to use portal sites and social networking services (SNSs) the most and have high purchasing power, this study targeted services such as Naver, Instagram and Youtube that are widely used by those in their 20s and 30s, and show the highest growth rate.
To analyze the big data of the selected SNSs, the following four analysis methods were used: Cotton Trend (Social Matrix); Naver Big Data Lab; Instagram Big Data Analysis; and Youtube Big Data Analysis.
Cotton Trend analyzes Twitter, Instagram, Blog and news; extracts keywords and analyzes issues by analyzing hashtags that people put on SNSs; and analyzes big data by identifying how many people mentioned the extracted keywords and analyzing their related words and sentiment (positive, negative) (Updatenjobgo, 2018).
Naver Big Data Lab provides search trends and the history of fast rising search words on Naver, and search trends by shopping category, creates big data based on the weight of individual devices, genders and age groups, and analyzes statistics by region that are useful for offline businesses (Updatenjobgo, 2018).
The most important thing in Instagram Big Data Analysis is the criteria for sorting Instagram feed rankings, and it is necessary to understand the algorithm of Instagram to do so. The first is “interest (individuals’ tendency).” Instagram Feed shows photos based on the areas of photos users have “liked,” and photos that users have written comments and hashtaged on, and have shared. The second is “recency (popularity).” Recent posts that were shared between users are analyzed. The last one is “relationship.” The closeness and relationship of users with their followers are analyzed based on the comments that followers wrote and how frequently users have tagged their followers, and Instagram Feed exposes photos based on the results. This algorithm not only analyzes big data, but also current trends in big data (Updatenjobgo, 2018).
Youtube Big Data Analysis focuses on the “number of subscribers” and the “time of watching videos.” It is possible to obtain meaningful data by analyzing the number of subscribers of top ranking channels, the time of watching videos, the number of search queries and “likes” as big data (Updatenjobgo, 2018).
Selection of keywords
Words related to floricultural products and services including “flower shop,” “bouquet” and “flower” were used as a keyword, and words, such as green interior, master gardner, planterior and flower one-day class, that were extracted by analyzing the frequency of keywords used in the floricultural sector using Social Matrix in advance were additionally searched. Words related to flower delivery, and bouquet and bouquet style were also added as a floricultural product.
Here, Social Matrix not only provides objective data, but also analyzes the emotions that people feel and provides the results as big data. As it extracts related keywords using the map of related words, such data can be utilized in marketing activities. However, since the words included in its collected documents are suggested based on the attributes of words set within Social Matrix, the collected and analyzed results might not be matched. The process of collecting and analyzing social big data is very complex and detailed, and statistics can differ depending on who collected and analyzed which data on what purposes, and how they did so. In other words, it is necessary to collect documents in which the keywords analyzers want are included from various channels, to extract only credible content from the collected documents, and to analyze their reliability. After that, the content needs to be re-organized to utilize them for marketing activities or for other uses and purposes.
Consumers’ consumption patterns of floricultural products
To identify the consumption patterns of consumers of floricultural products, trends in search words related to flowers on Naver for one year from May 25, 2018 to May 24, 2019 were analyzed using big data on June 1, 2019. The reason why the big data of Naver were analyzed among many search engines was that Naver, as the No. 1 search portal site in Korea, has the biggest amount of big data, and their reliability is high.
Analysis of popular search words and search volume by device and demographic characteristic
Popular search words and their search volume over the past year from May 1, 2018 to April, 30, 2019 were analyzed through Naver Big Data Analysis, and the share of the mobile devices and personal computers (PCs) used to search the words, the share of males and females, and different age groups were analyzed.
Trends in search words related to flowers for the recent three years
Changes in the volume of search on floricultural products related to “flower delivery” for the recent 3 years were examined by collecting big data from Naver, a portal site that shows the highest search volume in Korea, and the period was divided into three sections as follows: 1) January 1–December 31, 2016; 2) January 1–December 31, 2017; and 3) January 1–December 31, 2018. Search words related to flower delivery were selected among the top 50 keywords including flower bouquet, flower basket, wreath, flower pot for business opening, orchid, western orchid, flower box, large flower bouquet, 100 roses, and celebratory wreath.
Analysis of trends in styles of floricultural products
Instagram, an SNS platform of which content is mainly composed of sentimental and impactful photos and videos, was targeted, and “flower bouquet,” a popular floricultural product, and “wedding bouquet,” one of the products that represent wedding, were selected as keywords. Big data analysis was conducted focusing on design aspects such as natural, classic, French-style and English-style to identify trends in the keywords.
Results and Discussion
Recent trends in keywords related to floriculture
Recently, people’s interest in floricultural products and related services such as green interior, master gardner, planterior and flower one-day class is ever increasing. The number of posts related to green interior on Instagram was over 70,000 (as of June 20, 2019), and the number of search queries for the top 3 posts on Youtube was 273,817, which indicates that many people are interested in them (data not shown). The number of posts on “flower one-day class” on Instagram reached over 60,000 (as of June 20, 2019), and the number of the posts of a flower shop that has the highest number of subscribers on Youtube (16,704 subscribers; as of June 6, 2019), and the total number of search queries for the posts was 75,947. Its number of subscribers and search queries has continued to increase everyday (data not shown).
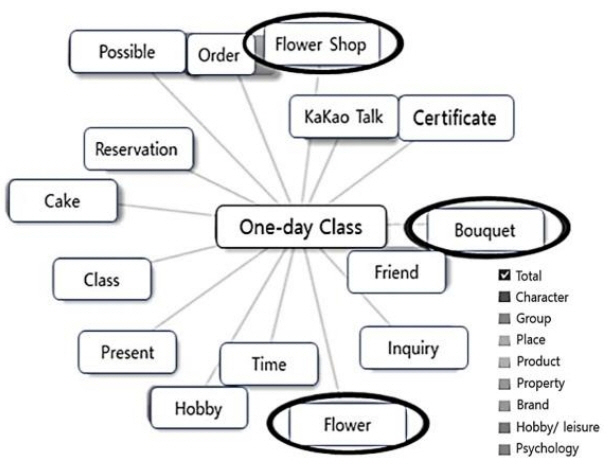
Big data on “one-day class” for which demand is growing recently were collected for 2 months from April 1 to May 30, 2019 (as of June 1, 2019), and it was found that 3 out of a total of 15 keywords were those related flowers including “flower shop,” “flower bouquet” and “flower” (Fig. 1). Various materials are used in one-day classes, and people’s interest in and demand for one-day classes related to floricultural products among them have been on the rise. These results seem to be very important from the perspective of the “customer-oriented marketing” of sellers who try to hide their obvious profit-driven behaviors, and to induce consumers’ direct experience and voluntary purchasing needs (Kim, 2009; Lee, 2015).
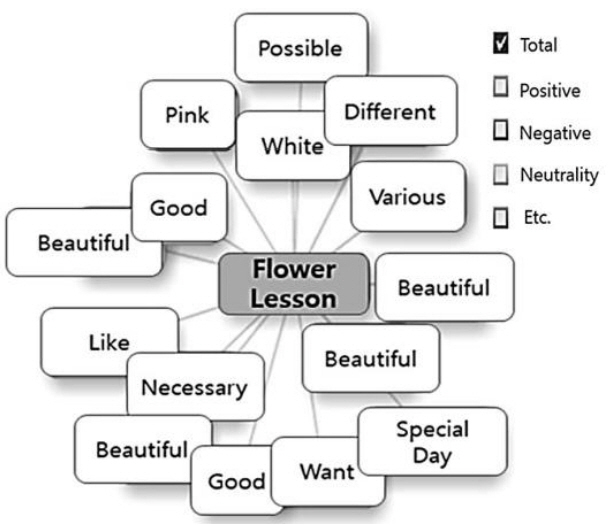
Since it is very important to identify emotions that potential consumers feel about products and services in reality, it is necessary to examine whether people’s growing demand for and interest in flower products and services can result in positive emotions (Kim, 1998). With “flower lesson” as a keyword, big data on the category of emotions were analyzed (as of June 1, 2019), and 10 positive emotions, three neutral emotions and two other emotions related to color were collected (Fig. 2). These results demonstrate that the demand for flower one-day classes among other one-day classes is high, which results in very positive emotions that consumers feel.
However, it does not mean that only positive aspects exist. The fast rising keywords related to flowers from April 1 to May 30, 2019 (Table 1) show that many people think that “flowers are expensive.” While people’s interest in floricultural products and related services is high, and their emotions towards them are very positive, there was a high barrier to entry called “expensiveness.” Given the results of the big data analysis discussed above, it is absolutely necessary to ensure consumers have various direct and indirect experiences voluntarily (Kim et al., 2018).
Consumers’ consumption patterns of floricultural products
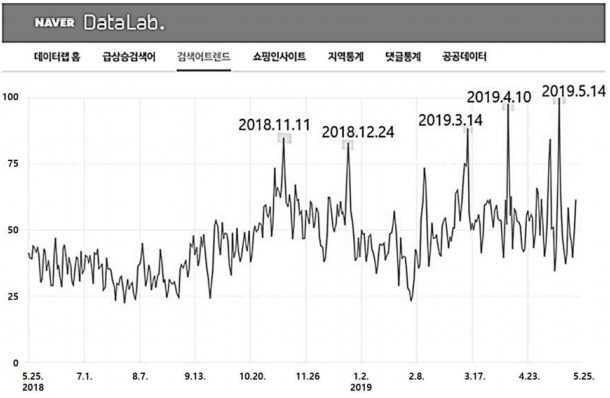
To identify the consumption patterns of consumers of floricultural products, trends in search words related to flowers for one year (May 25, 2018–May 24, 2019) were analyzed using the big data of Naver (Fig. 3), and it was found that flower-related search words rose fast on special days or the day before those when the consumption of flowers increases such as November 11 (Pepero Day), December 24 (Christmas Eve), March 14 (White Day) and May 14 (Rose Day and Teacher’s Day). Heo et al. (2002) compared the share of the monthly sales of offline flower shops, and reported that the share of March (12.5%), April (11.5%), and May (10.7%) was high, while that of July (5.5%), August (5.8%), and June (6.6%) was low. They also compared the share of the monthly sales of individual products, and it was found that the sales of flower baskets in March and December were the highest, and that those of flower bouquets in February when graduation ceremonies are held were the highest. In terms of the share of the monthly sales of online shopping malls, the share of May (15.4%), March (12.2%) and September (10.8%) was high, while that of February (3.9%), June (4.7%), and April (5.7%) was low, showing distinct differences between months and seasons (Heo et al., 2002). Although these results were released 18 years ago, they seem to show similar patterns to those in the present. This is a good example that shows that consumption of floricultural products has not been conducted on a daily basis. As such, people working in the floricultural sector need to come up with measures to address the phenomenon of rapidly increasing consumption of floricultural products on special days only (Park, 2005).
In general, consumers tend to be satisfied with cut-flower products, but to think that plants quickly wither and die, and are expensive (not cost-effective). In addition, even flower shops that sell flowers price them differently, and consumers have little understanding of cut flowers (B.S. Kim, 2005). Although the period of enjoying cut flowers is relatively short, and the quality of products is low, cut flowers are sold at high prices and are recognized as an expensive product as the purposes of purchasing cut flowers are mostly gifts (graduation, wedding, funeral, birthday, anniversary, business opening, etc.; Jung, 2010).
As mentioned above, since there is a high barrier to entry for flowers as an expensive product, they need to be price-competitive, or there needs to be a motivation for buying flowers despite their “expensiveness.” For this reason, it is necessary to understand individual consumers’ interest and needs, to provide products based on them, and thus to secure competitiveness.
Trends in floricultural products
Among the top 500 search words, the frequency of words related to floricultural products was analyzed and ranked, and the most frequently searched word was flower bouquet (126 times mentioned among the 500 words; Table 2). A flower bouquet, as a bunch of flowers, is widely used as a decoration of cut flowers, and compared to other flower decorations the marketability of flower bouquets is the highest due to its mobility. The second popular word was flower wreath that is used to celebrate weddings or mourn deaths, and this result can be attributed to the fact that flower wreaths are used in various formal occasions compared to other products consumed for personal purposes. The third most frequently searched word was flower basket. The life of flowers used in flower baskets is relatively long due to the floral foam used in the baskets, and its mobility is also high.
Next, the species of flowers mentioned among the top 800 search words related to flowers were analyzed. “Rose” was mentioned most frequently, and various types of roses were searched (Table 3). The second most frequently searched flower was “tulip,” and the third was “freesia (huresia and hureesia included).” The fourth was “pompon chrysanthemum,” and its common names, pongpong and pongpong mum were found to be more searched. “Carnation” that is mostly consumed on special days and “peony” that is a seasonal flower were also searched frequently. One thing interesting in the results of the big data analysis was that when the big data were collected based on the “number of posts” on Instagram after searching materials of flower bouquets, the order of flowers was identical to that of flowers obtained from the analysis of big data of Naver as follows: rose, tulip, freesia, pompon chrysanthemum, carnation and peony (Table 4). This indicates that big data tools can be compatible.
Under the topic of “flower delivery,” the top 500 popular search words on Naver were analyzed, floricultural products related to “money” were 36 out of the 500 search words, accounting for a relatively large share. For instance, “money flower bouquet” and “money flower box” were searched, and this shows that combining floricultural products with other popular or practical materials, not simply offering floricultural products, can satisfy both the needs of consumers and the services of florists.
Other keywords for certain types of events or situations were also often searched as follows: flowers for graduation ceremony, flower arrangement for church, trunk propose, flower subscription, real flower corsage, propose flower, Pepero Day flower, birthday flower, Parents’ Day flower, flower for business opening, birthday party flower, real flower necklace, flower shop name, etc.
Popular search words and search volume by device and demographic characteristic
Trends in popular search words over the past year (May 1, 2018–April 30, 2019) were analyzed, and the use rate of personal computers (PCs) and mobile devices was compared. It was found that the share of mobile devices was 90%, 9 times higher than that of PCs (10%) (Fig. 4A). Earlier studies that analyzed the ratio of purchasing floricultural products online (e-commerce, mail order, Internet shopping mall) through a questionnaire survey were reviewed, and the share of e-commerce was 13.7% (Kim, 2001). The share of those who purchased them via mail order was 32.5% (J.S. Kim, 2005), and that of those who purchased them via Internet shopping mall, 34% (Lim et al., 2012), indicating that the share of online shopping has continued to increase. This trend seems to lead to the recent rapid increase in the share of searching and purchasing products using mobile devices.
In terms of the gender of those who searched keywords, the share of females was 68%, two times higher than that of males (32%; Fig. 4B), which is similar to the results of Lim et al. (2012) that 66% of the Internet consumers of floricultural design products were females. This indicates that searching and purchasing products online through SNSs showed a similar tendency to the results of online search and purchase. The results that the share of females who searched products was higher than that of males can be interpreted from a different perspective. For example, males tend to feel a barrier to entry in using the services of flower shops such as inconvenience. Therefore, providing systems or services that can address such barriers can be an efficient marketing tactic both for online and offline environments.
Lastly, the share of age groups who searched popular search words was also analyzed, and the share of those in their 30s was the highest, followed by those in their 20s and those in their 40s (Fig. 4C). Lim et al. (2012) reported that the share of those aged between 31 and 35 who purchased flower design products online was the highest (25%), and that when the age range was extended, those in their 20s and 30s accounted for 83%. B.S. Kim (2005) reported that the share of females in their 20s who purchased products via mail order was the highest (69.5%). These results indicate that as technology has been advanced over time, the age range of those who purchased products online has been extended, and the age range of those who searched products, the preliminary stage of purchasing, has been also extended. In addition, since the difference between the share of those in their 20s and 40s was not significant, it seems to be safe to say that those in their 20s and even 40s who search keywords are likely to purchase products as well.
Meanwhile, in order to establish marketing strategies suitable for different age groups, it is necessary to examine the status of using SNSs by age group. Wiseapp analyzed the big data of 33,000 Android smartphone users who were sampled in Korea for 2 years from May, 2017 to May, 2019, and found that those in their 10s (2 billion minutes) and 20s (1.5 billion minutes) used Facebook and Youtube for the longest hours: those in their 30s, Instagram (0.9 billion minutes); those in their 40s, Naver Blog (an Internet cafe; 0.7 billion minutes); and those in their 50s or older, Band (0.8 billion minutes; Hwang et al., 2015). As such, since each channel is used by different age groups, it can be said that the needs of users of each SNS service for floricultural products and services differ, and thus it is necessary to differentiate marketing methods and content by channel for efficient marketing activities.
Trends in search words related to flowers over the recent 3 years
Changes in the search volume of floricultural products related to “flower delivery” for the recent 3 years were analyzed with the big data collected from Naver. The top 50 keywords related to “flower delivery” that were most frequently searched were listed, and they included flower bouquet, flower basket, wreath, flower pot for business opening, orchid, western orchid, flower box, large flower bouquet, 100 roses and celebratory wreath.
The monthly search volume in 2016 was examined, and it was found that the search volume between February and May was high. Among the top 30 days that recorded the highest search volume in 2016, there were 1 day in January, 12 days in February, 5 days in March, 1 day in April, and 11 days in May (Fig. 5A). The average monthly search volume and the search volume of the top 30 days show that the search volume of words related to flower delivery tended to be high in the first half, in particular, in February and May. The monthly search volume in 2017 was also analyzed, and the search volume of such words tended to be high in February and March (Fig. 5B). Among the top 30 days that recorded the highest search volume in 2017, there were 22 days in February, 5 days in March, 2 days in April, and 1 day in May. Compared to the data in 2016, the data in 2017 show that the overall search volume throughout the year decreased, and that the search volume in April and May was significantly reduced. The results of the big data analysis in 2018 also showed that the monthly search volume tended to be high in February and May (Fig. 5C). Among the top 30 days that recorded the highest search volume in 2018, there were 3 days in January, 15 days in February, 1 day in March, 1 day in April, 8 days in May, 1 day in June, and 1 day in August.
Trends in the monthly search volume of search words related to flower delivery indicate that the search volume in February and May both in 2016 and 2018 tended to be high, but the overall search volume in 2017 as well as the monthly search volume in April and May decreased (Fig. 5). The difference can be attributed to the Improper Solicitation and Graft Act (the Kim Young-ran Act) that was enacted on September 28, 2016. According to Article 17 of the Enforcement Decree of the Act, any food worth over 30,000 won, any money gift for congratulation or condolence worth over 50,000 won (100,000 won for wreath) and any gift worth over 50,000 won (agricultural or fishery products worth over 100,000 won) are prohibited. As the policy was implemented, the consumer confidence seemed to shrink, affecting the floricultural industry.
The total number of search queries for keywords related to “flower delivery” for one year was 16,773 in 2016, 13,601 in 2017, and 14,288 in 2018. As the Kim Young-ran Act was enacted, the number related to the floricultural industry seemed to be slightly reduced in 2017, but showed a small increase in 2018.
Analysis of trends in the style of floricultural products
Big data on “flower bouquet,” one of the most popular floricultural products, and “wedding bouquet,” the most symbolic product for weddings were collected from Instagram, an SNS platform of which content is mainly composed of sentimental and impactful photos and videos, and the collected big data were analyzed by focusing on their design aspect (Table 5). The results show that natural designs that highlight the mood and purity of nature, such as hardwood interior, Scandinavian furniture and planterior using plants, were more observed than artificial designs, and recently natural designs are frequently observed not only in floricultural products but also in various areas (Tercek and Adams, 2013).
Flower designs can be divided into English style that highlights standard designs and French style that highlights natural designs. Based on these two categories, the big data of Instagram were analyzed. Each style’s hashtaged (#) floricultural products were analyzed, and the total number of posts and the content of photos were also examined. A hashtag (#) is used in front of a certain word or sentence, and the tagged messages can be searched using the word or sentence. All the posts related to the tagged word are shown in grid, and it is also possible to group the tagged messages by topic.
Using “flower bouquet” as a keyword, posts on English and French-style bouquets on Instagram were analyzed, and the number of posts on English and French-style bouquets was 58 and 7,297 respectively, showing a huge difference (as of July 1, 2019; Table 5). English-style flower bouquets are similar to classic flower bouquets, and French-style flower bouquets are recognized as natural flower bouquets (Kim, 2018). For this reason, the total number of posts on class and natural flower bouquets was also analyzed, and there were 180 posts on classic flower bouquets and 1,218 posts on natural bouquets (675 posts on “내추럴 in Korean” and 543 posts on “네추럴 in Korean”), showing a huge difference.
Among the floricultural products related to wedding, big data on “wedding bouquet” were collected from Instagram and were analyzed (as of July 1, 2019), and the total number of posts on “bouquet” was 975,200 (Table 5). Using the same conditions used for “flower bouquet,” the number of posts on “English-style bouquet” was counted to be 9, and that on “French-style bouquet,” 16,519, which indicates that French-style bouquets dominate the designs of bouquets.
The number of posts on classic bouquet, recognized as a similar design to English-styles bouquet, was 387, and the number of posts on natural bouquet, recognized as a French-style bouquet, was 9,905 (3,547 posts on “내추럴 in Korean” and 6,447 posts on “네추럴 in Korean”). In other words, the results of the big data analysis demonstrate that natural French-style bouquets are the recent trend, which in turn indicates that trends in the designs of floricultural products can be identified by analyzing big data.
Conclusion
The sales of farms that produced floricultural products in Korea has continued to decrease from 1.105 trillion won in 2005 to 538.5 billion won in 2018 (Ministry of Agriculture, Food, and Rural Affairs, 2019). This decrease in the production amount in the domestic floricultural industry can be attributed to various causes including its worsened competitiveness due to increasing costs of production, but the industry has also provided products and services without understanding changes in the needs of consumers. Against this backdrop, this study analyzed big data of social networking services (SNSs) that are rapidly evolving to identify the demand for floricultural products and recent trends in related services.
The following findings of the analysis were obtained. The demand for flower one-day classes has increased, and consumers’ sentiment towards them was also positive, which indicates that consumers’ needs for direct and indirect experiences are strong. Consumers these days have specific designs in mind, and show more positive attitudes towards purchasing floricultural products. The demand for flower bouquet was the highest, followed by wreath, flower basket, large flower bouquet, orchid, flower box, wedding bouquet and flower pot, and in terms of the species of flowers, the demand for rose was the highest, followed by tulip, freesia and pompon chrysanthemum. The share of females who purchased floricultural products through SNSs was higher than that of males, and the share of those using SNSs with mobile devices was over 90%, overwhelmingly higher than that of personal computers (PCs). In addition, trends in the search volume for the recent 3 years from January 1, 2016 to December 31, 2018 were analyzed, and it was found that the search volume from February to May tended to be high. From the aspect of design, consumers tended to prefer natural designs to standard styles.
These results are expected to be utilized by flower shops to set objective directions for marketing activities. As a future marketing strategy for flower shops, it is recommended to promote their products and services through SNSs based on the results of big data analysis, to identify the types of flowers preferred by consumers and trends in floricultural products, and thus to combine them with the sentiment of florists wisely in designs. It is also important to select suitable SNSs for different genders and age groups in order to differentiate marketing strategies effective for each target.
It is important to extract useful data from big data, but it is also essential to provide institutional support for developing “customized applications” for individuals’ different interest, characteristics and consumption patterns in order to satisfy consumers’ needs. In the process of implementing the Act on the Development of the Floricultural Industry and the Promotion of Floricultural Culture enacted in August, 2019, the big data analysis method used in this study can be utilized to understand the present and future of the floricultural industry, and to establish policies based on them.
Still, there is a limitation in this study. Information providers - that is, flower shops - tend to put more hashtags on their posts in order to expose their feed to consumers regardless of the content of their posts and photos. Under a certain category, posts irrelevant to the category can be included, which reduces the consistency of their content. To address this problem, it will be necessary to subdivide categories and keywords as small as possible when analyzing big data in order to obtain, process and analyze data more accurately.